
 Facebook
 X
X
 Pinterest
 Copy Link
Nova Scotia Real Estate Market Stats January 2026: Prices Climb 11.3% as Sales Volume and Market Pace Cool Significantly
By Rob Lough, Broker/Owner, Century 21 Optimum Realty Published February 2026
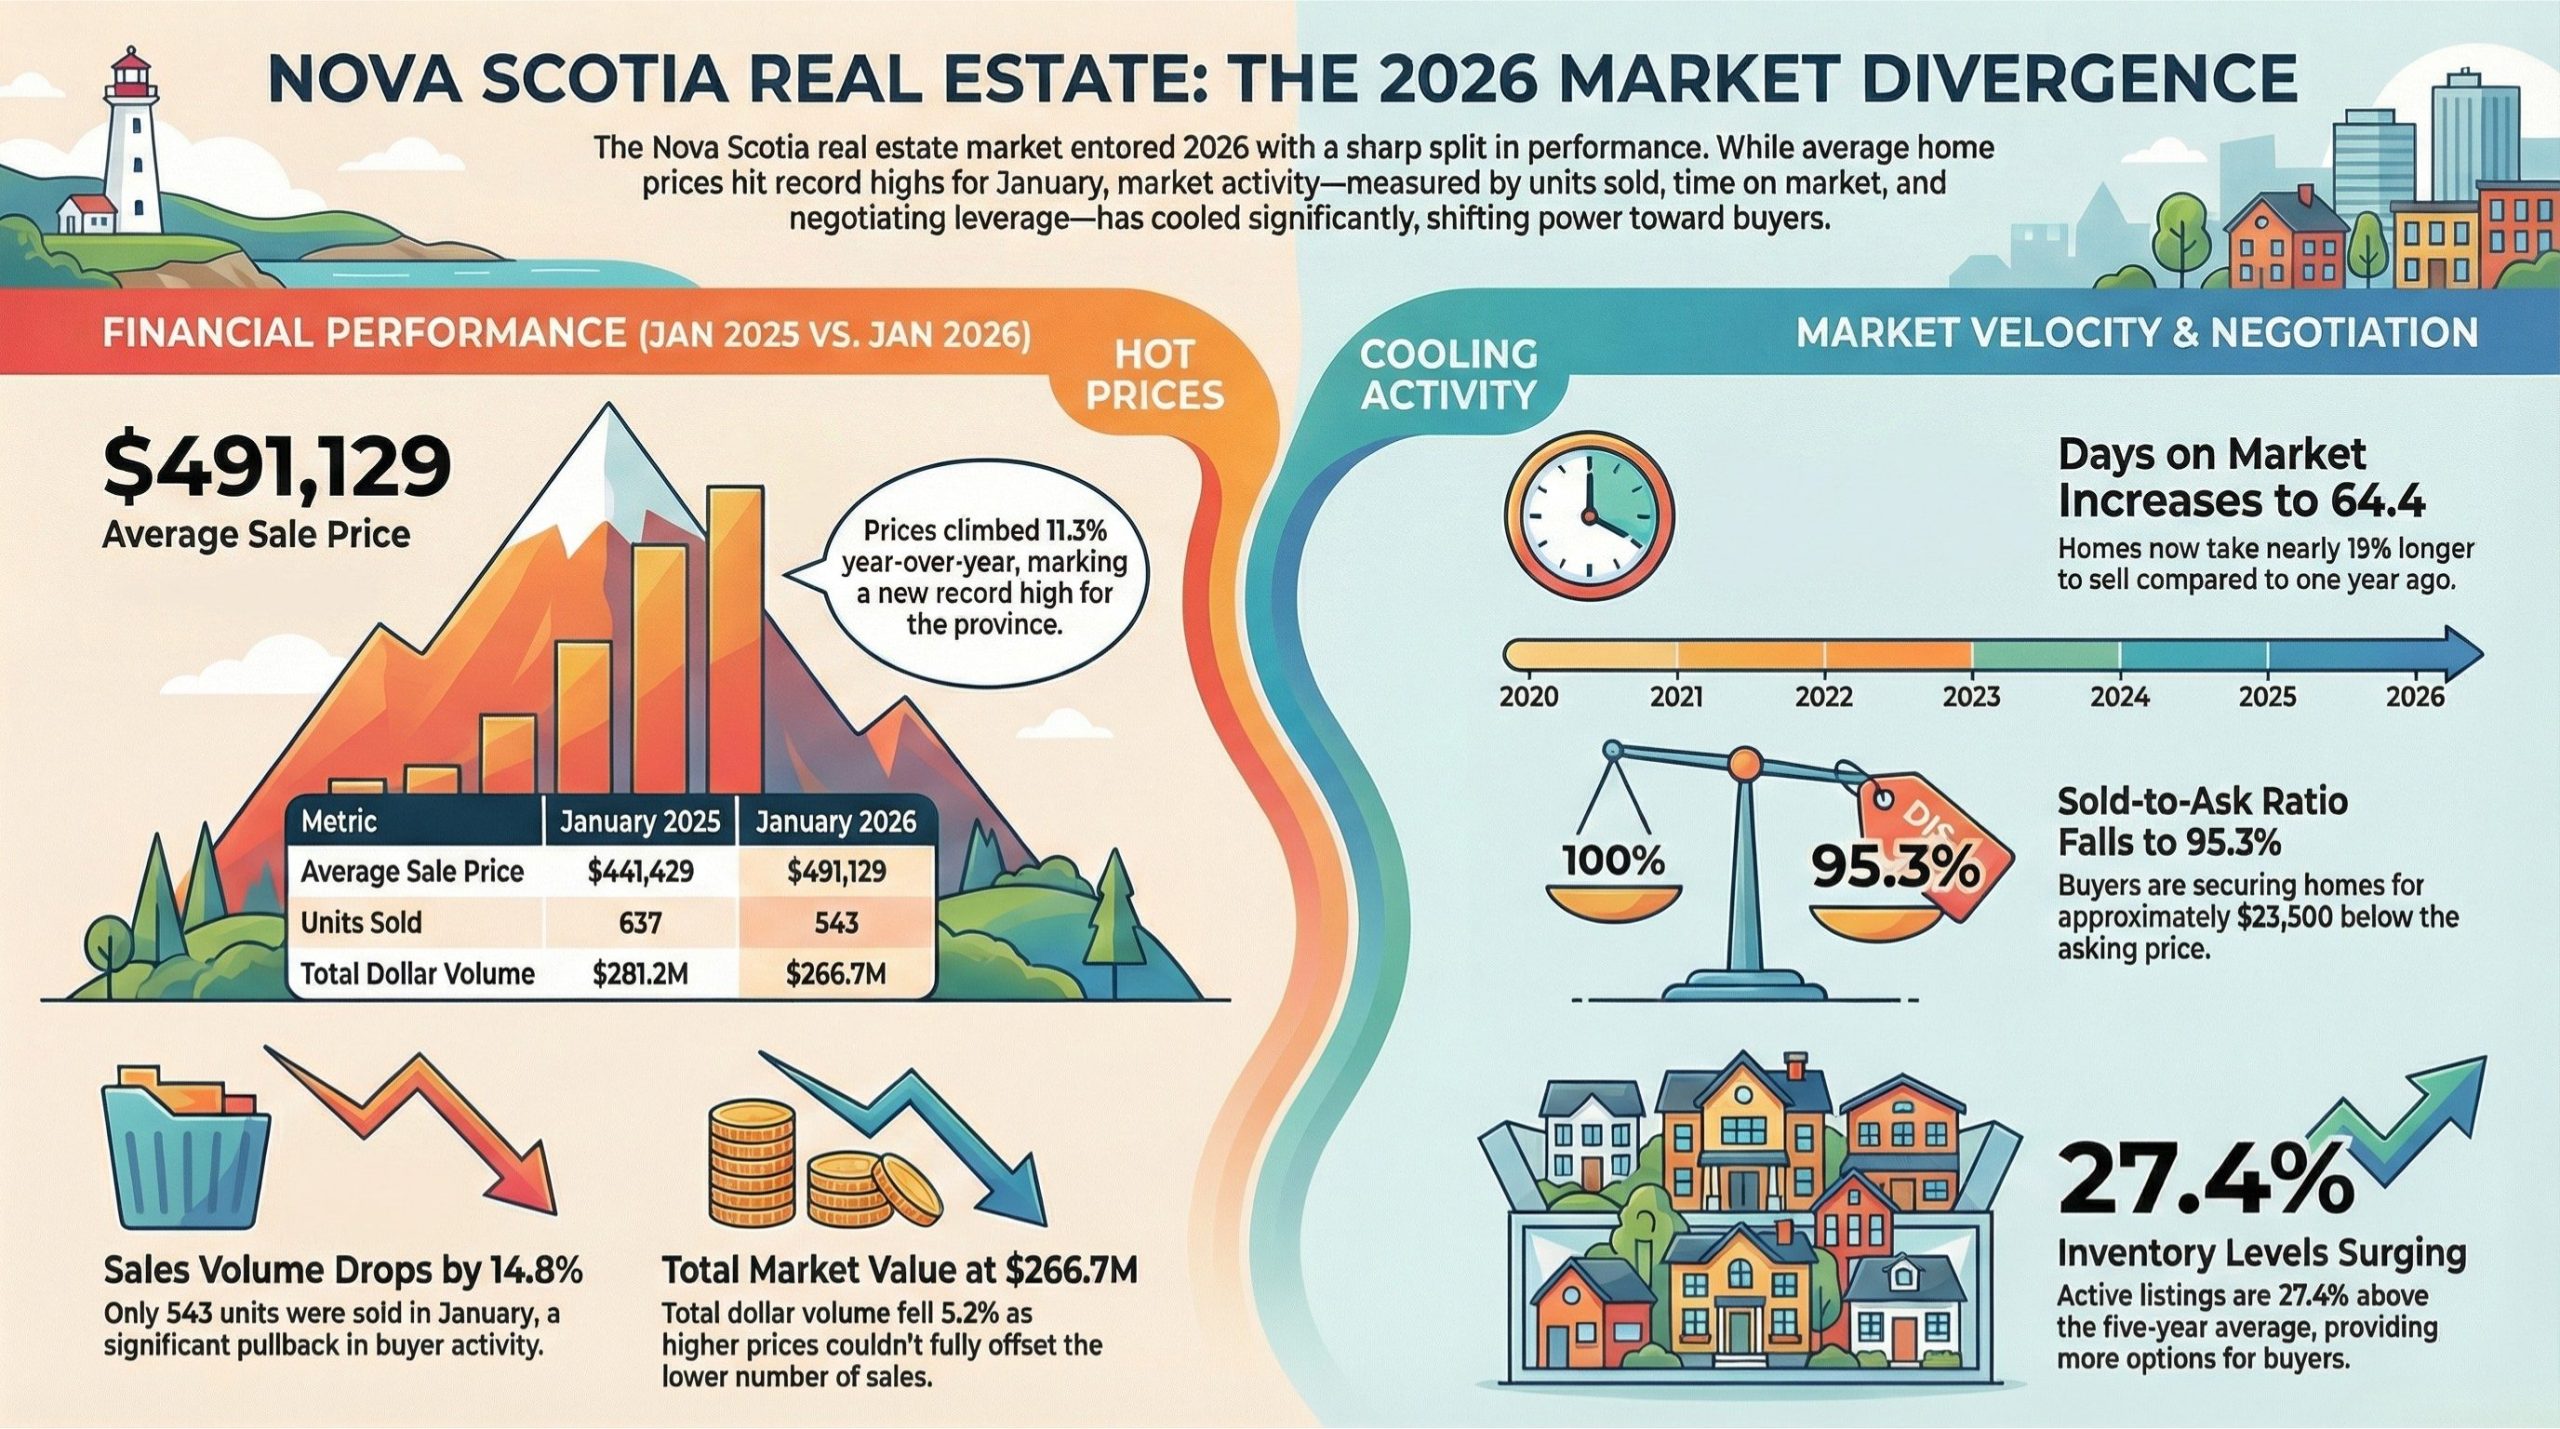
Nova Scotia’s residential real estate market entered 2026 with a sharp divergence between price growth and market activity. Average home prices are up 11.3% year over year, but nearly every other indicator (units sold, total dollar volume, days on market, and sold-to-ask ratios) is flashing yellow. Fewer homes are selling, they’re taking longer to move, and buyers are negotiating harder than they have in over a year.
The Bank of Canada held its overnight rate steady at 2.25% on January 28, 2026, signaling a prolonged pause that’s expected to last through much of the year. With the prime rate sitting at 4.45% and the lowest five-year variable rates around 3.35%, borrowing costs have stabilized, but they remain well above the ultra-low levels that fueled Nova Scotia’s pandemic-era boom.
Here’s a full breakdown of where the market stands heading into 2026, how it compares to January 2025, and what it means whether you’re buying or selling.
Average Sale Price: $491,129, Up 11.3% Year Over Year
Average Prices of Solds January 2026 Market Stats Nova Scotia
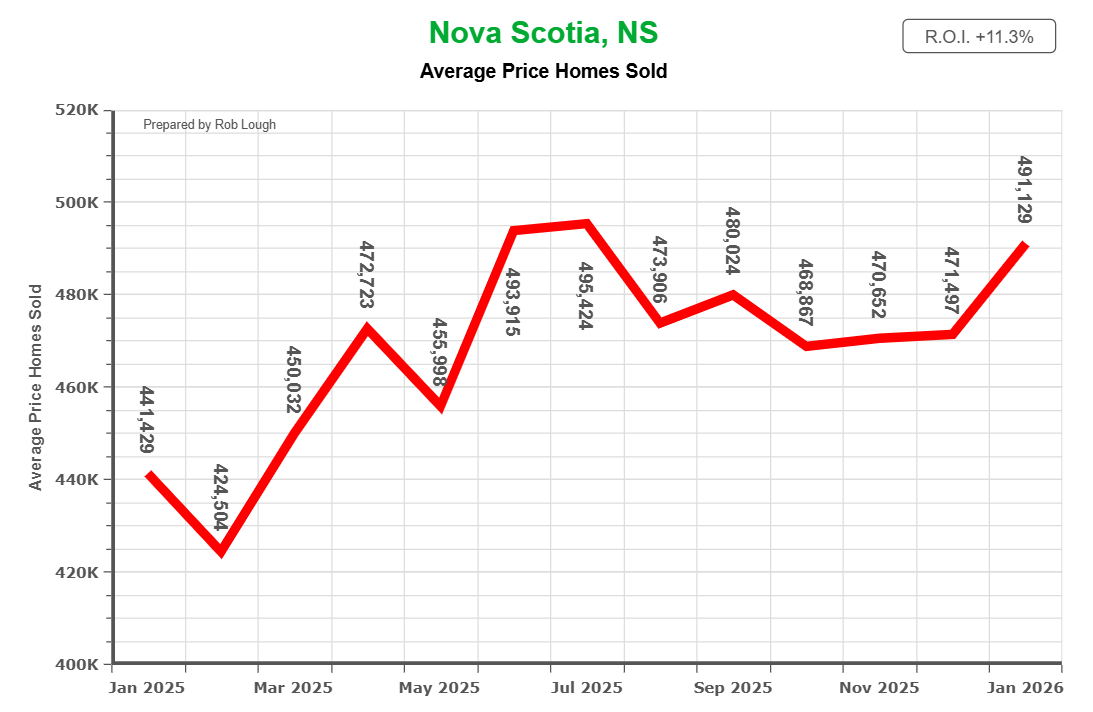
Nova Scotia’s average sale price reached $491,129 in January 2026, up from $441,429 in January 2025, a year-over-year increase of 11.3%. That’s the highest January average on record for the province and a new peak in the 13-month dataset.
Prices climbed steadily through the spring of 2025, reaching $472,723 in April before dipping slightly in May ($455,998). The summer months brought the strongest readings, with June ($493,915) and July ($495,424) both pushing above $490K. A pullback followed through the fall, with averages settling in the $468K to $471K range between September and November, before the sharp January 2026 rebound pushed prices past the summer highs.
That pattern is important. Despite slower sales, longer days on market, and weaker sold-to-ask ratios, prices haven’t corrected. Population growth, limited housing supply, and sustained demand from interprovincial migration continue to put upward pressure on values even when buyer activity cools seasonally.
What this means for sellers: Your equity position is significantly stronger than it was 12 months ago. Even with seasonal softness through the fall, prices rebounded past summer peaks heading into 2026. Curious what your property is worth in today’s market? Get a free home valuation.
What this means for buyers: Prices haven’t corrected, even as other metrics shift in your favour. If you’re waiting for a meaningful price drop, the data doesn’t support that expectation, at least not yet. If you’re ready to move forward, getting pre-approved for a mortgage is the smartest first step to understanding what you can afford at today’s rates.
Units Sold: 543, Down 14.8% From January 2025
Number of Units Sold January 2026 Market Stats Nova Scotia
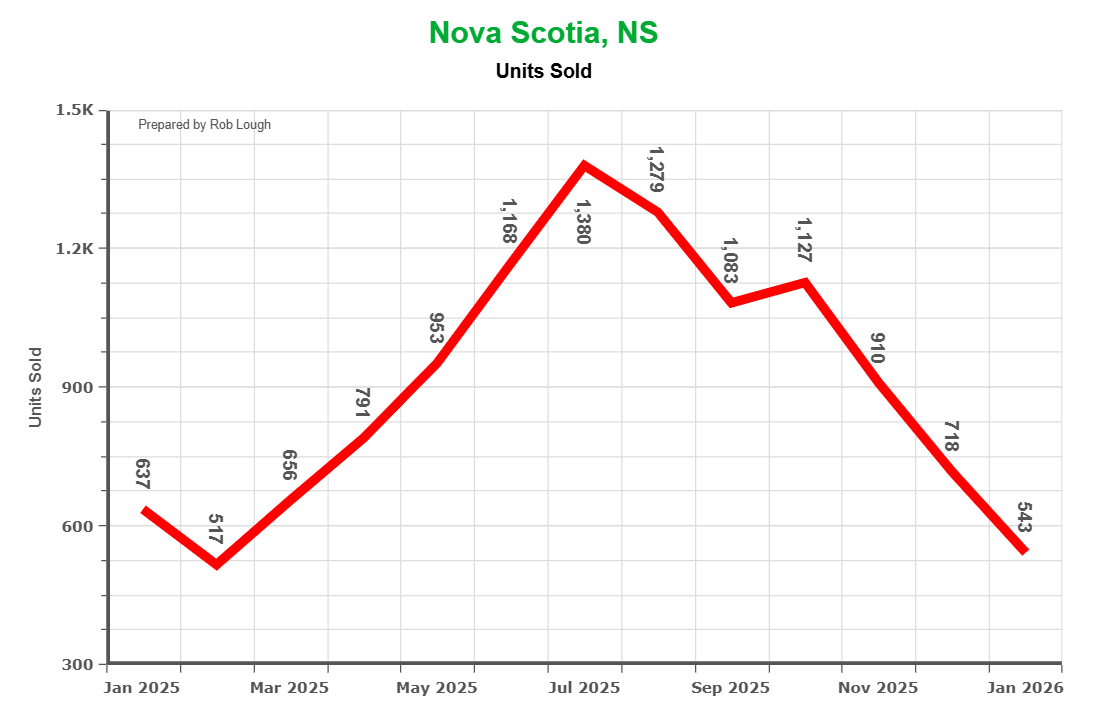
Nova Scotia recorded 543 residential sales in January 2026, a significant decline of 14.8% from the 637 units sold in January 2025. That’s not just a seasonal dip. It represents a meaningful year-over-year pullback in buyer activity during what’s already the slowest month of the year.
Monthly sales followed a classic seasonal bell curve through 2025, climbing from 637 in January to a peak of 1,380 units in July, before declining steadily back to 543 by January 2026. February 2025 was the year’s low point at just 517 units, and while January 2026’s figure is higher than that winter trough, the year-over-year comparison tells the real story: fewer buyers are transacting now than at the same time last year.
According to NSAR data, year-to-date sales through the first 11 months of 2025 were essentially flat compared to 2024, with 10,464 units sold, virtually unchanged from the prior year. The January 2026 drop suggests that plateau may be tilting downward as we enter the new year.
Total Dollar Volume: $266.7M, Down 5.2% From January 2025
Dollar Value of Units Sold January 2026 Market Stats Nova Scotia
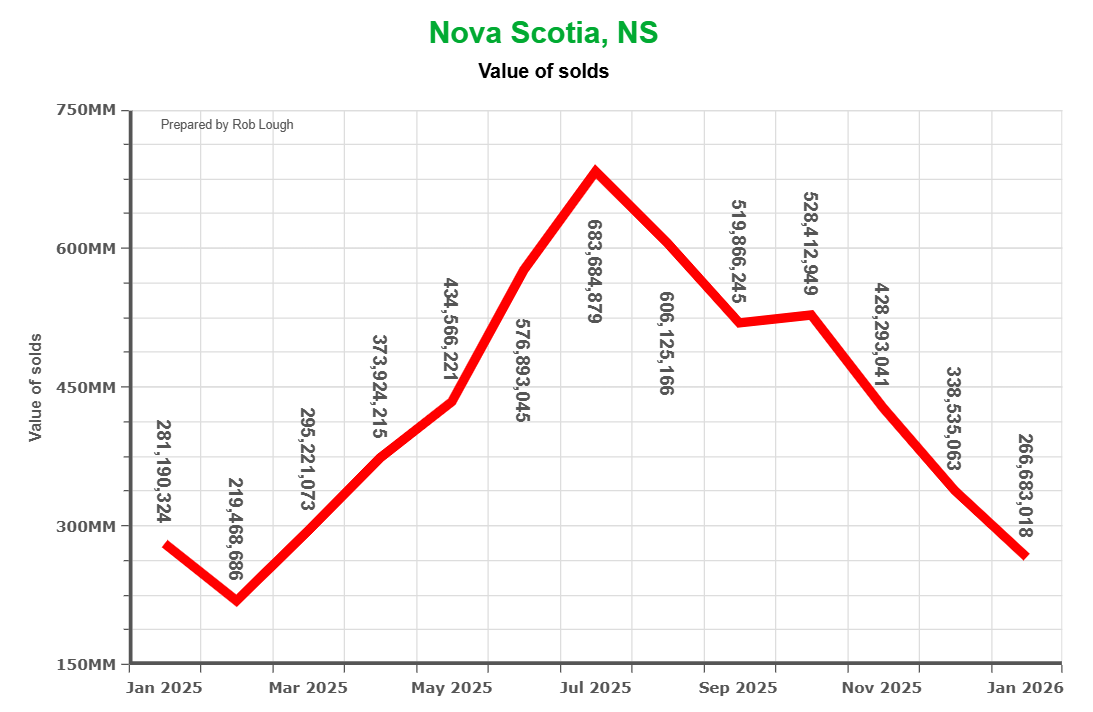
The total value of homes sold in January 2026 came in at approximately $266.7 million, down from $281.2 million in January 2025, a year-over-year decline of roughly 5.2%. While higher average prices partially offset the drop in unit sales, the net effect was still a reduction in total market activity.
Through 2025, dollar volume followed the same seasonal arc as unit sales, rising from $281M in January to a peak of $683.7M in July, then declining through the fall and into the following January.
The combination of fewer transactions and seasonal softness drove total volume down by over 60% from peak to trough. For context, NSAR reported that the dollar value of all home sales in November 2025 was $354.3 million, itself a 9.5% decline from November 2024. The trajectory into January continued that cooling trend.
This matters beyond the real estate market itself. Lower transaction volume means reduced activity across the entire ecosystem, including mortgage lending, legal services, home inspections, moving companies, and renovation spending. All of these sectors feel the ripple effects of a quieter market.
Days on Market: 64.4 Days, Up 14.8% From January 2025
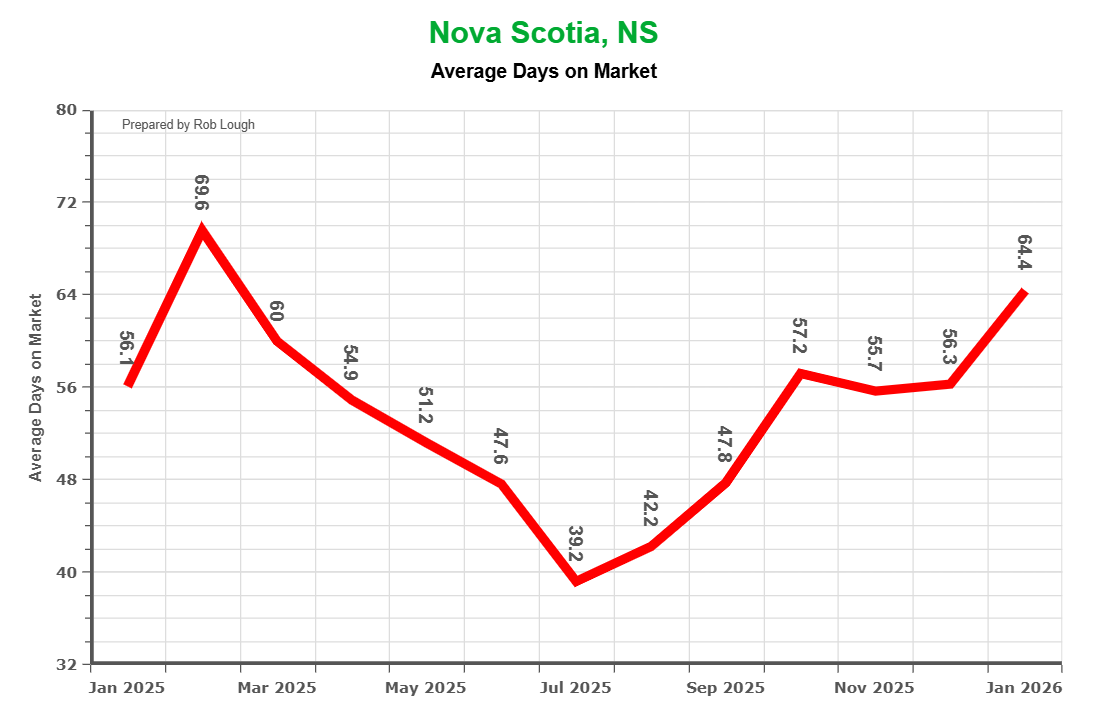
Average Days on market January 2026 Market Stats Nova Scotia
Average days on market (DOM) is one of the most telling indicators of market velocity, and the year-over-year comparison here is striking. Homes took an average of 64.4 days to sell in January 2026, up from 56.1 days in January 2025, an increase of 8.3 days, or 14.8%.
The full-year trend tells the story of two very different halves. DOM spiked to 69.6 days in February 2025, then improved dramatically as spring competition heated up, reaching a low of just 39.2 days in July 2025 when properties were moving fast. From there, the trend reversed sharply. DOM climbed every month through the second half, landing at 64.4 days by January 2026, the second-highest reading in the full 13-month period behind only the February 2025 spike.
Notably, NSAR data showed that even summer DOM in 2025 (around 40 days) was higher than the 28 to 30 day averages seen during the 2021 boom. The market is normalizing, and buyers are taking more time with decisions. That’s healthy, but it means sellers need to adjust their expectations accordingly.
What this means for sellers: Pricing strategy is more important than ever. The “list it and they’ll come” approach that worked in early summer is not effective in today’s market. Overpriced listings are sitting. Work with your Realtor to price competitively from day one and ensure your home shows at its best. For more guidance, see our tips for sellers.
What this means for buyers: You have more time and less pressure than at any point in the past year. The urgency of mid-summer has faded entirely, giving you room to do your due diligence, negotiate terms, and make informed decisions without the fear of losing out to competing offers. Check out our advice for buyers for more on how to navigate this market.
Sold-to-Ask Ratio: 95.3%, Down 2.1 Points From January 2025
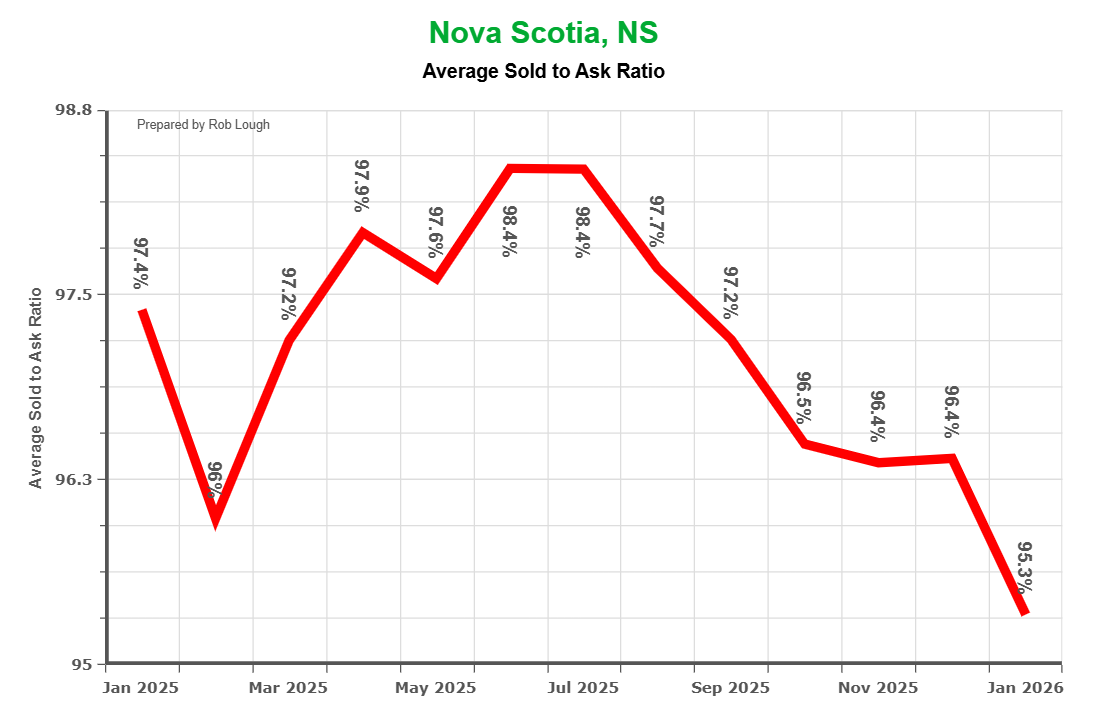
Sold to Ask Ratio January 2026 Market Stats Nova Scotia
The average sold-to-ask ratio (the percentage of listing price that buyers actually pay) dropped to 95.3% in January 2026, down from 97.4% in January 2025. That 2.1 percentage point decline is the most significant year-over-year shift in the dataset and signals a meaningful transfer of negotiating power from sellers to buyers.
On a $500,000 home, the difference between 97.4% and 95.3% represents roughly $10,500 in additional negotiating room compared to a year ago. At 95.3%, buyers are securing homes approximately $23,500 below asking price on average.
The ratio peaked at 98.4% in June and July 2025, when properties were selling at or very near full list price during the summer rush. From August onward, it declined steadily and consistently: 97.7% in August, 97.2% in September, 96.5% in October, 96.4% in November and December, and finally 95.3% in January 2026, the lowest reading in the full 13-month dataset.
This is the clearest signal in the data that the balance of negotiating power has shifted toward buyers. A sold-to-ask ratio below 96% indicates meaningful room for negotiation, and the steady downward trajectory suggests the trend hasn’t fully played out yet.
What this means for sellers: Price your home realistically from the start. The market is telling you that inflated asking prices result in longer time on market and steeper eventual price reductions. Buyers have options, and they’re using them.
What this means for buyers: You have more leverage than at any point in the past year. Don’t be afraid to make offers below asking. The data supports it, and well-prepared buyers are securing homes at significant discounts to list price.
The Big Picture: What’s Driving These Trends?
Several factors are converging to shape Nova Scotia’s current market dynamics, and the year-over-year comparison highlights how much has changed in just 12 months.
Interest rates have stabilized but remain elevated. The Bank of Canada held its overnight rate at 2.25% on January 28, 2026, marking the second consecutive hold. With the prime rate at 4.45%, borrowing costs are significantly lower than their 2023 peak but still well above the sub-1% levels that fuelled the 2020 to 2022 boom. Economists expect rates to remain on hold through much of 2026 unless tariff-related disruptions or inflation surprises force the Bank’s hand. The next rate announcement is March 18, 2026.
For buyers, the stability is actually helpful. It removes the urgency to lock in before rates change, and it means mortgage pre-approval amounts should hold steady for longer. Use our mortgage calculator to model different scenarios at today’s rates.
Population growth continues to support demand. Nova Scotia has seen sustained in-migration from other provinces and international arrivals, keeping upward pressure on prices even as transaction volumes dip seasonally. This is the primary reason prices haven’t corrected despite the cooling in other metrics. For a deeper look at how these forces have shaped the market since the pandemic, see our Five Years of Nova Scotia Real Estate Market Analysis (2021 to 2025).
Inventory levels are rising. NSAR reported that active residential listings reached 4,168 units at the end of November 2025, the highest level for that month in over five years and 27.4% above the five-year average. More inventory means more choice for buyers, less competition per listing, and downward pressure on sold-to-ask ratios. This is a structural shift, not just a seasonal blip.
Affordability programs are helping at the margins. Programs like Nova Scotia’s 2% Down Payment Program are helping first-time buyers bridge the gap, but with average prices now above $490K, affordability remains a real challenge for many Nova Scotians.
U.S. trade policy adds economic uncertainty. The Bank of Canada cited the upcoming CUSMA review and ongoing U.S. tariff pressures as key risks to growth. GDP is projected at just 1.1% for 2026. Any deterioration in trade relations could dampen consumer confidence and slow real estate activity further.
January 2026 vs. January 2025: At a Glance
| Metric | January 2025 | January 2026 | Change |
|---|---|---|---|
| Average Sale Price | $441,429 | $491,129 | +11.3% |
| Units Sold | 637 | 543 | -14.8% |
| Value of Solds | $281.2M | $266.7M | -5.2% |
| Avg. Days on Market | 56.1 | 64.4 | +14.8% |
| Sold-to-Ask Ratio | 97.4% | 95.3% | -2.1 pts |
| BoC Overnight Rate | 3.25% | 2.25% | -1.00% |
The numbers paint a clear picture: prices are climbing, but everything else points to a market that is gradually and meaningfully tilting in favour of buyers. Homes are taking nearly 15% longer to sell, sellers are accepting over two percentage points less than asking price compared to a year ago, unit sales have dropped by nearly 15%, and total dollar volume is down. Meanwhile, the 100-basis-point reduction in the Bank of Canada rate over the past year has improved affordability at the margins and stabilized borrowing costs, though not enough to offset the 11.3% rise in home values.
Looking Ahead: What to Expect in Spring 2026
If past years are any guide, activity should pick up through March and April as the spring market takes shape. Key indicators to watch include whether the sold-to-ask ratio stabilizes or continues to decline, whether DOM contracts as it did in 2025, and how pricing responds to the Bank of Canada’s next moves. The next rate announcement is March 18, followed by the April 29 Monetary Policy Report. For context on how the market was performing just two months ago, see our November 2025 market stats.
The wild card is trade policy. If U.S. tariff pressures escalate or the CUSMA renegotiation goes poorly, consumer confidence could weaken and the Bank of Canada may be forced to cut rates further. That would be a tailwind for real estate activity but could also signal broader economic trouble.
For now, the market is in a transitional phase. Prices are holding firm and even climbing, but the pace and competitiveness of the market have clearly shifted. It’s neither a buyer’s market nor a seller’s market in the traditional sense. It’s a market that rewards preparation, realistic pricing, and smart strategy on both sides. Whether you’re buying or selling, having the right strategy and the right Realtor matters more than ever.
Need Expert Guidance in Nova Scotia Real Estate?
📞 Contact us 🌐 optimumrealty.c21.ca
Related Resources
- Nova Scotia’s 2% Down Payment Program
- Five Years of Nova Scotia Real Estate Market Analysis (2021 to 2025)
- Nova Scotia Real Estate Market Statistics 2025: A Year of Transition
- Nova Scotia Real Estate Stats for November 2025
- Get Pre-Approved for a Mortgage
- What’s My Home Worth?
- Buying & Selling Tips
- Use Our Mortgage Calculator
- Search All Nova Scotia Listings

