Facebook
 X
X
 Pinterest
 Copy Link
-
From Slow Starts to Bidding Wars: Ten Years of Nova Scotia Real Estate in Five Key Charts
By Rob Lough, Broker/Owner – Century 21 Optimum Realty
Published February 2026 | Updated monthlyA decade of Nova Scotia real estate can be summed up in five telling graphs: days on market, average price, units sold, sold-to-ask ratio, and total dollar volume. Together, they show how our province moved from sleepy listing times and modest prices to a pandemic-fuelled frenzy—and now into a higher-priced but more balanced market.
Whether you’re a first-time buyer trying to time the market, a homeowner curious about your equity, or an investor eyeing long-term returns, these five charts tell the story you need to understand before making your next move.
For an even deeper dive, this article pairs perfectly with our long-form breakdown in Nova Scotia Housing Market 2025: A Comprehensive Analysis of Home Prices and Trends.
The 2017 Baseline: A Slower, More Affordable Market

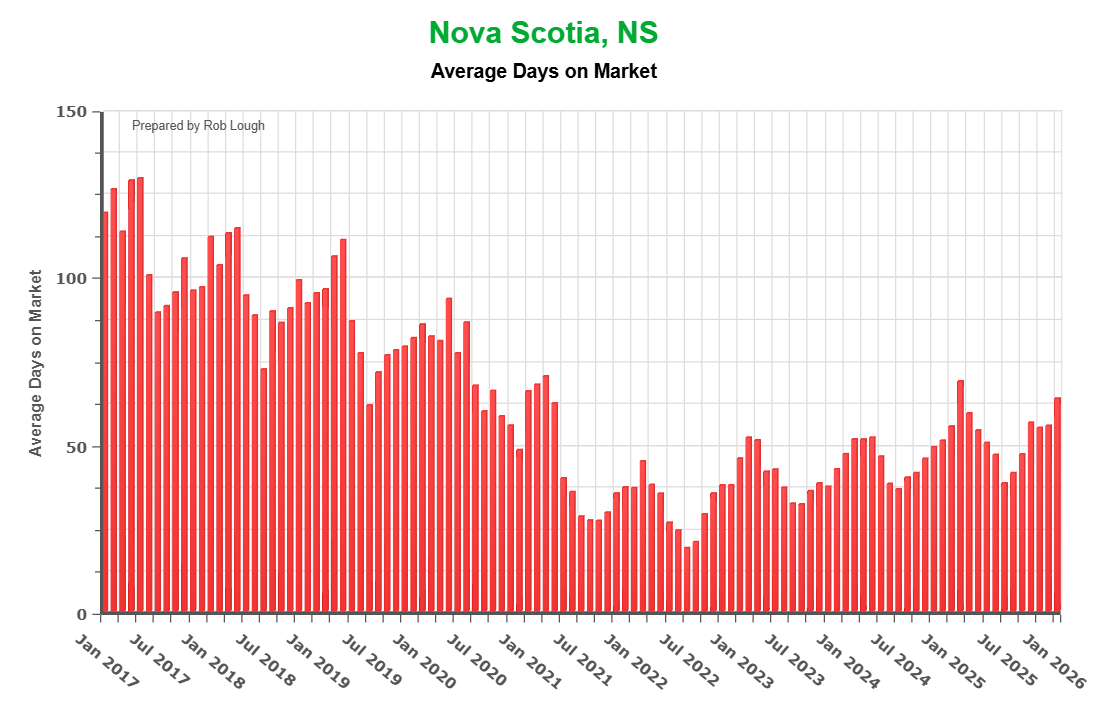
Average Days on Market Ten Years of Nova Scotia Real Estate
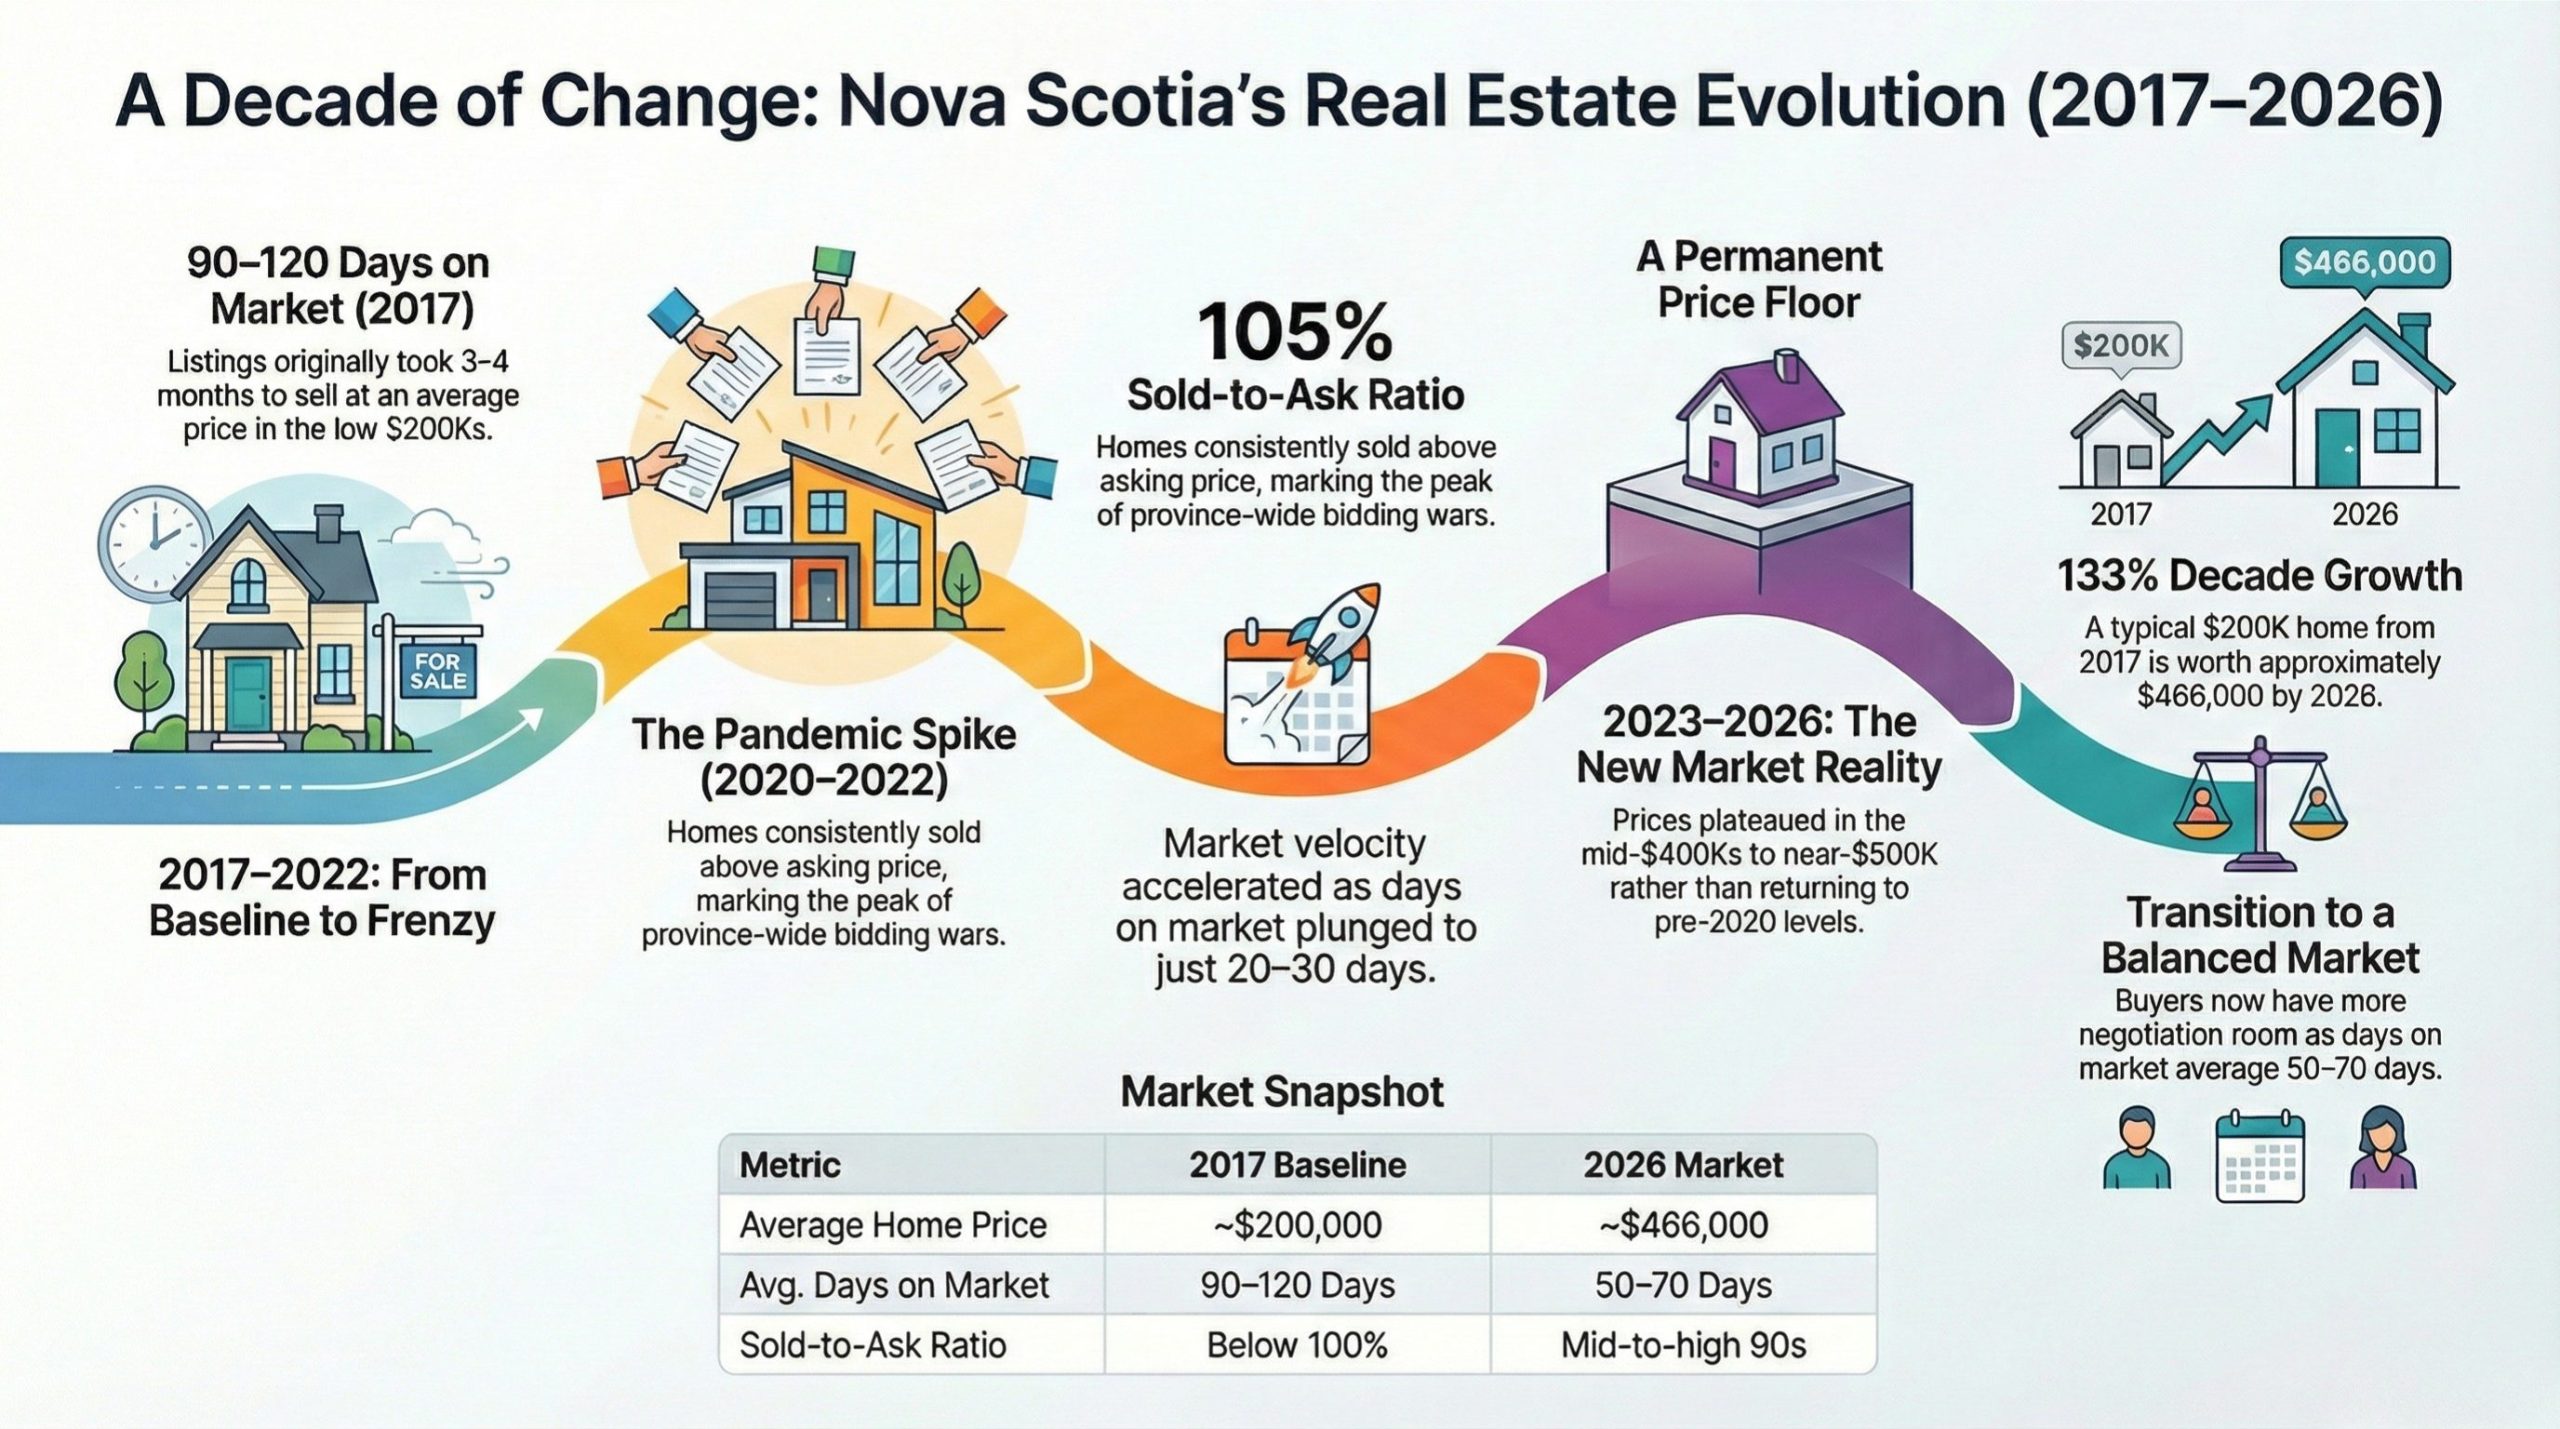
Back in 2017, the Average Days on Market chart shows that typical Nova Scotia listings sat 90–120 days before finding a buyer. That’s three to four months of showings, price adjustments, and waiting—a far cry from today’s pace.
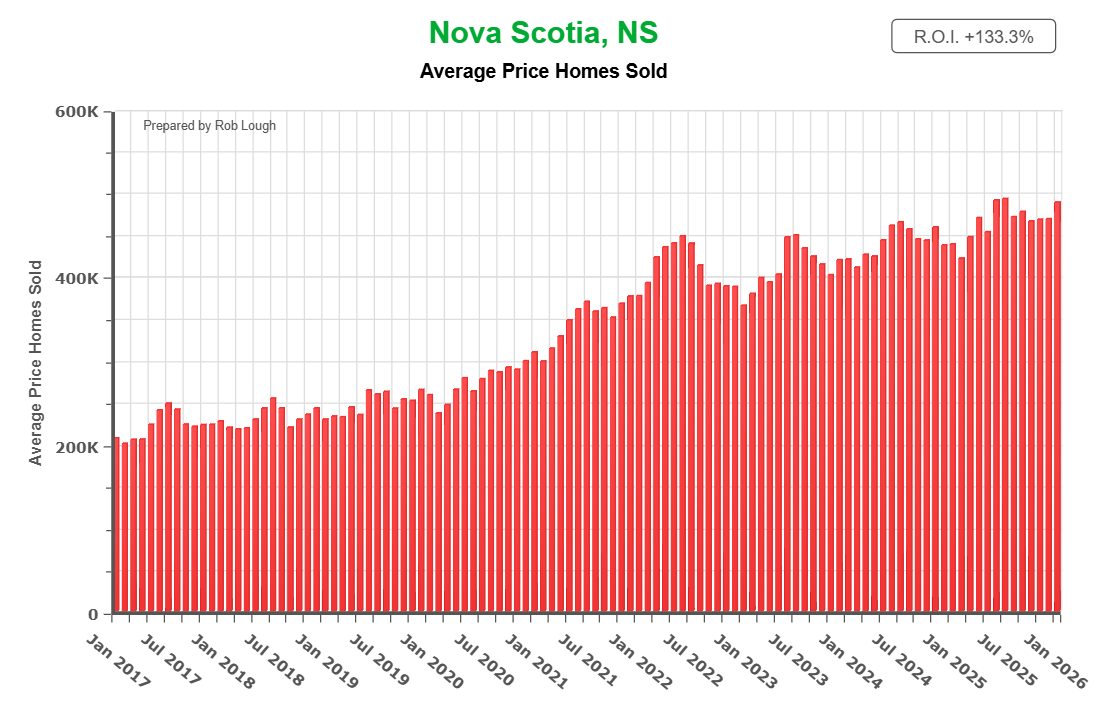
Average Price Homes Sold Ten Years of Nova Scotia Real Estate
Pair that with the Average Price chart, which shows values hovering in the low $200,000s, and you get the picture of a market where buyers could take their time, negotiate freely, and enter homeownership at a relatively low price point.
This period lines up with the early years covered in our Five Years of Nova Scotia Real Estate Market Analysis, where we trace the market’s shift from those modest early-2010s values into today’s elevated price range. For many Nova Scotians, 2017 still feels like “normal”—but the graphs make clear it was the start of a major uptrend, not the middle of one.
2020–2022: Two Charts Capture the Pandemic Frenzy
The real drama begins when you look at 2020–2022 across three graphs at once.
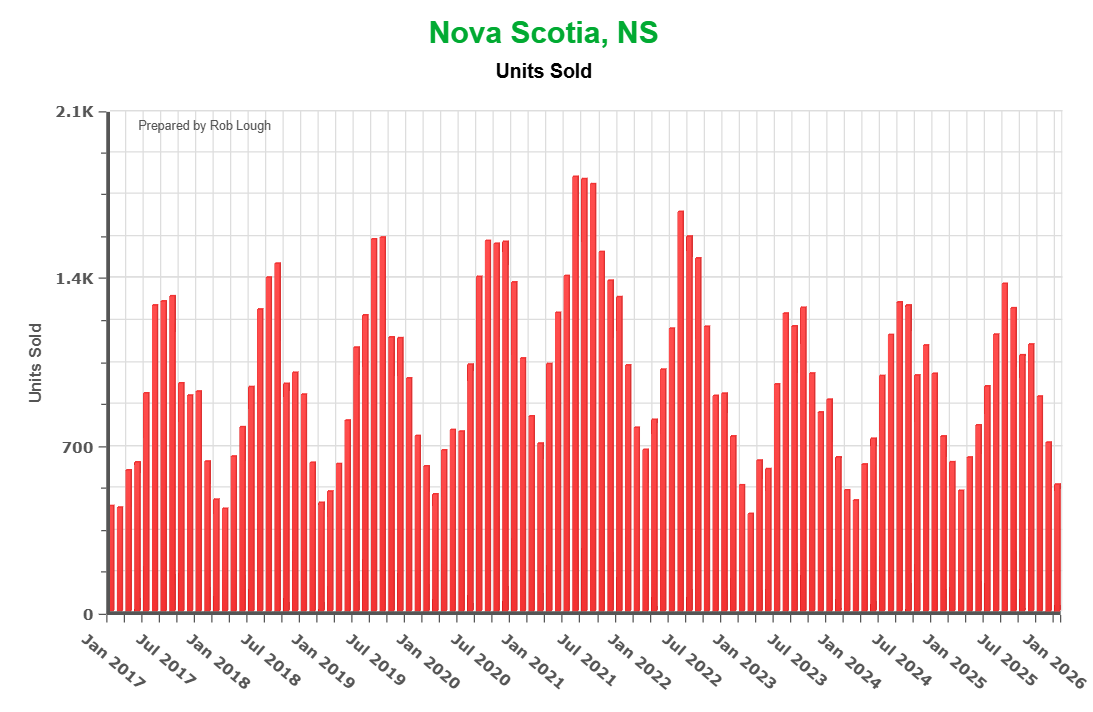
Number of Homes Sold Ten Years of Nova Scotia Real Estate
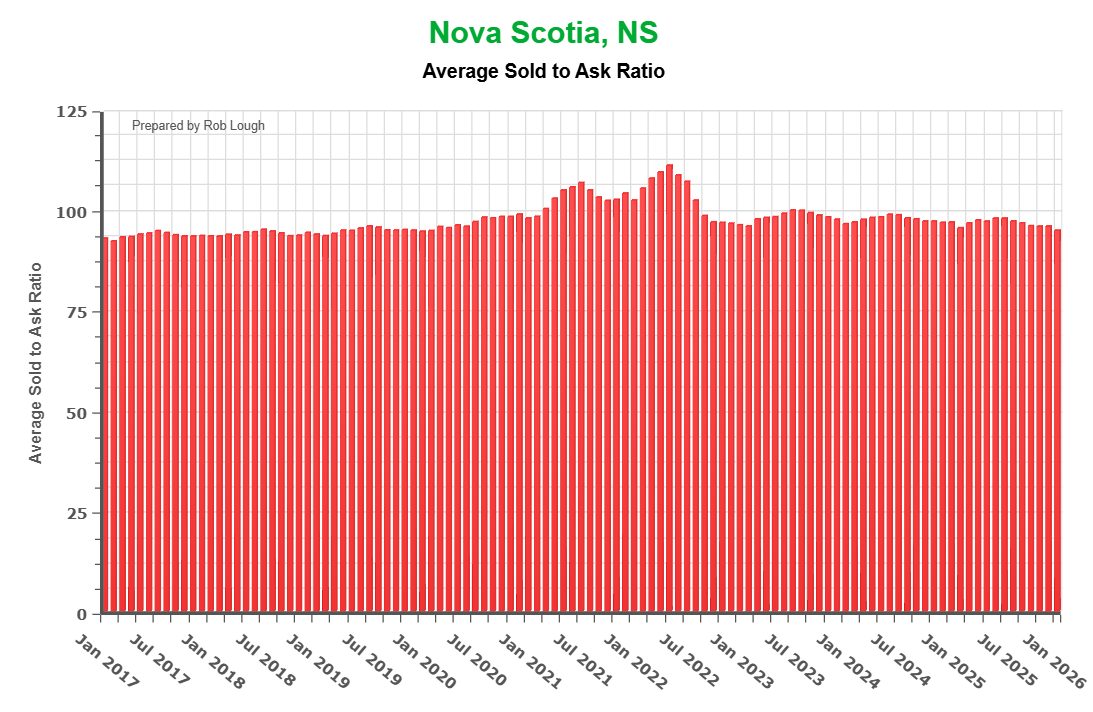
Sold to Ask Ratio Ten Years of Nova Scotia Real Estate
Days on market plunges into the 20–30-day range. Units sold spike to seasonal highs nearing 1,700–1,800 transactions per month. And the sold-to-ask ratio soars above 105 percent—meaning homes were consistently selling above their listed price. That’s the statistical fingerprint of province-wide bidding wars.
Meanwhile, the average price chart shows values accelerating from the mid-$200Ks into the $400K–$450K band over just a few years. Prices rose more than 50 percent from 2021 to 2025 alone.
What this meant for buyers: Multiple-offer situations became the norm. Conditional offers were routinely rejected. Buyers who hesitated lost out. It was the most competitive stretch in Nova Scotia’s modern real estate history.
What this meant for sellers: If you listed during 2021–2022, you likely sold fast, above asking price, and with minimal conditions. It was a window of extraordinary leverage.
The Value of Solds Chart: When Volume and Price Peak Together
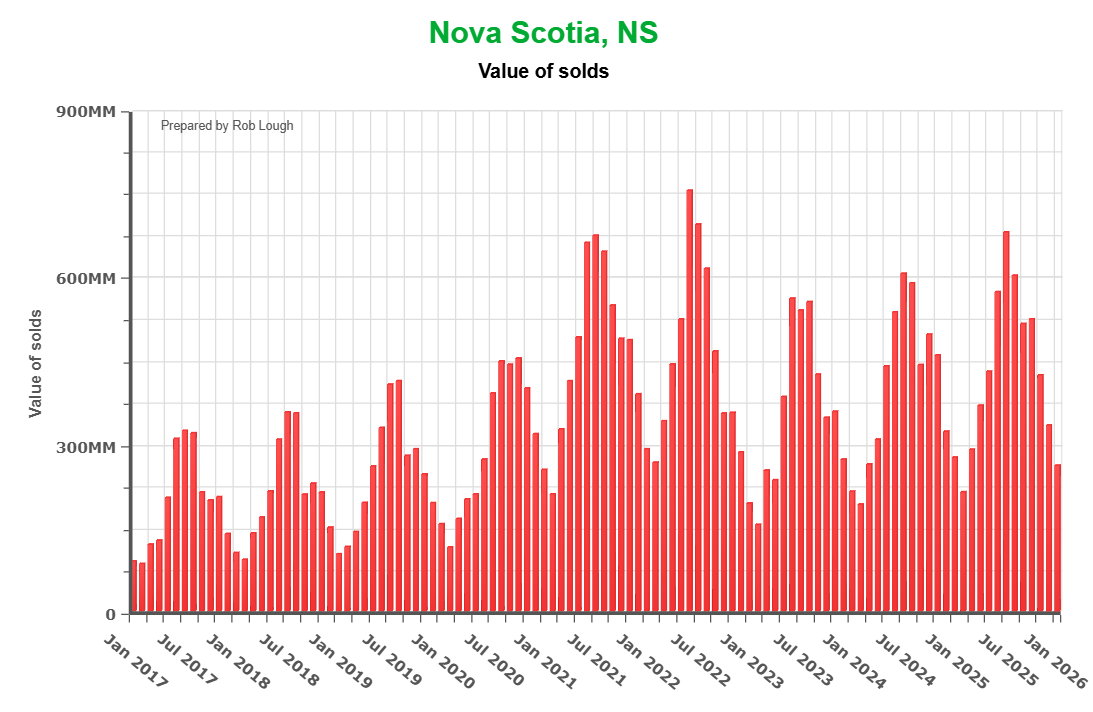
Value of Sold Homes Ten Years of Nova Scotia Real Estate
The Value of Solds graph is where everything converges. High prices combined with high transaction counts pushed total dollar volume to record levels in 2021–2022, with monthly peaks reaching the $600M–$800M range.
That means not only were more homes changing hands—they were selling for significantly more money. It’s why those years felt so intense for everyone involved: buyers, sellers, lenders, and agents alike.
In our article Canadian Real Estate 2025: Why Nova Scotia’s Housing Market Outshines Major Cities, we compare this surge to performance in larger urban centres across the country—and Nova Scotia more than holds its own.
2023–2025: A Cooldown in Activity, But Not in Prices
From 2023 onward, the Days on Market graph shows a steady climb back into the 50–70-day range. The Units Sold chart reveals lower seasonal peaks than during the pandemic boom. And the Sold-to-Ask Ratio slips under 100 percent, signalling fewer bidding wars and slightly more room for negotiation.
Yet the Average Price chart tells a different story. Prices plateau in the mid-$400Ks to near-$500K range rather than rolling back to pre-2020 levels, with 2025 averages often between roughly $440,000 and $500,000. The floor has shifted permanently upward.
This matches the conclusions in our Nova Scotia Real Estate Market Statistics 2025: A Year of Transition, where we highlight that 2025 prices finished the year above January levels despite softer transaction activity.
What this means for buyers: You have more time and leverage than you did during the peak. Longer days on market and sold-to-ask ratios in the mid-to-high 90s give you room to negotiate conditions and price. But entry prices remain significantly higher than pre-pandemic levels.
What this means for sellers: You’re no longer in the “name your price” era of 2021–2022, but the combination of elevated prices and healthy demand still makes this a favourable environment—especially if you’re trading up or relocating out of province.
A Real-World Example: 2017 Buyer vs. 2026 Value
Using the Average Price graph and our own long-term analysis, Nova Scotia’s typical home price has climbed roughly 133 percent over the decade.
If someone bought a $200,000 home in 2017 and their property tracked the provincial average, today it would be worth approximately $466,000. That’s about $266,000 in price-driven equity alone—before factoring in mortgage pay-down or renovations.
For a more focused five-year view, our Five Years of Nova Scotia Real Estate Market Analysis shows that a buyer at the start of 2021 has already seen roughly a 50 percent-plus return by the end of 2025. Long-term homeownership in this province has been one of the most reliable wealth-building strategies available.
What the Graphs Mean for You in 2026
Looking across all five graphs, the message is clear: Nova Scotia’s real estate market has matured, but it hasn’t stalled.
For sellers: Elevated prices and sold-to-ask ratios in the mid-to-high 90s still make this a favourable environment. Pricing right and presenting well remain key—the days of under-listing and expecting a bidding war to close the gap are behind us, but well-prepared listings are still rewarded.
For buyers: Higher entry prices are the new reality, but longer days on market and sub-100 percent sold-to-ask ratios give you more time and negotiating leverage than any point since 2019. Consider exploring programs like Nova Scotia’s Down Payment Assistance Program and the First Home Savings Account (FHSA) to reduce your upfront costs.
For investors: The price and dollar-volume charts show that long-term ownership has been highly rewarding. Combined with Nova Scotia’s ongoing population growth and development trends—covered in pieces like Halifax Real Estate Market Insights: 4 Surprises and Halifax & Bedford Housing Boom—the fundamentals remain strong for buy-and-hold strategies.
Quick Reference: What Each Chart Tells You
-
Days on Market: How fast homes are selling. Lower numbers mean a hotter market and less time to make decisions.
-
Average Price: The wealth-building metric. Tracks how much home values have grown over the decade.
-
Units Sold: Overall market activity. Higher counts signal strong demand and confidence.
-
Sold-to-Ask Ratio: Negotiating power. Above 100 percent means sellers have the edge; below means buyers have room to negotiate.
-
Value of Solds: Total market size. When volume and prices peak together, it reflects a market running at full capacity.
Related Resources
-
Uncategorized •
13 February 2026
Ten Years of Nova Scotia Real Estate in Five Key Charts