
 Facebook
 X
X
 Pinterest
 Copy Link
Nova Scotia Real Estate Market Statistics August 2026
By Rob Lough, Broker/Owner | Century 21 Optimum Realty | September 1, 2026
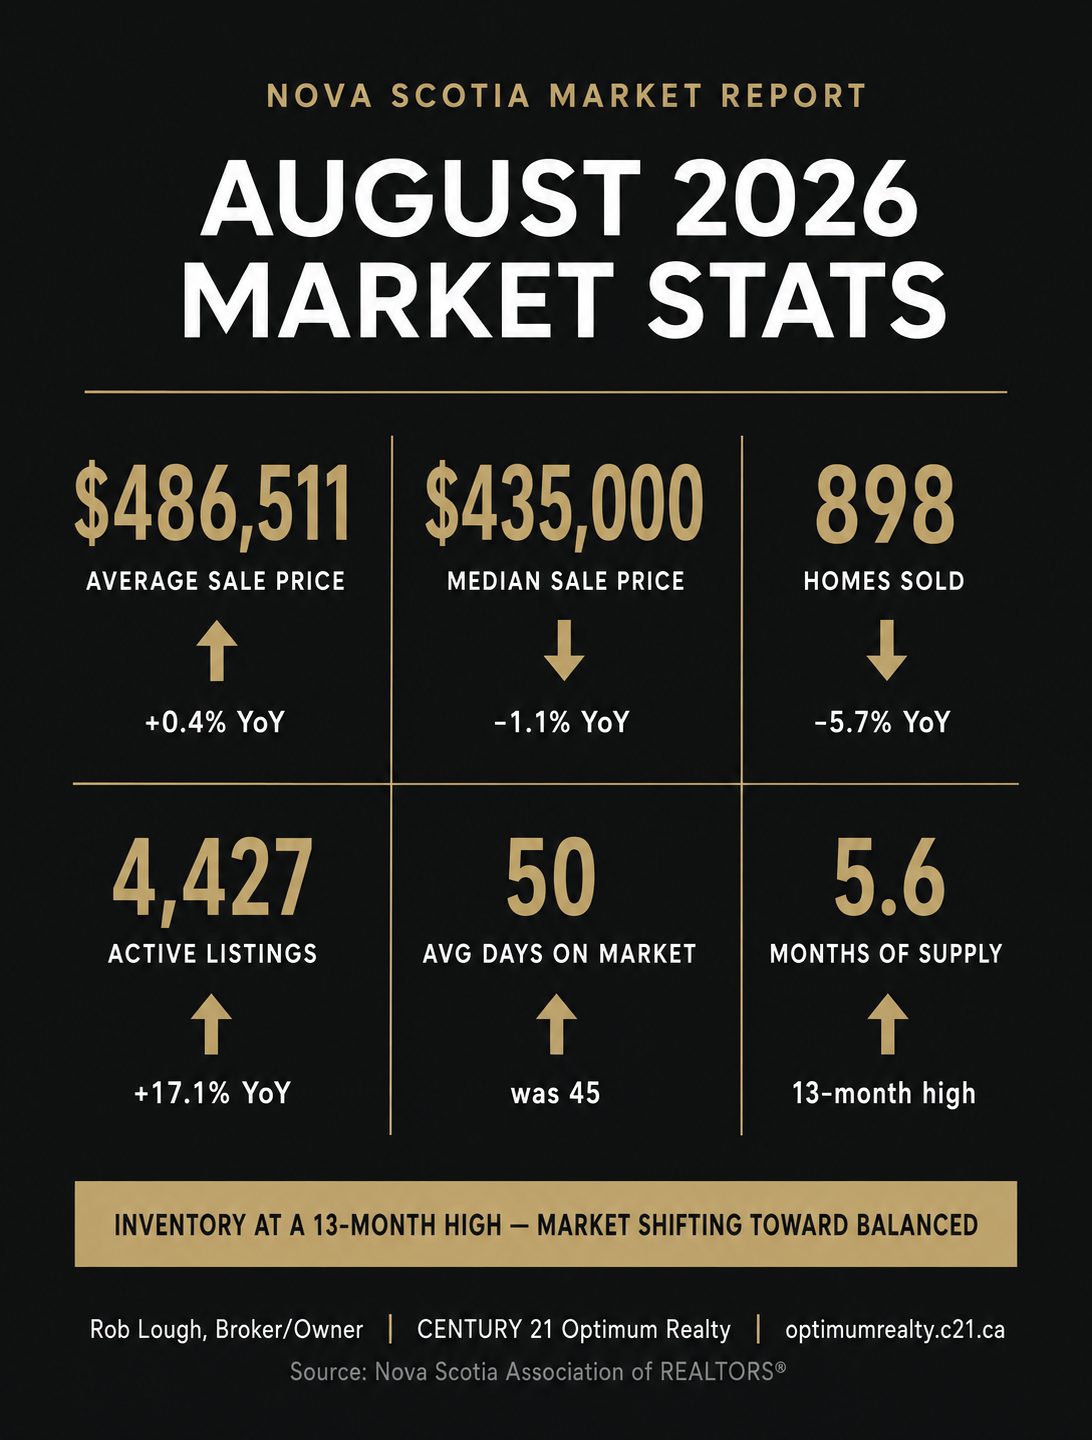
Nova Scotia’s housing market ended the summer with the deepest pool of inventory in more than a year and a clear cooling in buyer urgency. Active listings climbed to 4,427 homes, months supply reached 5.6, and both sales and dollar volume eased from July. Prices, however, have not broken down: the average sales price actually ticked up from July and sits essentially flat against August 2025.
Here is what the numbers from the Nova Scotia Association of REALTORS® show for August 2026.
Months Supply Climbs to 5.6 Months, a 13-Month High
Nova Scotia Real Estate Market Statistics August 2026 months supply of homes for sale
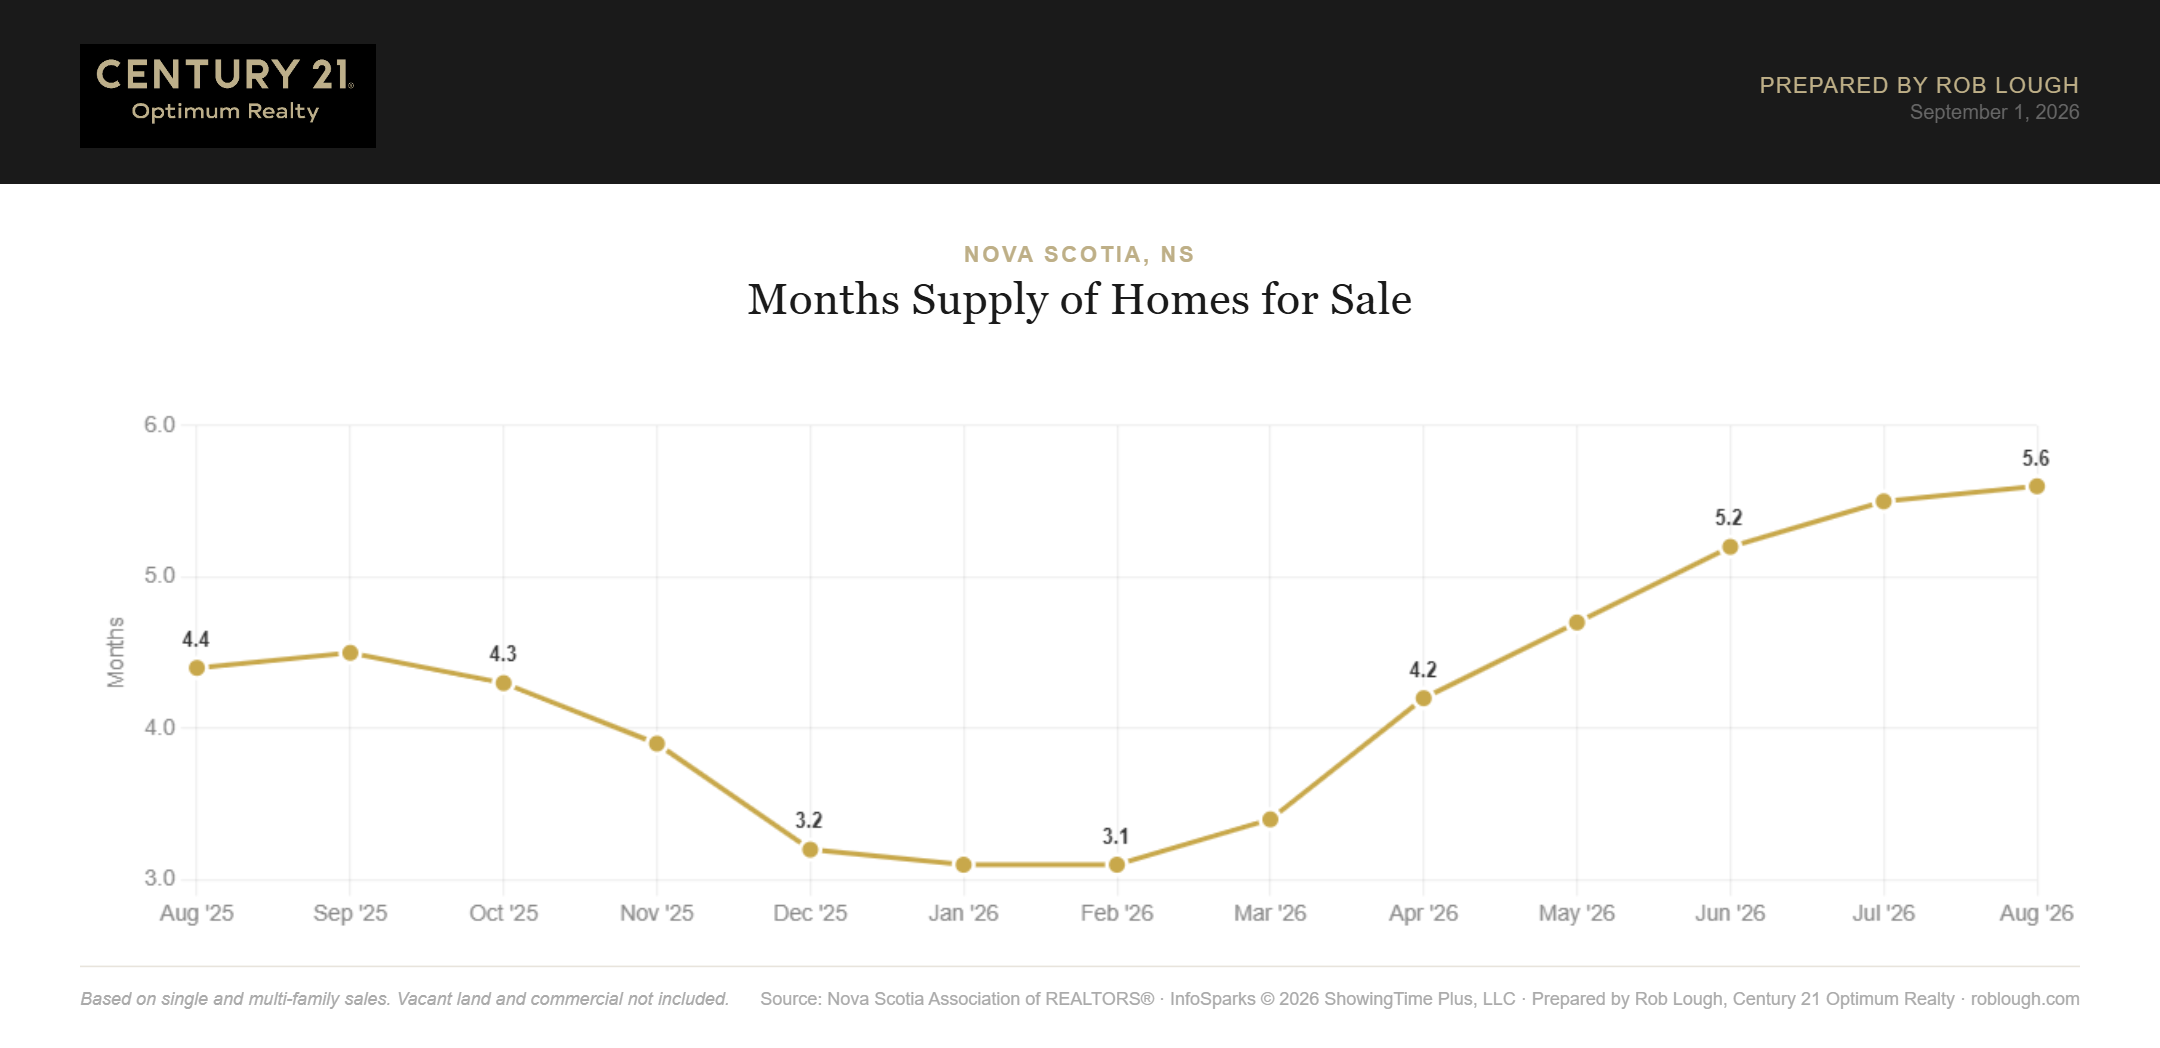
Months supply rose again in August to 5.6 months, up from 5.5 in July and well above the 4.4 months recorded in August 2025. That is the highest reading in the trailing 13 months and continues a steady climb from January’s tight 3.1 months.
Six months of supply is the conventional dividing line between a seller’s market and a balanced one. Nova Scotia is now within a rounding error of it. For the province as a whole, the pressure that defined the past several years has largely dissipated.
Inventory Reaches 4,427 Homes
Nova Scotia Real Estate Market Statistics August 2026 number of homes for sale
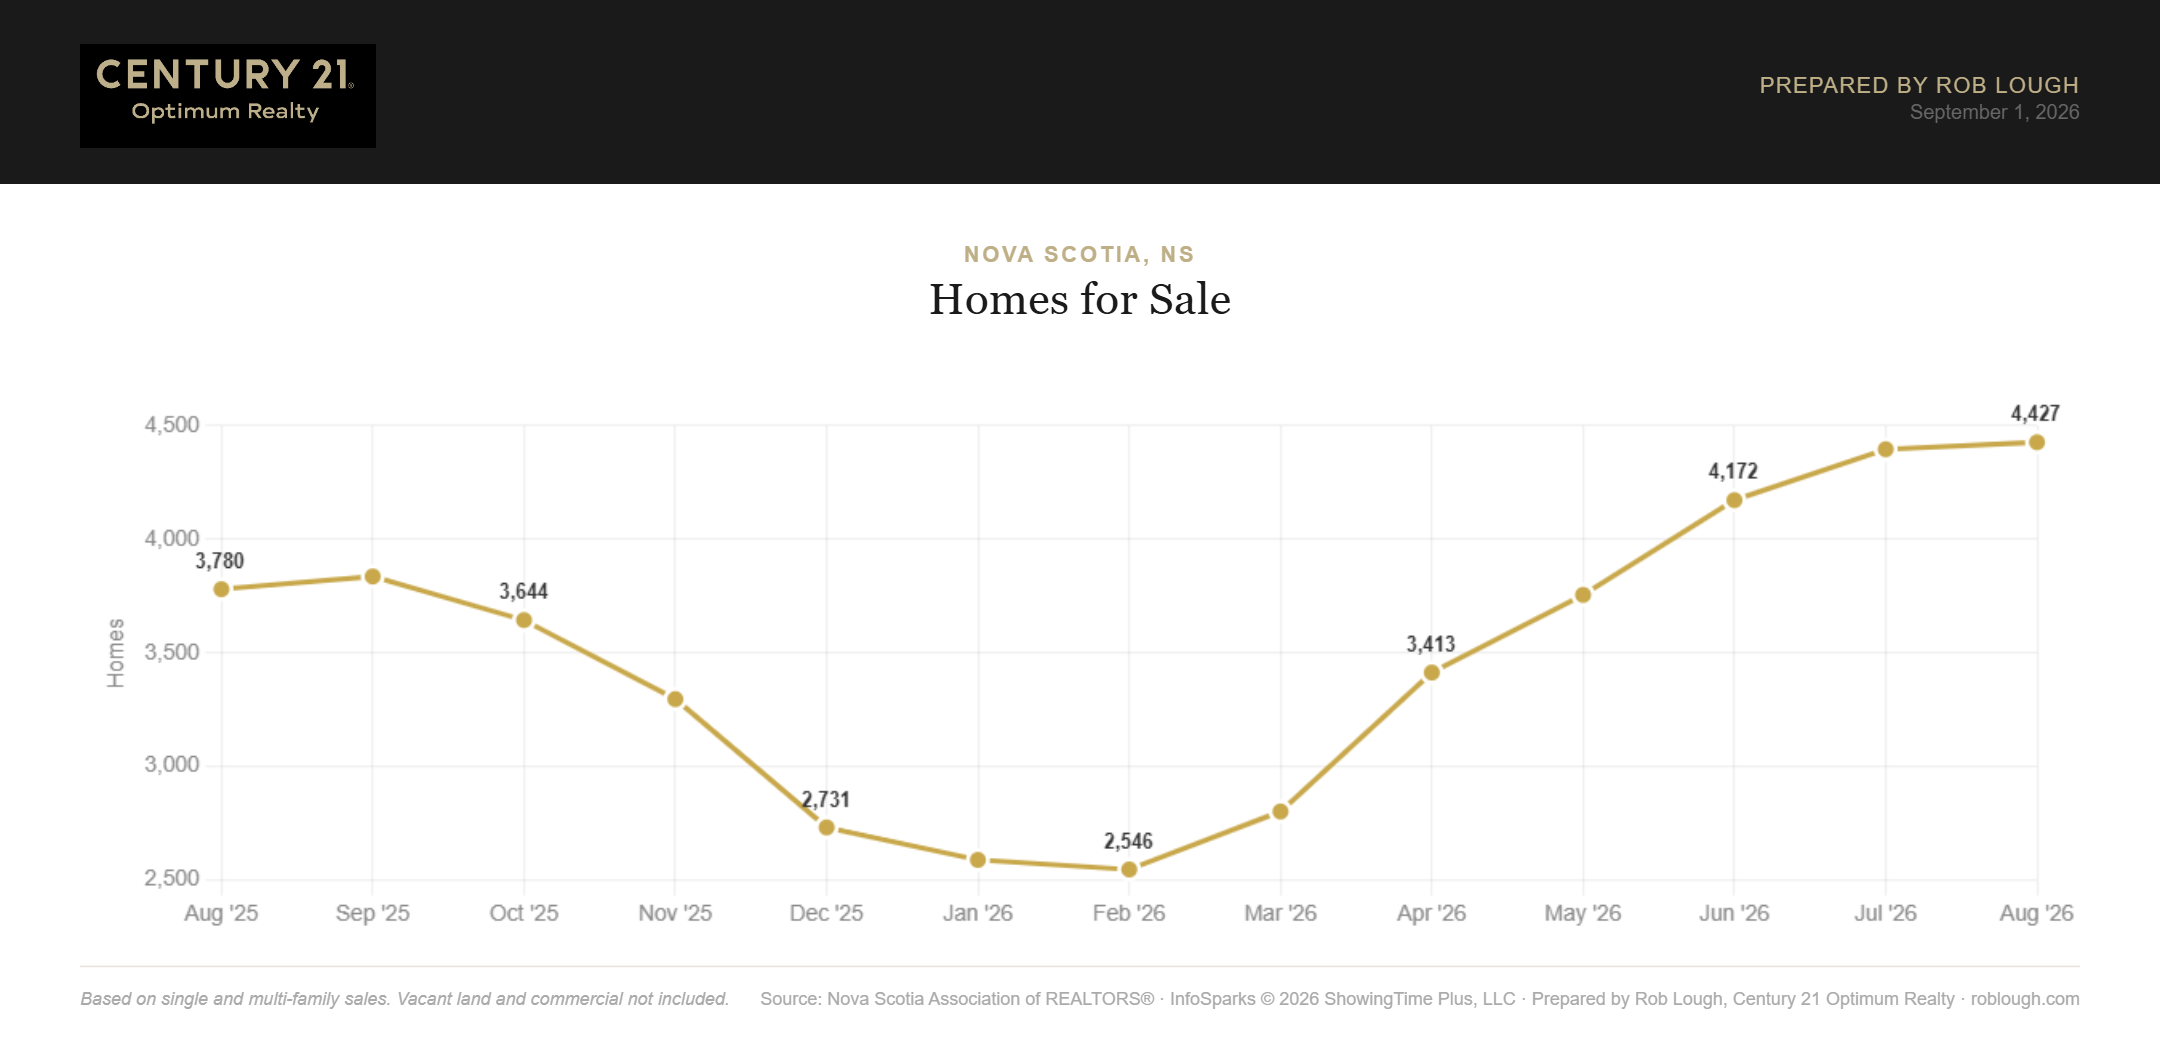
Homes for sale finished August at 4,427, up modestly from 4,396 in July and up 17.1 per cent from the 3,780 available in August 2025. Inventory has now risen in eight of the past nine months.
The build is coming from accumulation rather than a listing surge. Sellers who came to market in the spring and did not sell are still on the board, and each month adds to the standing count.
New Listings Ease to 1,385
Nova Scotia Real Estate Market Statistics August 2026 number of new listings
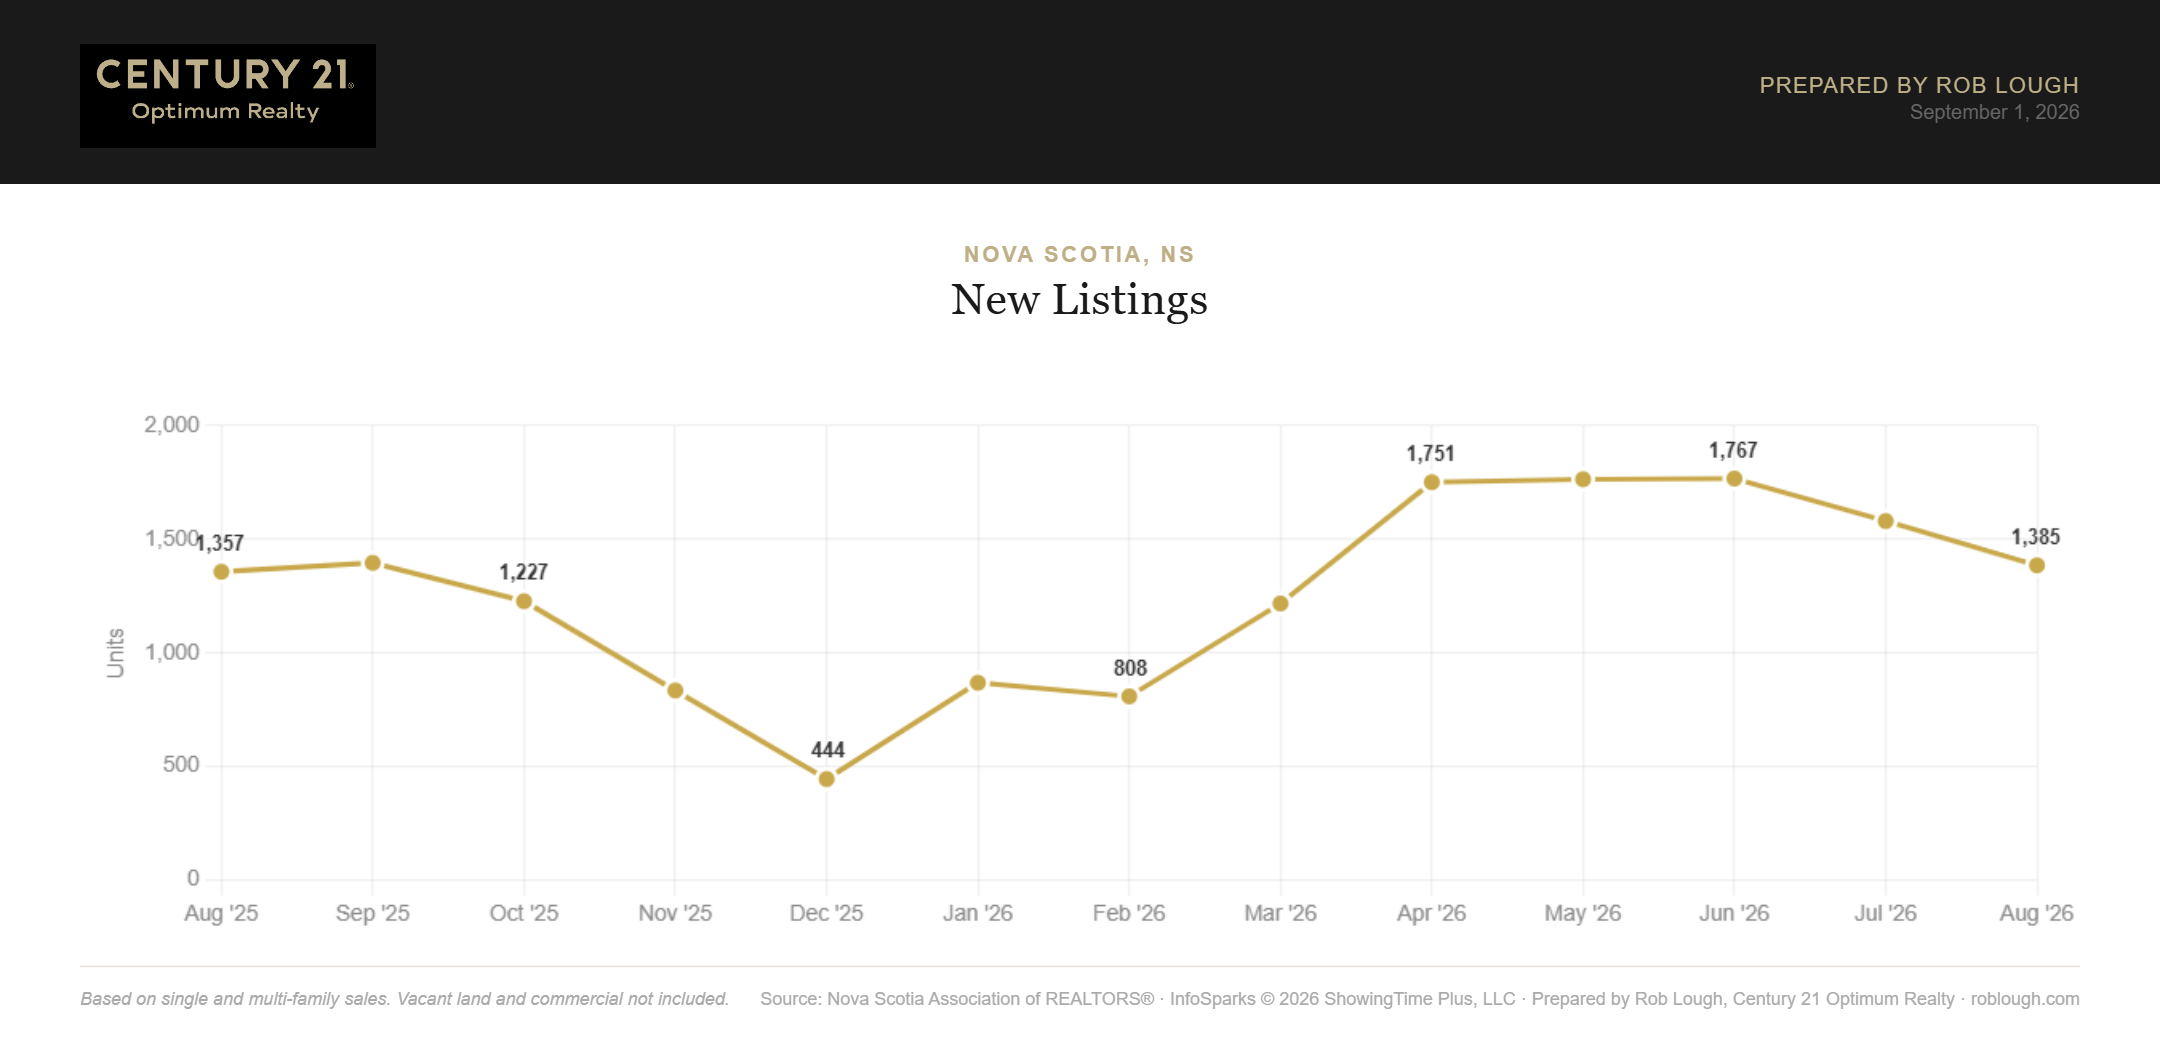
New listings totalled 1,385 in August, down from 1,580 in July and down sharply from the spring peak of 1,767 in June. Against August 2025’s 1,357, new supply is up just 2.1 per cent.
That is a normal seasonal fade. What makes this August different is that the fade in new listings has not drawn inventory down, because absorption has slowed at the same time.
Prices Hold: Average Up, Median Down
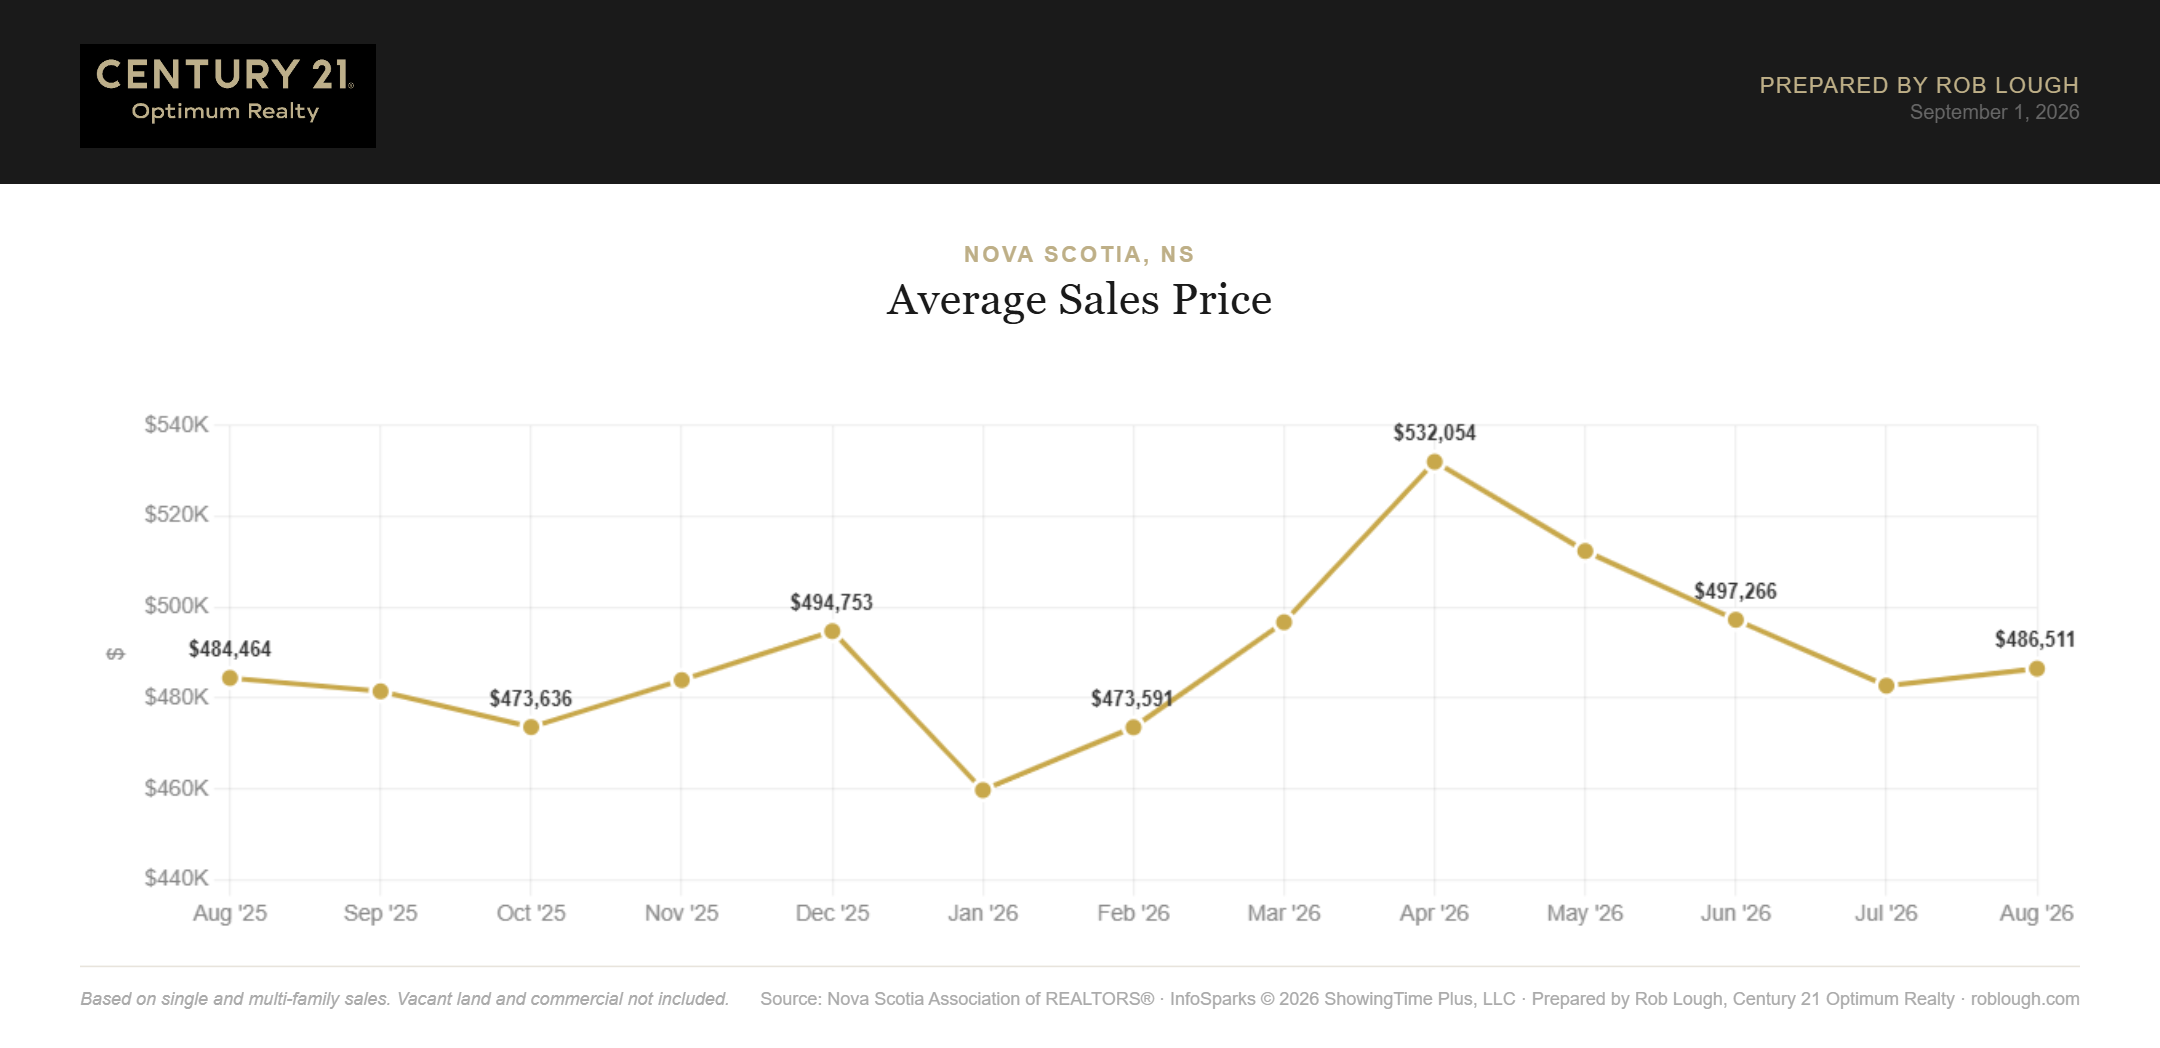
Nova Scotia Real Estate Market Statistics August 2026 average sales price
The average sales price was $486,511 in August, up from $482,750 in July and up 0.4 per cent from $484,464 a year earlier.
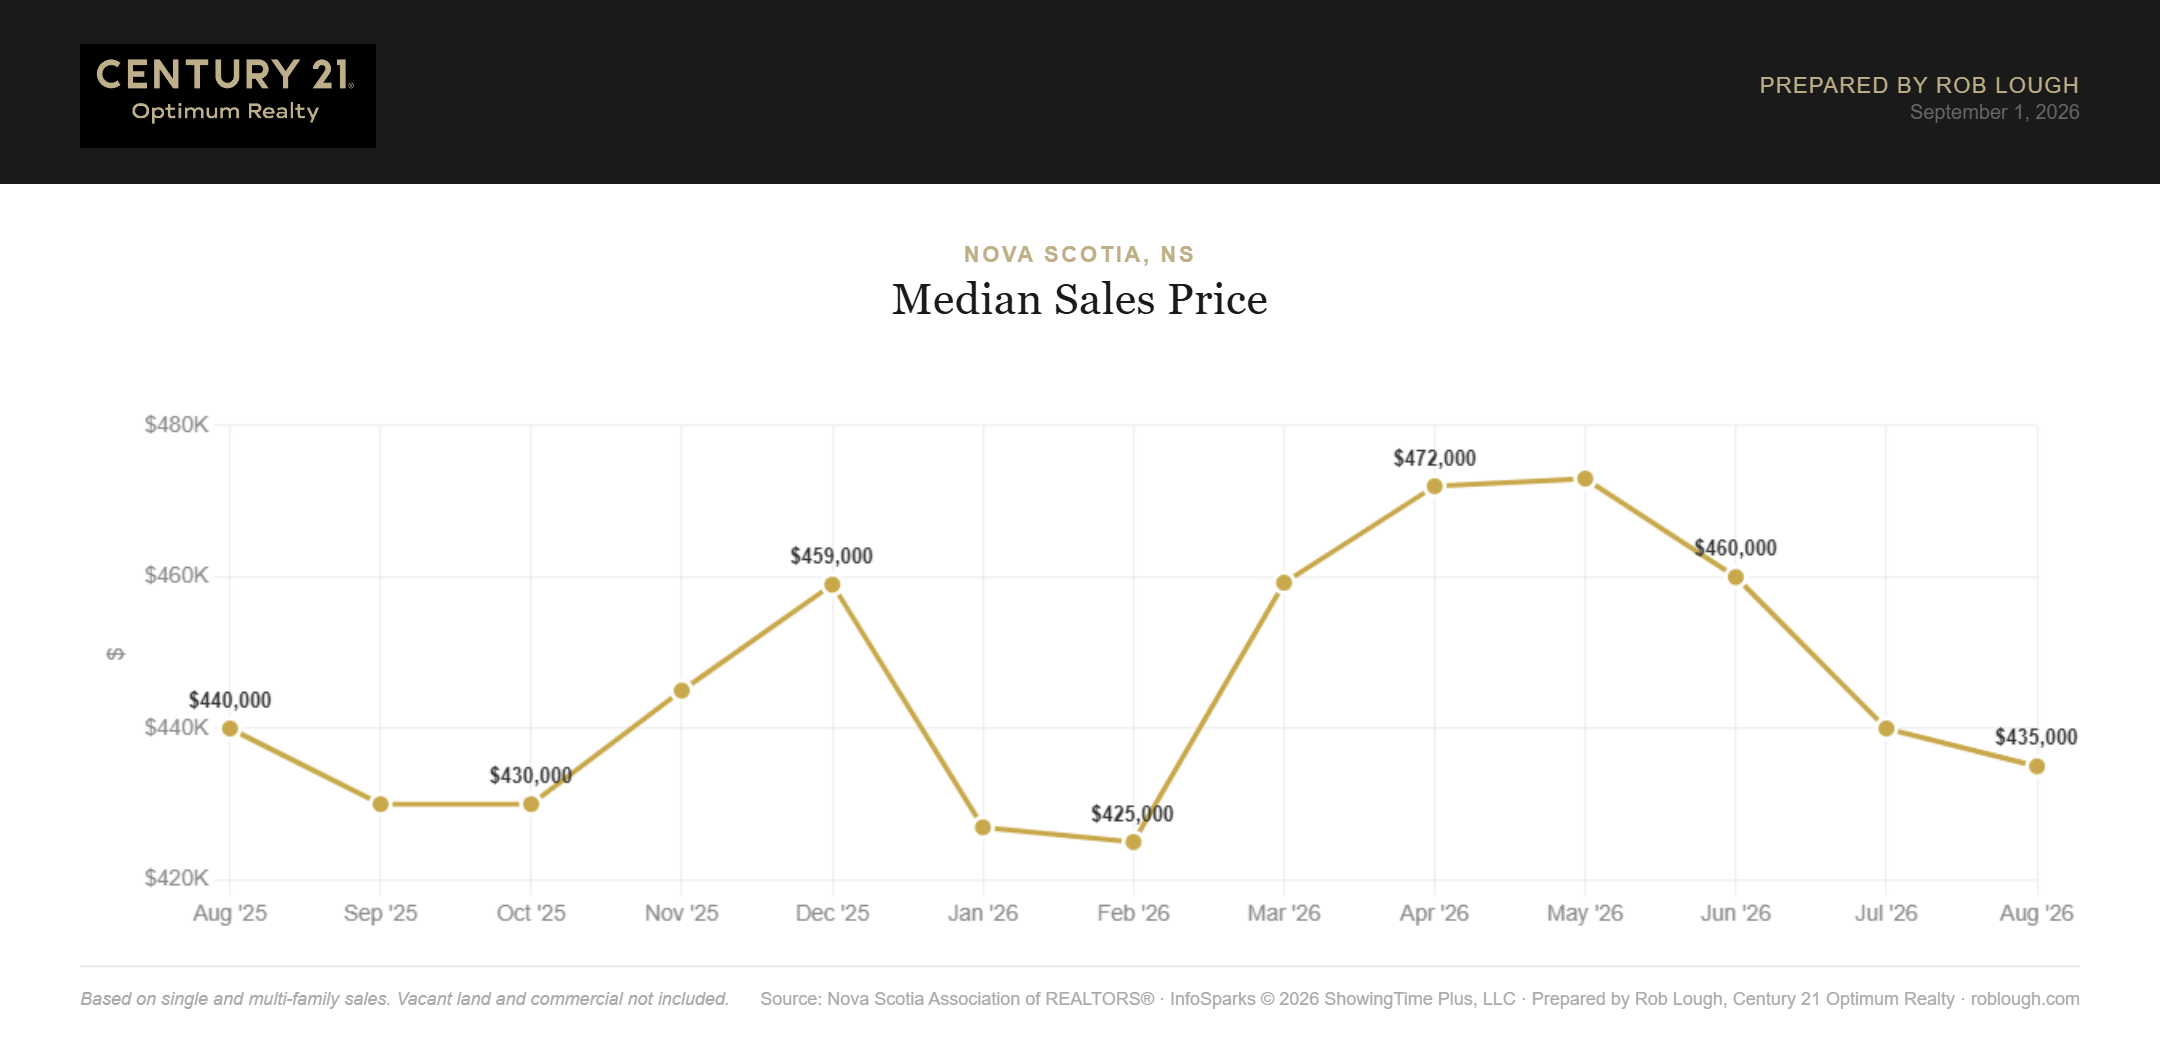
Nova Scotia Real Estate Market Statistics August 2026 median sales price
The median sales price told a softer story at $435,000, down from $440,000 in July and down 1.1 per cent year over year. When the average rises while the median falls, activity has shifted toward the upper end of the market and away from entry-level product. That is exactly what you would expect when first-time buyers pull back and move-up buyers keep transacting.
Price Per Square Foot Essentially Flat
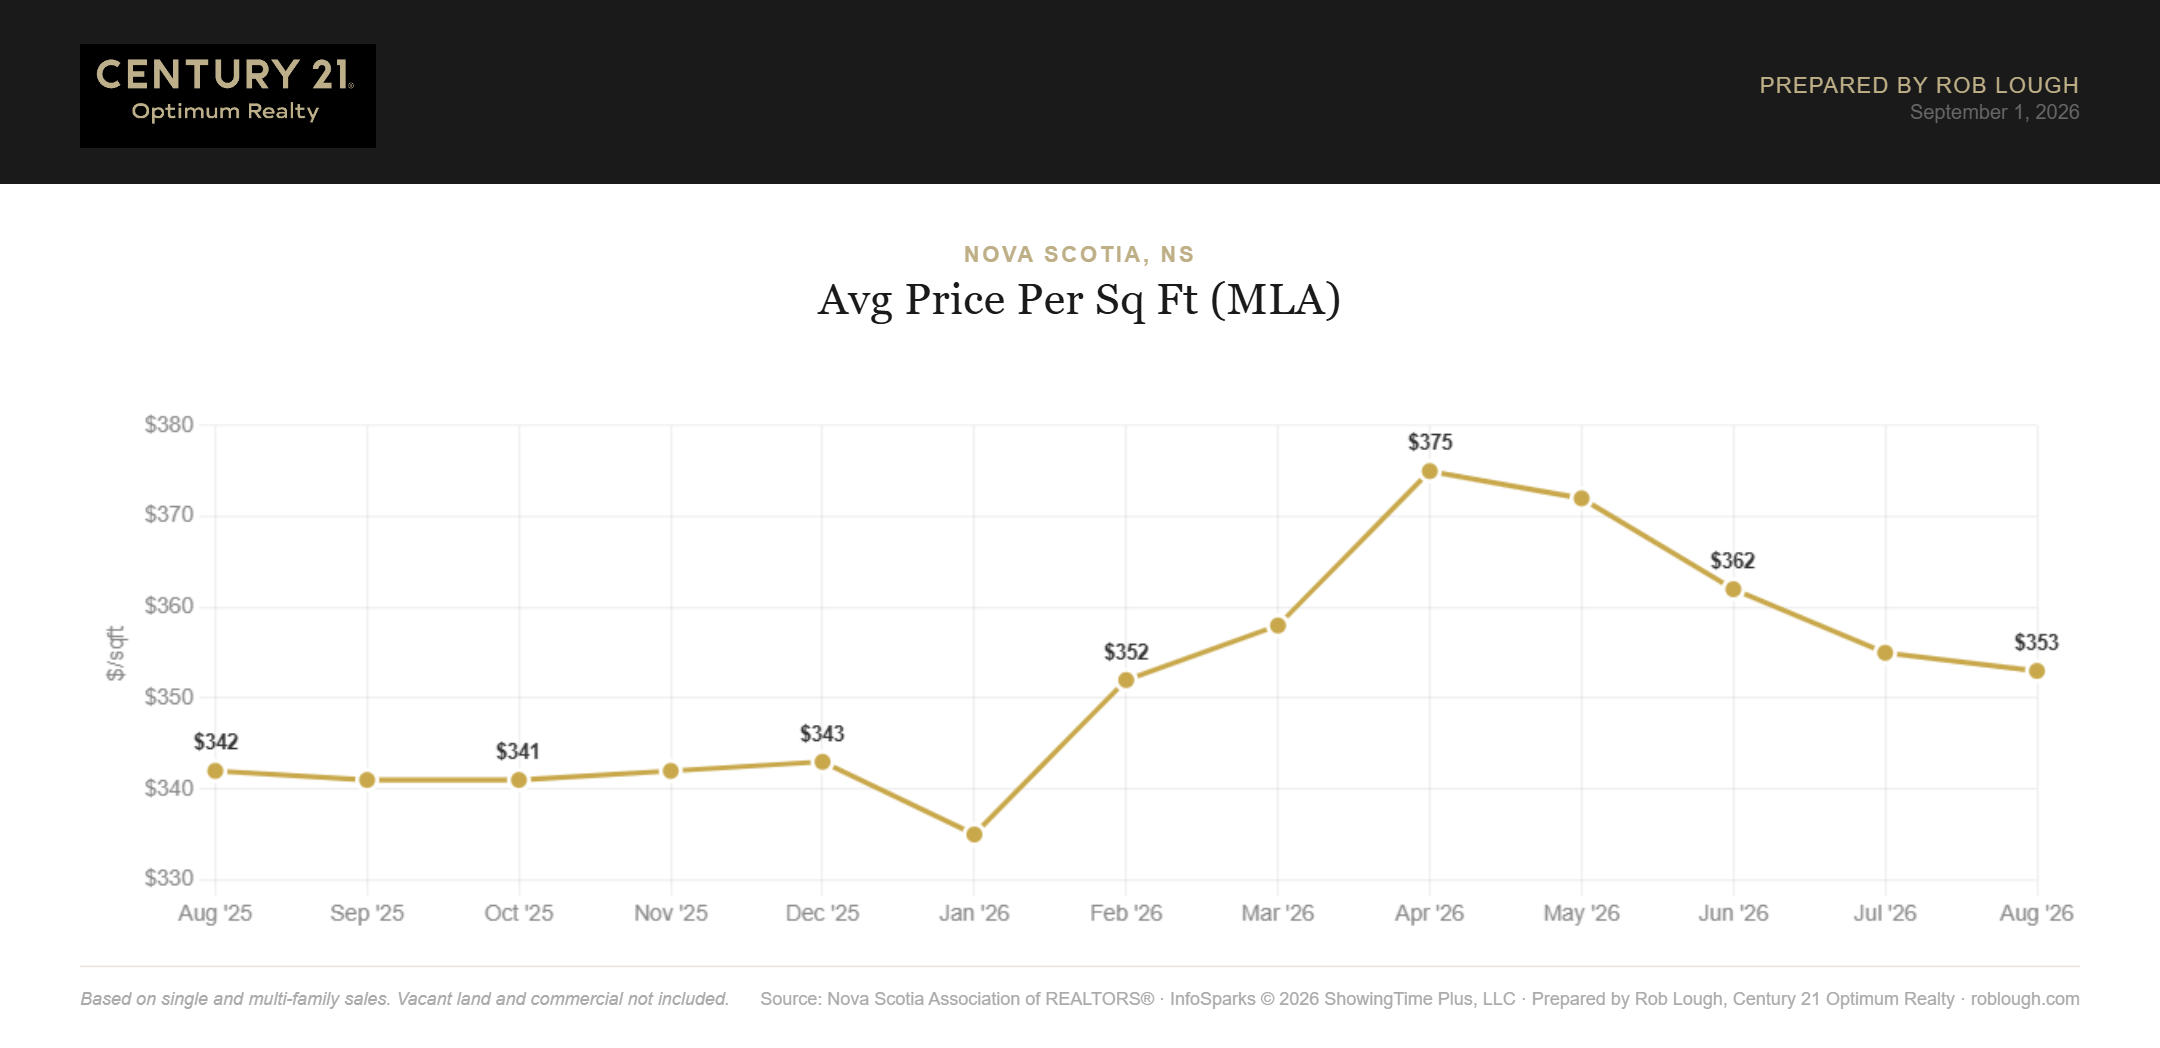
Nova Scotia Real Estate Market Statistics August 2026 average price per square foot MLA
Average price per square foot on total living area was $279 in August, down $1 from July but up 4.9 per cent from $266 a year ago. On main living area, the figure was $353, versus $355 in July and $342 in August 2025.
Per-square-foot pricing is the cleanest read on underlying value because it strips out changes in the size and mix of what sold. On that basis, Nova Scotia values are still ahead of last year despite the flat headline prices.
Dollar Volume Comes In at $435.9M
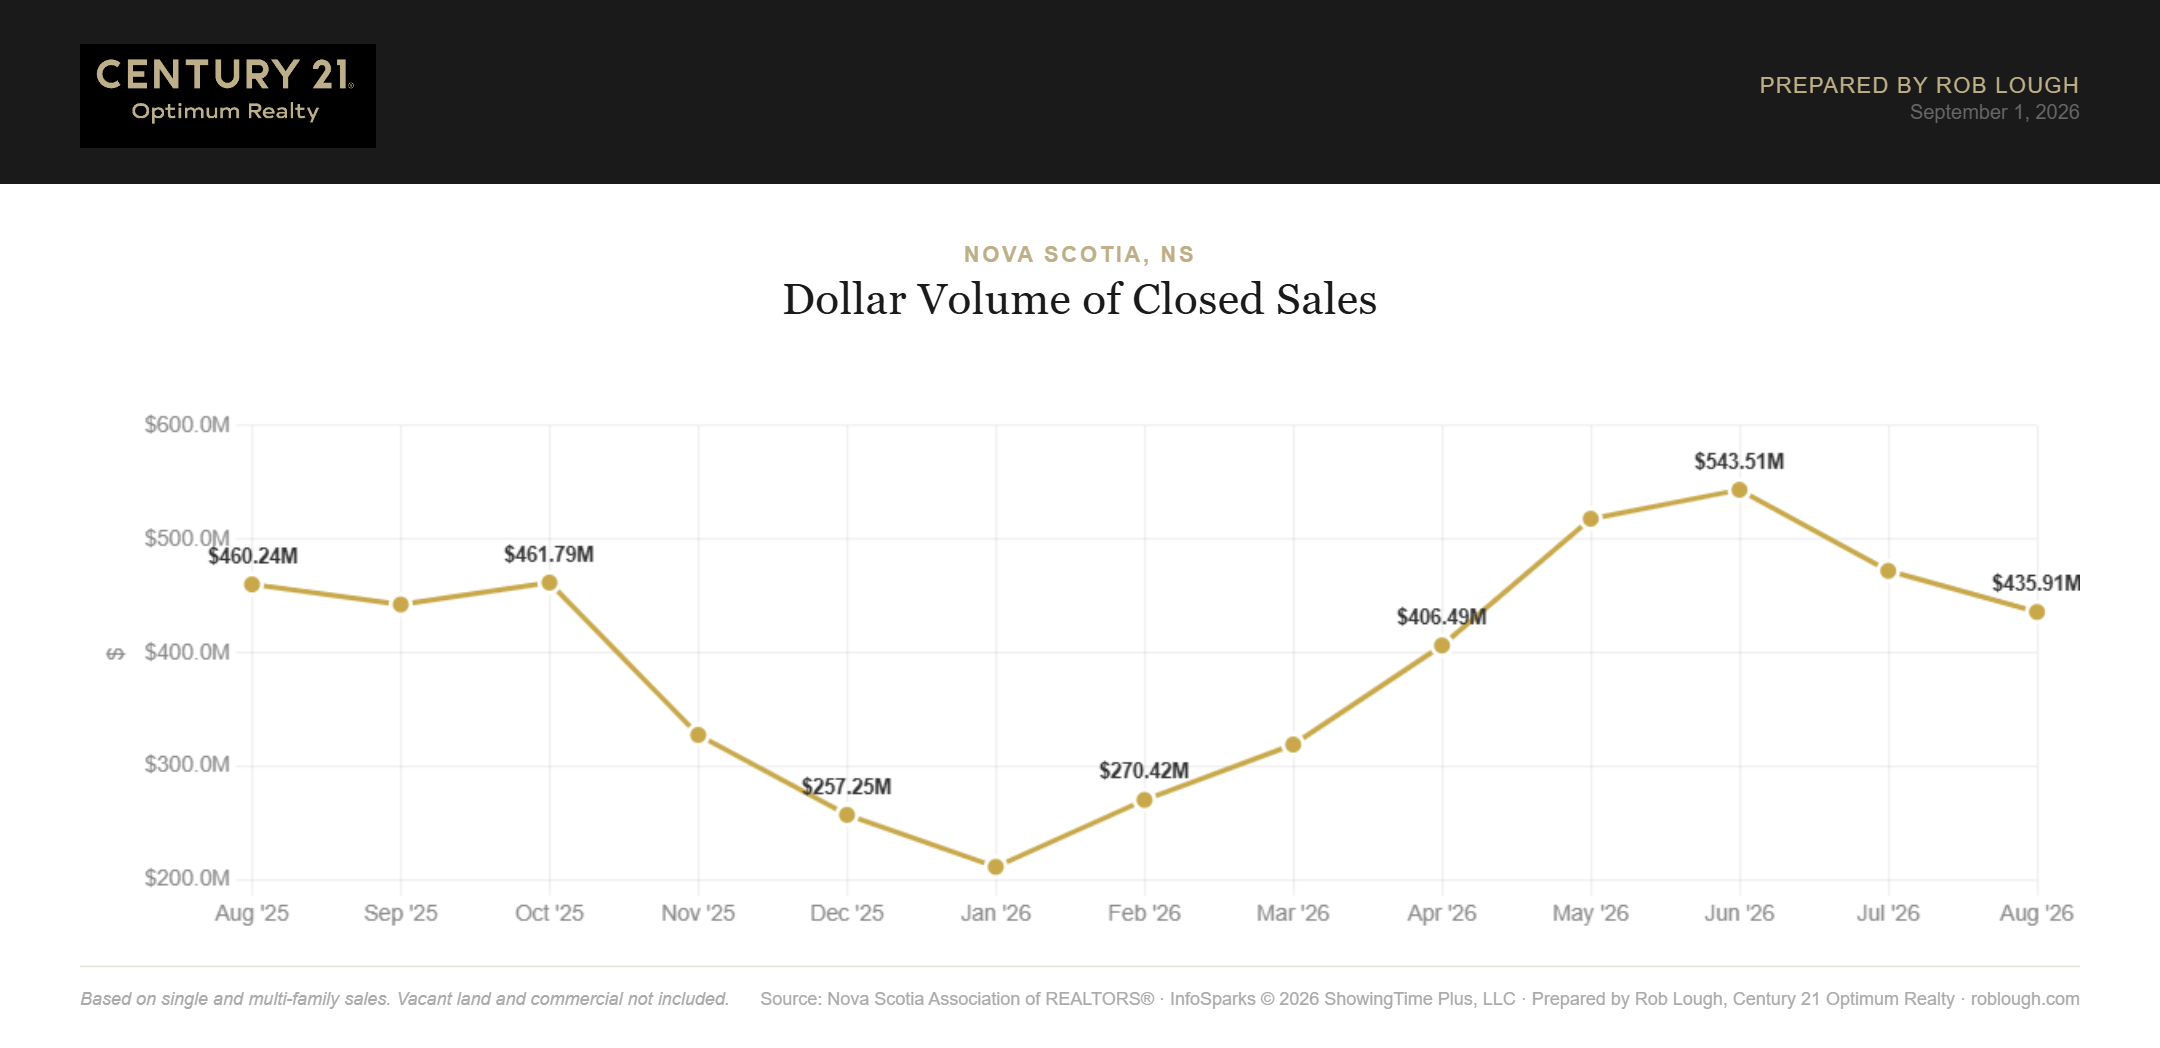
Nova Scotia Real Estate Market Statistics August 2026 dollar volume of closed sales
Dollar volume of closed sales reached $435.9 million in August, down from $472.1 million in July and down 5.3 per cent from $460.2 million in August 2025.
Total units sold followed the same path: 898 in August against 978 in July and 952 a year ago, a decline of 5.7 per cent year over year. Pending sales came in at 896, down from 932 in July, which points to a similarly measured September.
Days on Market Stretch to 50
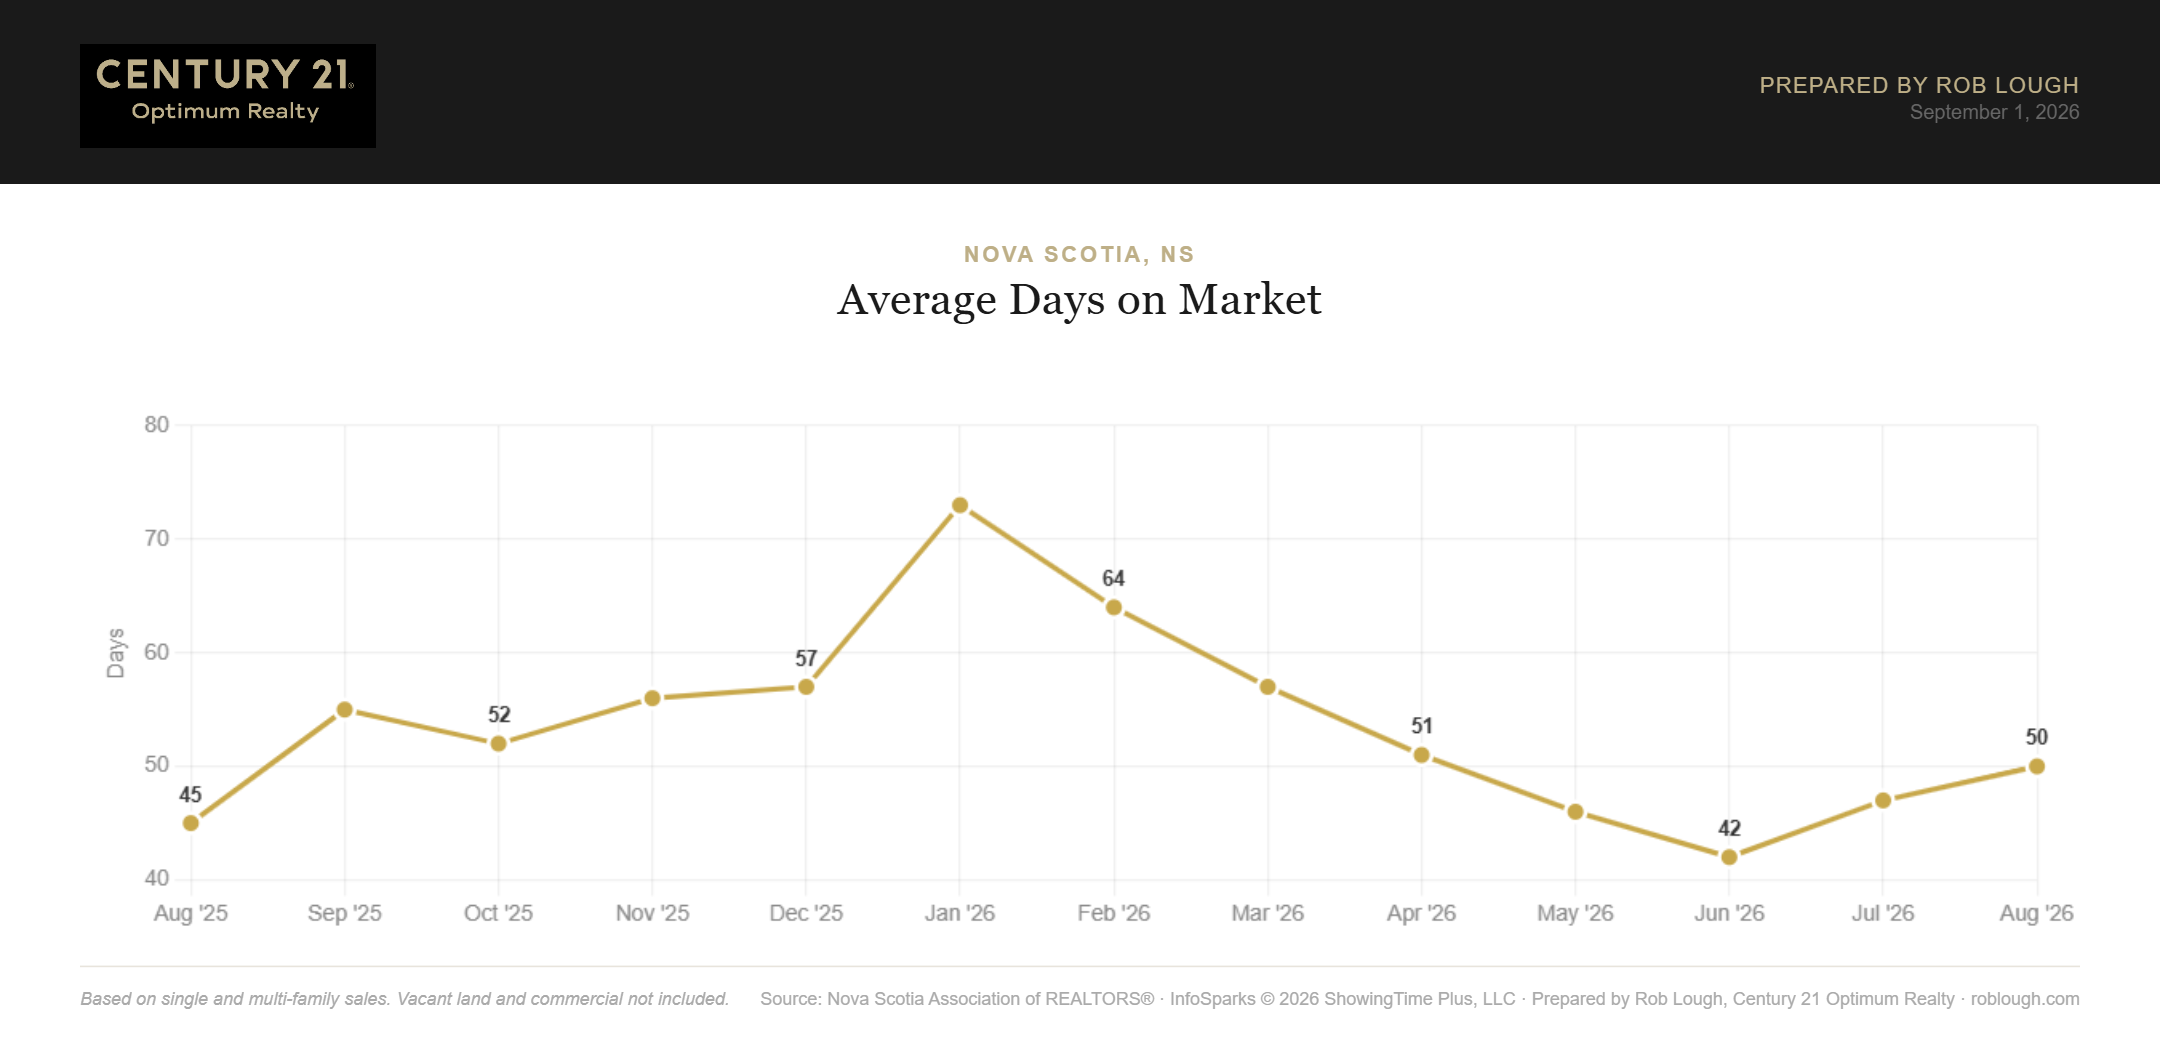
Nova Scotia Real Estate Market Statistics August 2026 average days on market
Average days on market rose to 50 in August from 47 in July and 45 in August 2025. Homes are taking roughly five days longer to sell than they did a year ago and eight days longer than at the June low of 42.
Fifty days is still a functional market by any historical standard. It is not a stalled one. But sellers should plan around it rather than around the two-week timelines of a few years back.
Sale Price Ratios Keep Softening
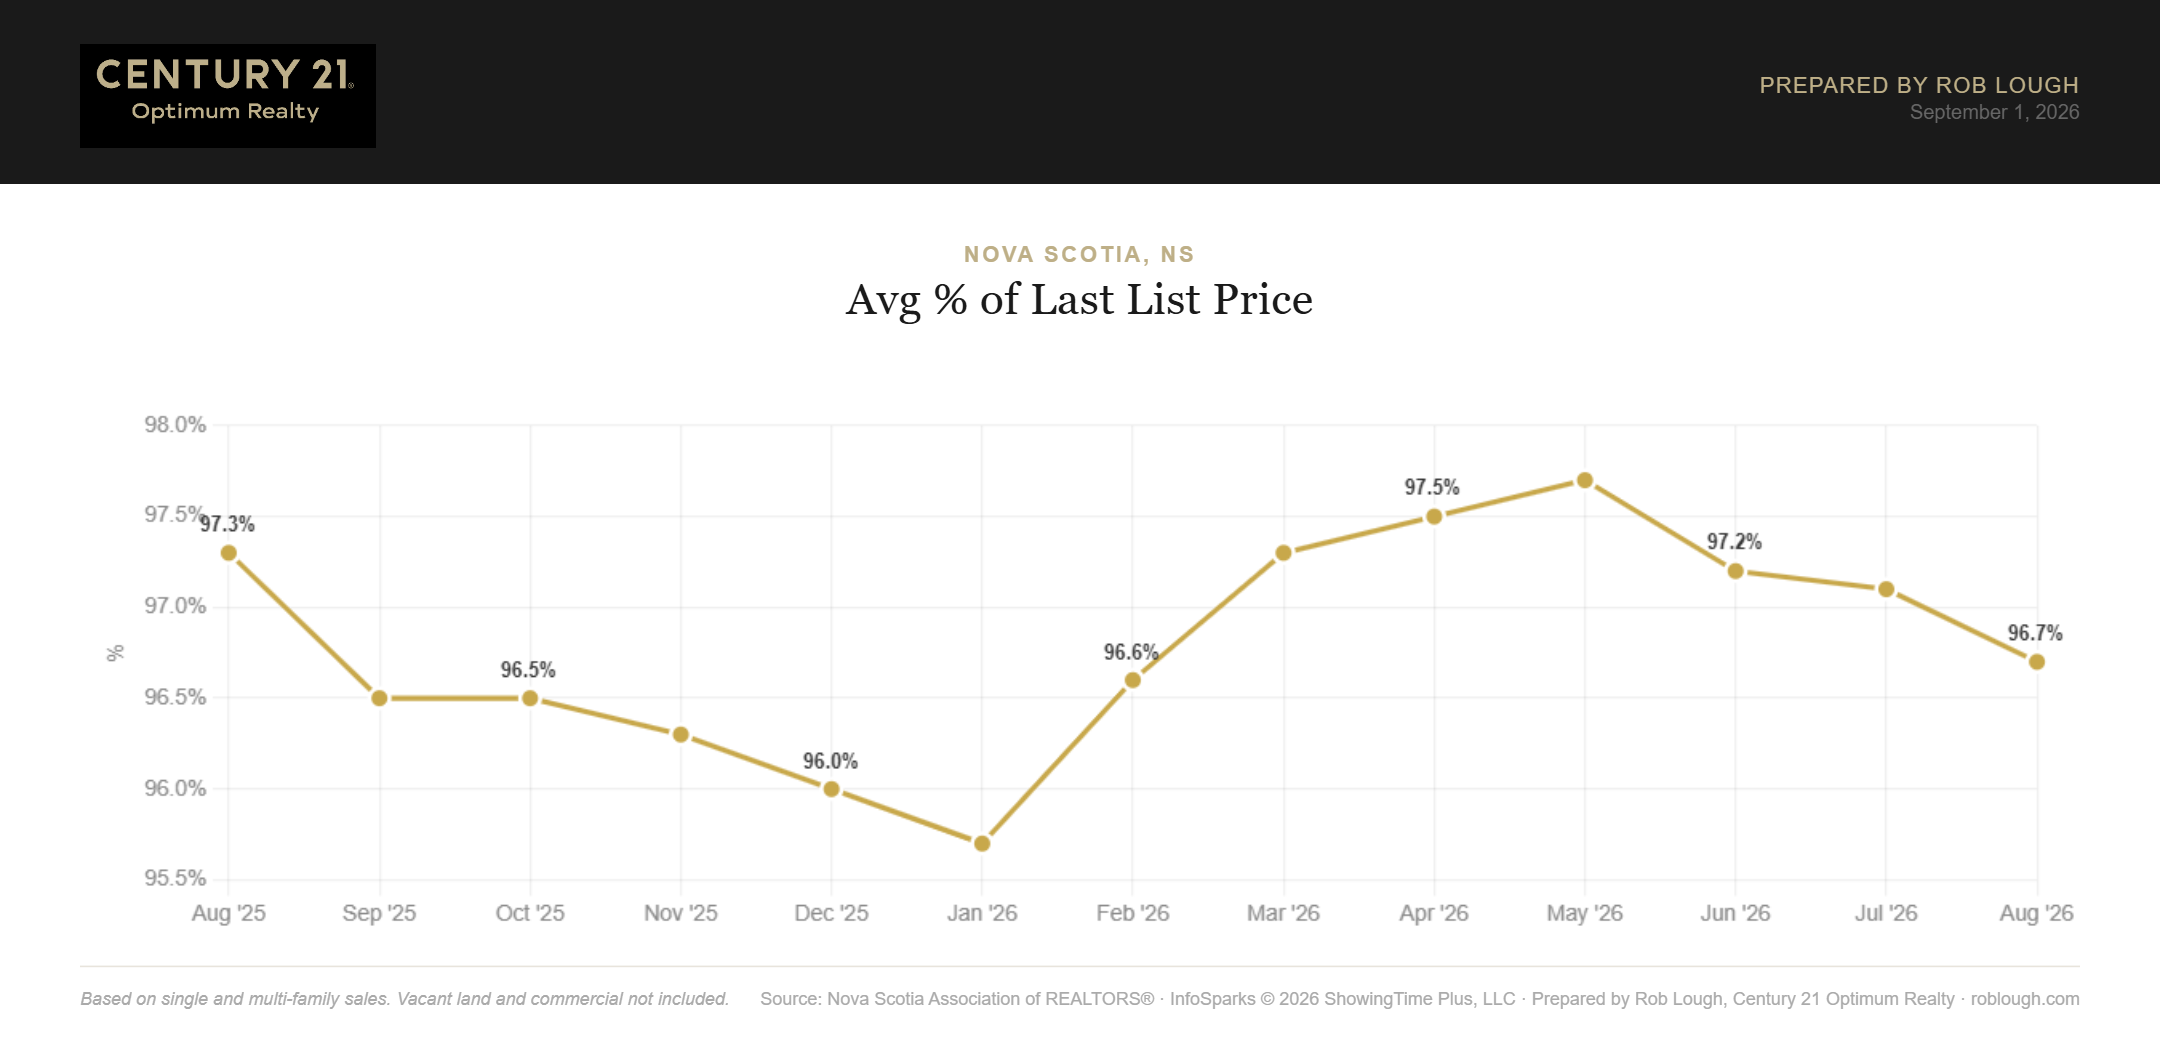
Nova Scotia Real Estate Market Statistics August 2026 average % of last list price
Sellers received 96.7 per cent of their last list price in August, down from 97.1 per cent in July and 97.3 per cent a year ago.
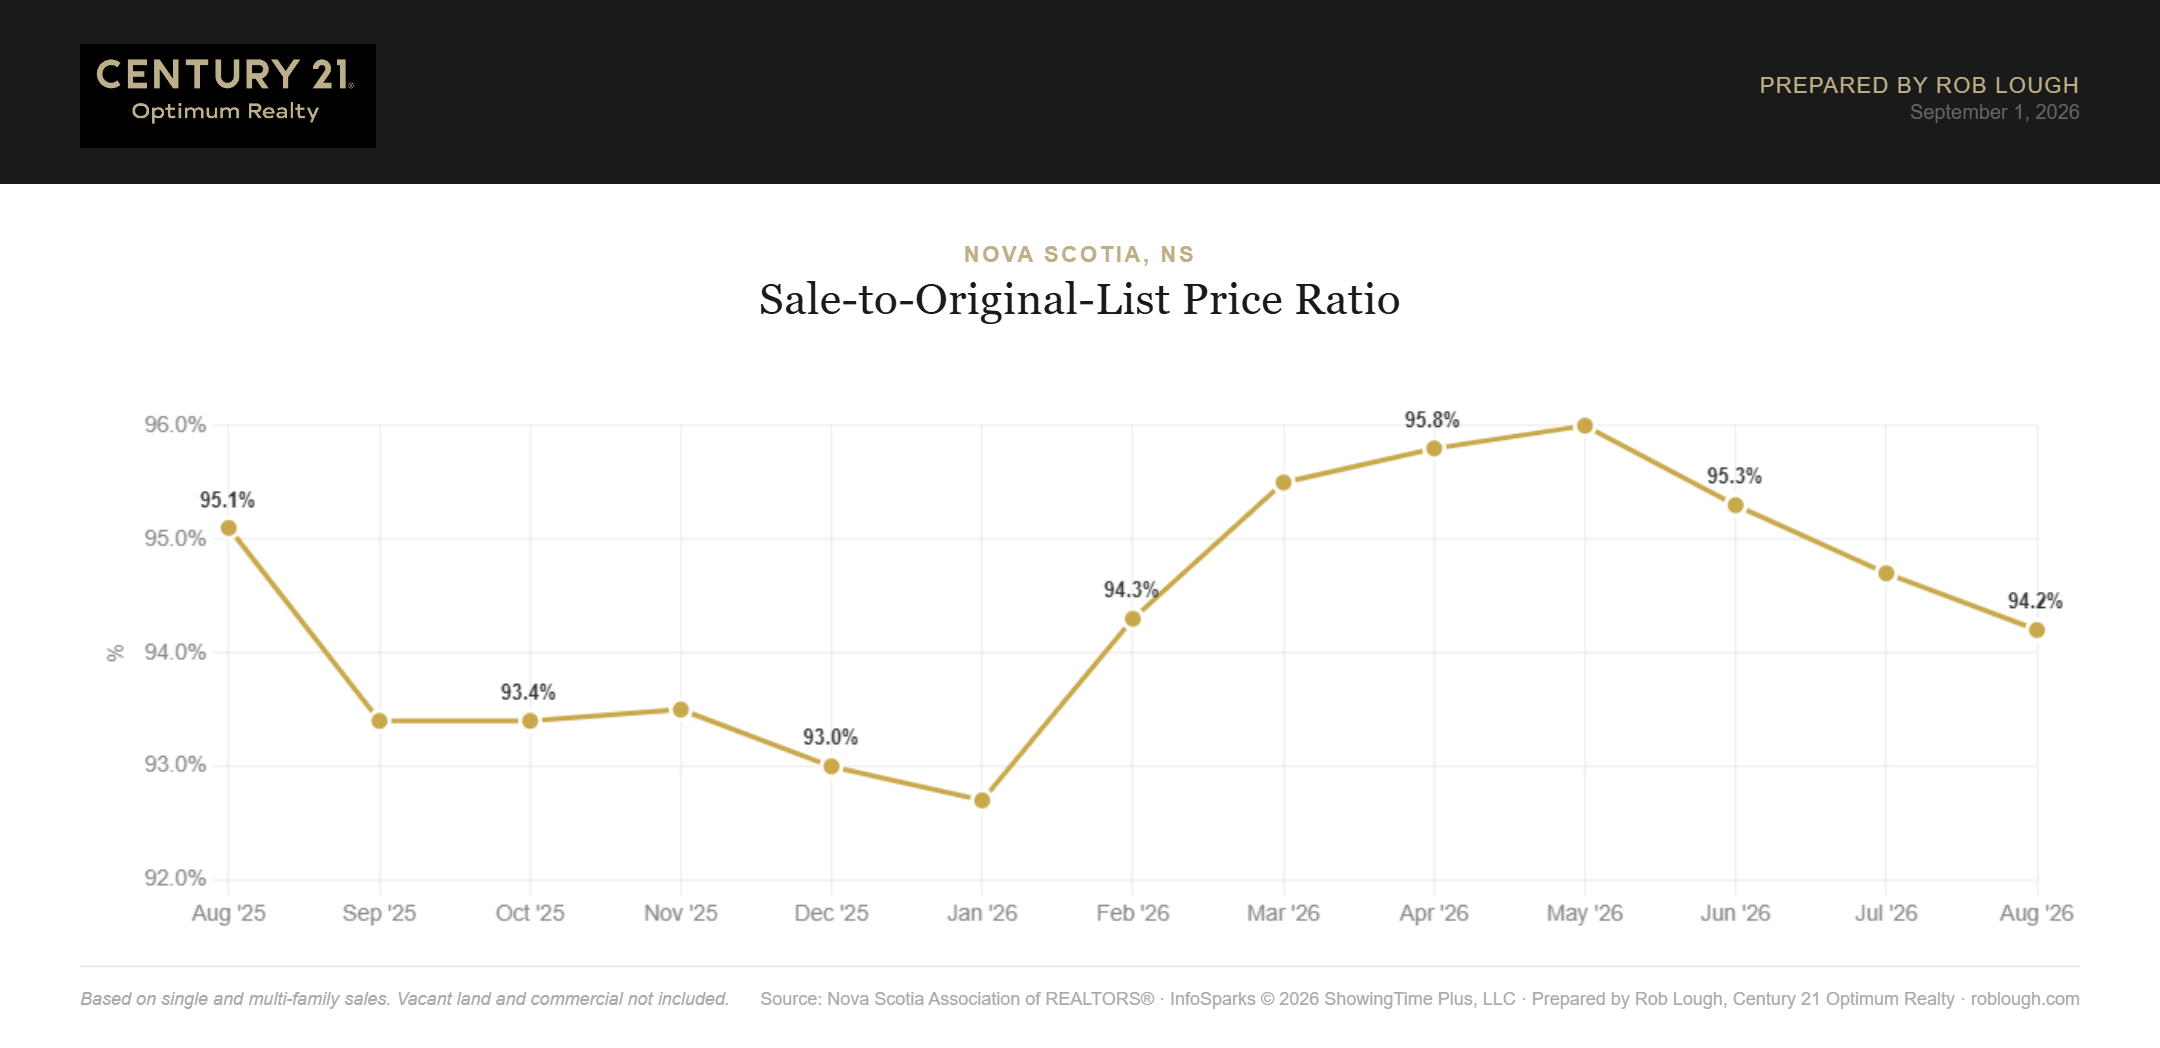
Nova Scotia Real Estate Market Statistics August 2026 average % of original list price
Against the original list price, the ratio was 94.2 per cent, down from 94.7 per cent in July and 95.1 per cent in August 2025.
The gap between those two figures, about 2.5 percentage points, is the cost of a price reduction. It is the clearest evidence in this report that mispriced listings are being corrected before they sell, and that the correction is getting slightly more expensive each month.
Buyer Traffic Thins
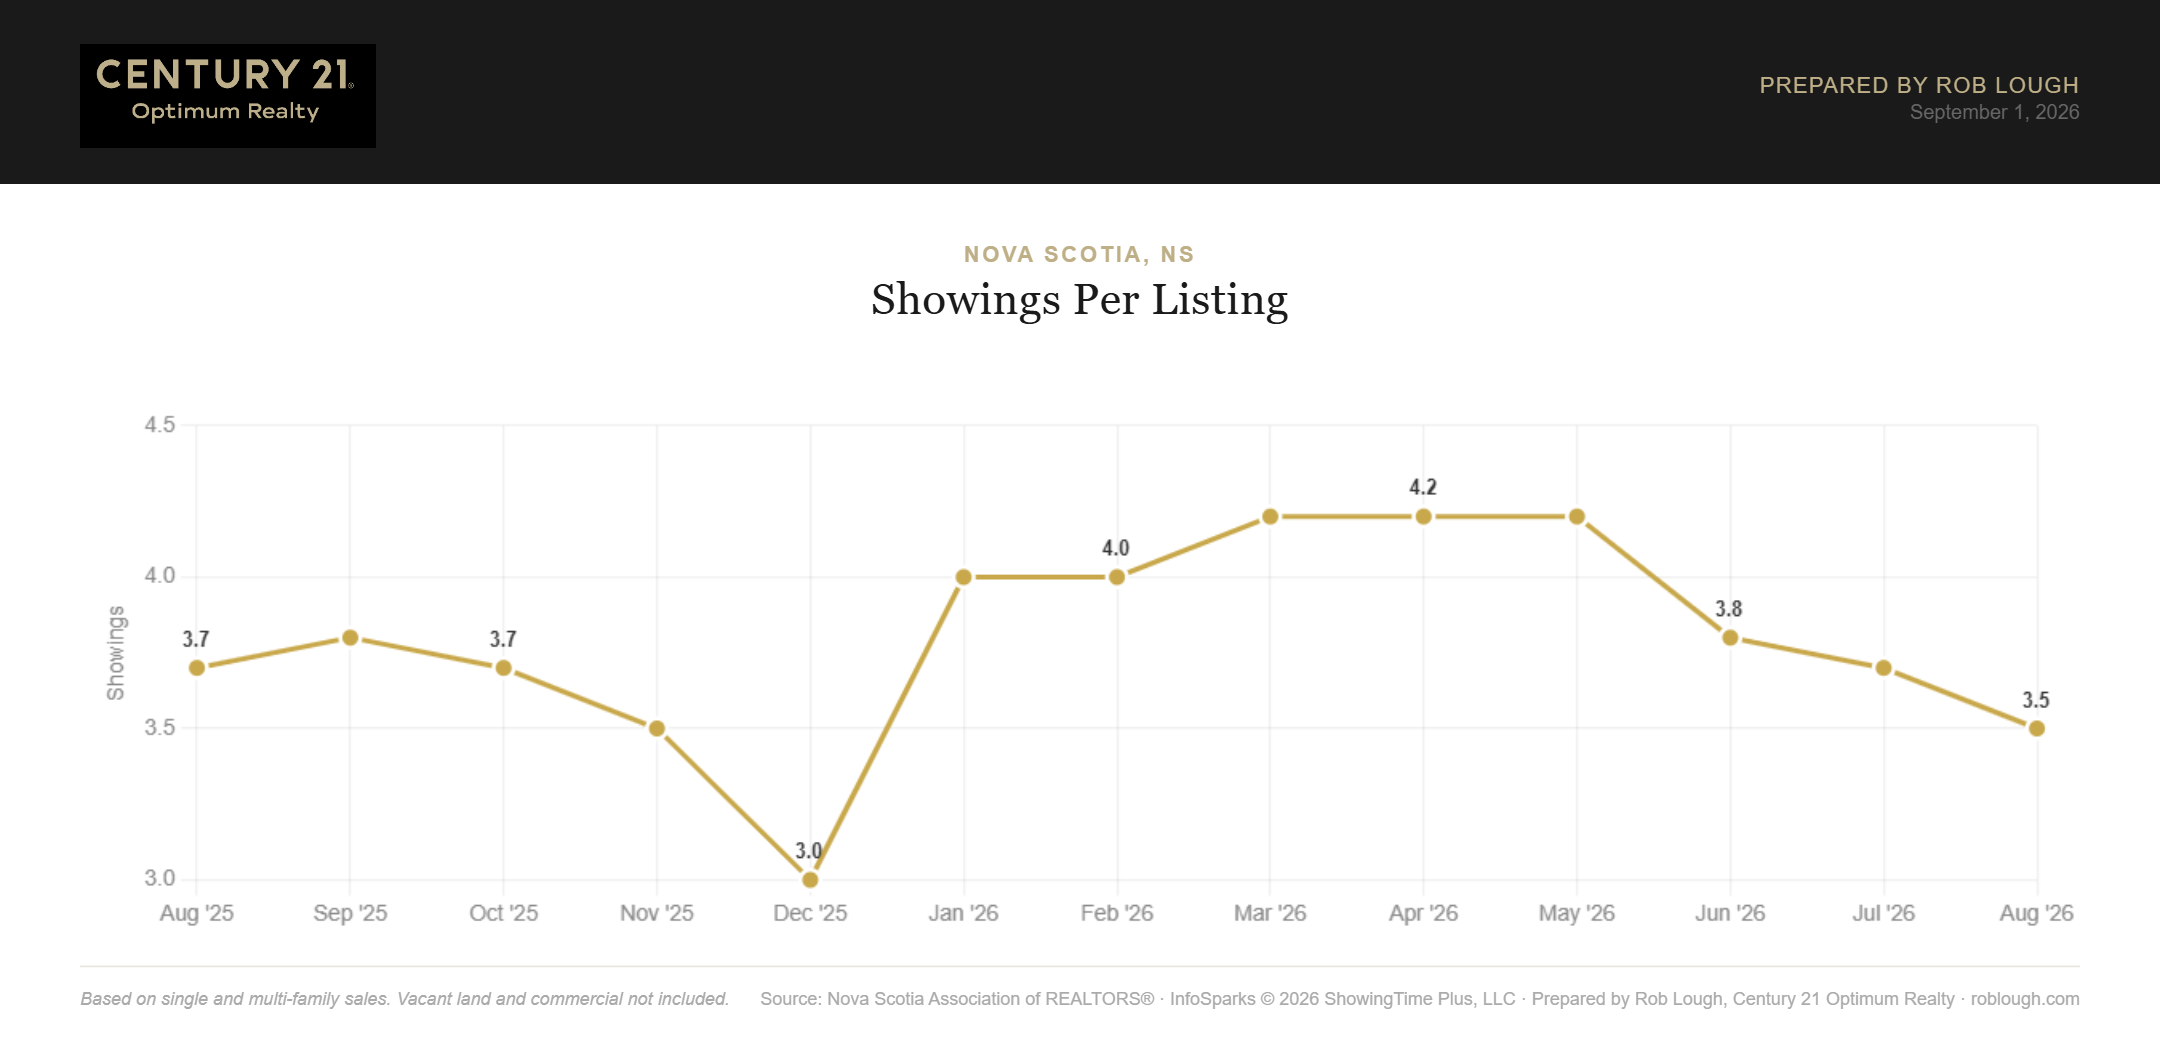
Nova Scotia Real Estate Market Statistics August 2026 average showings per listing
Showings per listing fell to 3.5 in August, the lowest reading in the trailing 13 months, down from 3.7 in July and 3.7 a year ago. With more listings competing for a smaller pool of active buyers, each individual property is simply seeing less traffic.
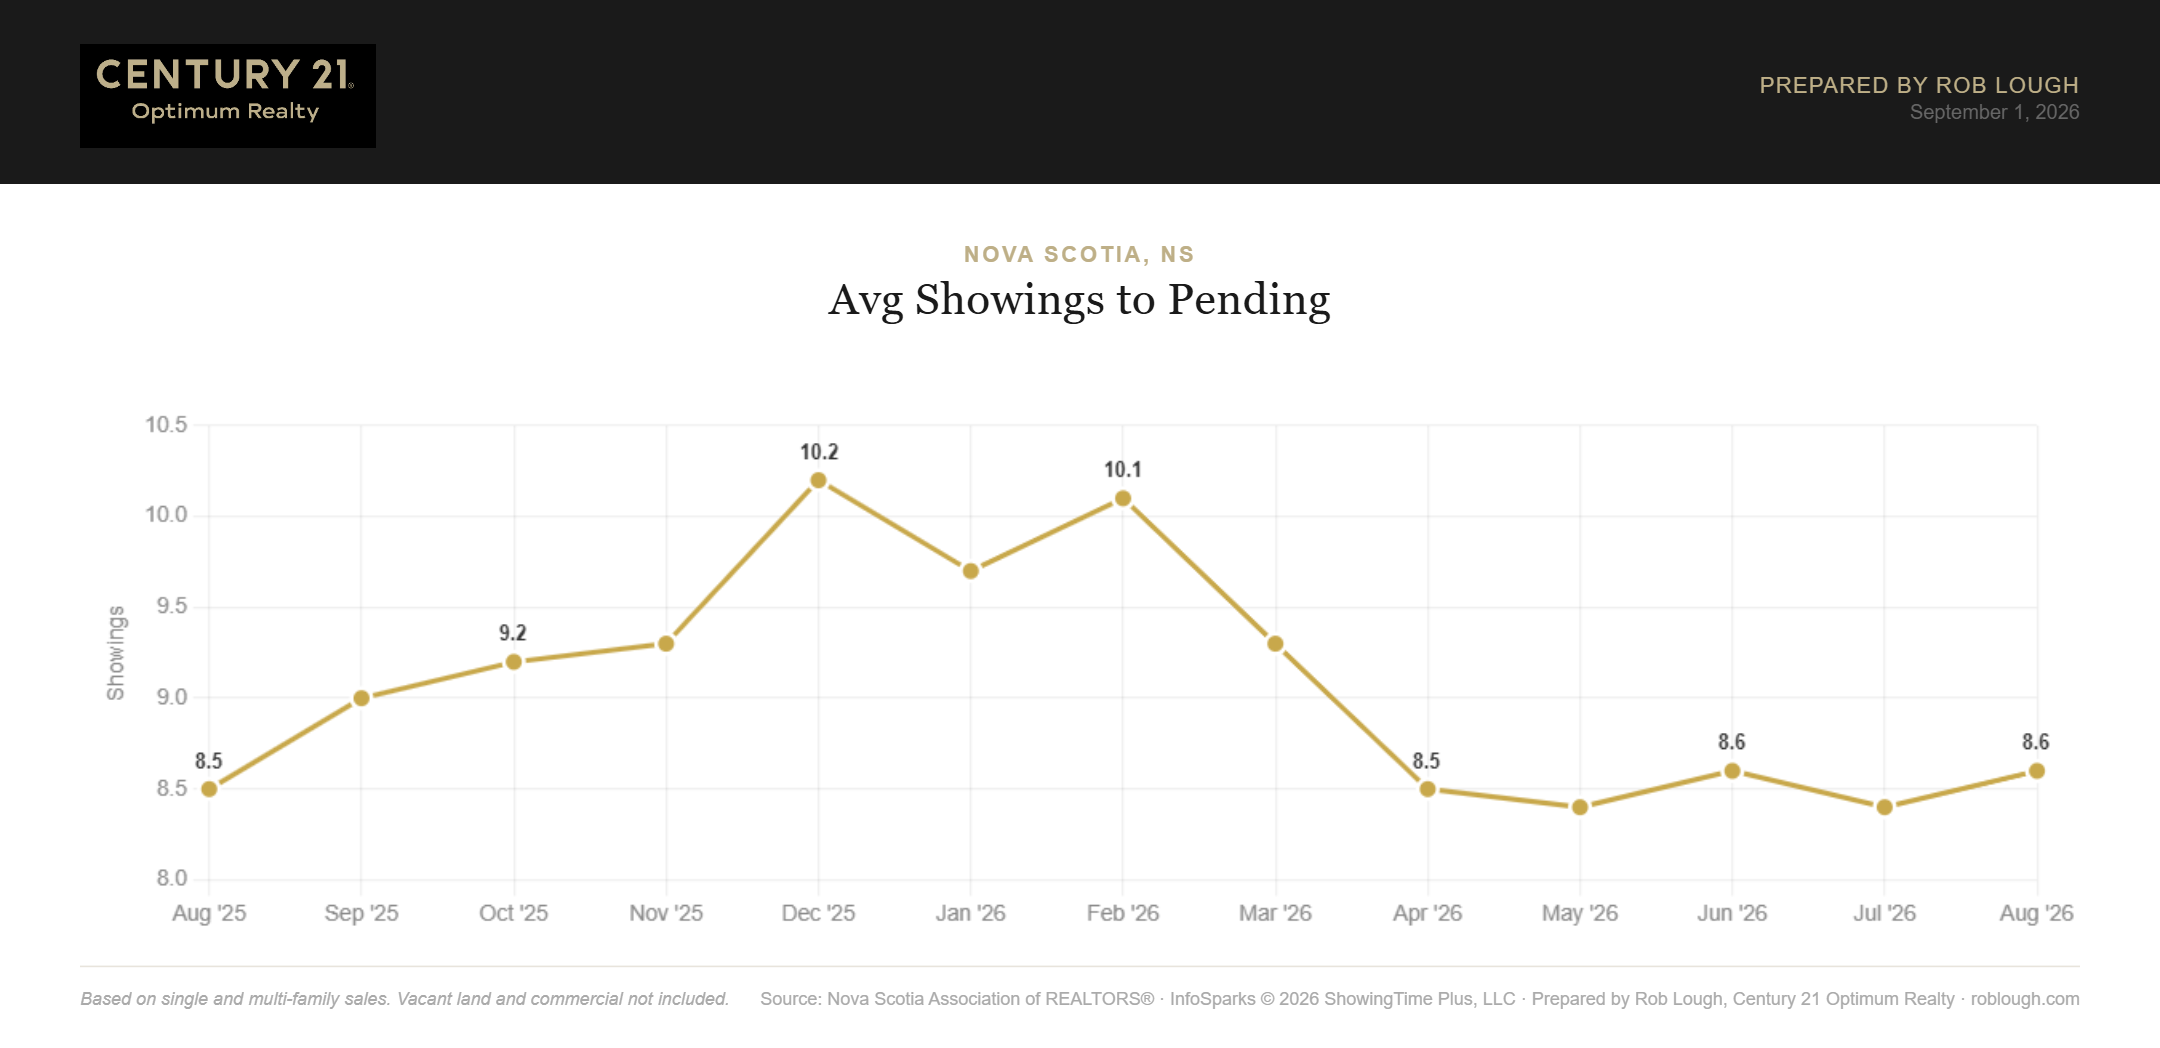
Nova Scotia Real Estate Market Statistics August 2026 average showings to pending
Average showings to pending was 8.6, up slightly from 8.4 in July and close to last August’s 8.5. The buyers who are out there remain decisive once they find the right property. They are just fewer in number and less inclined to compromise.
What This Means for Buyers and Sellers
For buyers: This is the most favourable market Nova Scotia has offered in several years. With 4,427 homes available and 5.6 months of supply, you have choice, time to think, and negotiating room that did not exist in 2022 or 2023. The 94.2 per cent original-list ratio means the average transaction closes below asking. Conditions on financing and inspection are once again realistic rather than a liability. Move deliberately, but do not mistake a balanced market for a falling one: per-square-foot values are still up nearly five per cent year over year. Browse current Nova Scotia listings with our team or get pre-approved before you start.
For sellers: Pricing is now the whole game. The spread between last-list and original-list ratios shows what happens to sellers who test the market high: they reduce, they wait, and they still finish below where a correctly priced listing would have landed. With showings per listing at a 13-month low, your property gets fewer chances to make an impression, so presentation and pricing have to be right on day one. Sixty to seventy-five days is a realistic planning horizon. Get a free market evaluation before you set a number.
Frequently Asked Questions
Is Nova Scotia a buyer’s or seller’s market in August 2026? It is close to balanced and drifting toward buyers. At 5.6 months of supply, the province is just below the six-month threshold that typically defines a balanced market. Individual communities vary considerably.
Are Nova Scotia home prices falling? Not meaningfully. The average sales price of $486,511 is up 0.4 per cent year over year and the median of $435,000 is down 1.1 per cent. Price per square foot is up 4.9 per cent. The overall picture is flat prices with a shift in what is selling, not a decline in values.
How long does it take to sell a home in Nova Scotia? Average days on market was 50 in August 2026, up from 45 a year earlier. Well-priced homes in strong locations still move considerably faster.
How much below asking are homes selling for? The average sale closed at 96.7 per cent of the last list price and 94.2 per cent of the original list price. On a home originally listed at $500,000, that works out to roughly $29,000 off the starting number, with most of it coming from price reductions before the sale rather than from negotiation at the offer stage.
Why is inventory rising if new listings are down? Because sales are slowing faster than new supply is. With 1,385 new listings against 898 sales, unsold homes accumulate month over month even as fewer sellers come to market.
Should I wait for prices to drop further? Nothing in this data indicates an imminent decline. The negotiating advantage buyers have gained is real, but per-square-foot values continue to rise. Waiting trades a known advantage today for an unknown one later. Run the numbers on a specific property with our mortgage calculator.
About This Report
Data is sourced from the Nova Scotia Association of REALTORS® and covers province-wide single-family and multi-family residential sales for August 2026. Market statistics describe province-wide averages and may not reflect conditions in a specific community, price band, or property type. For advice on a particular property, connect with our team at Century 21 Optimum Realty.

