
 Facebook
 X
X
 Pinterest
 Copy Link
Nova Scotia Real Estate Market Statistics July 2026
By Rob Lough, Broker/Owner | Century 21 Optimum Realty | August 1, 2026
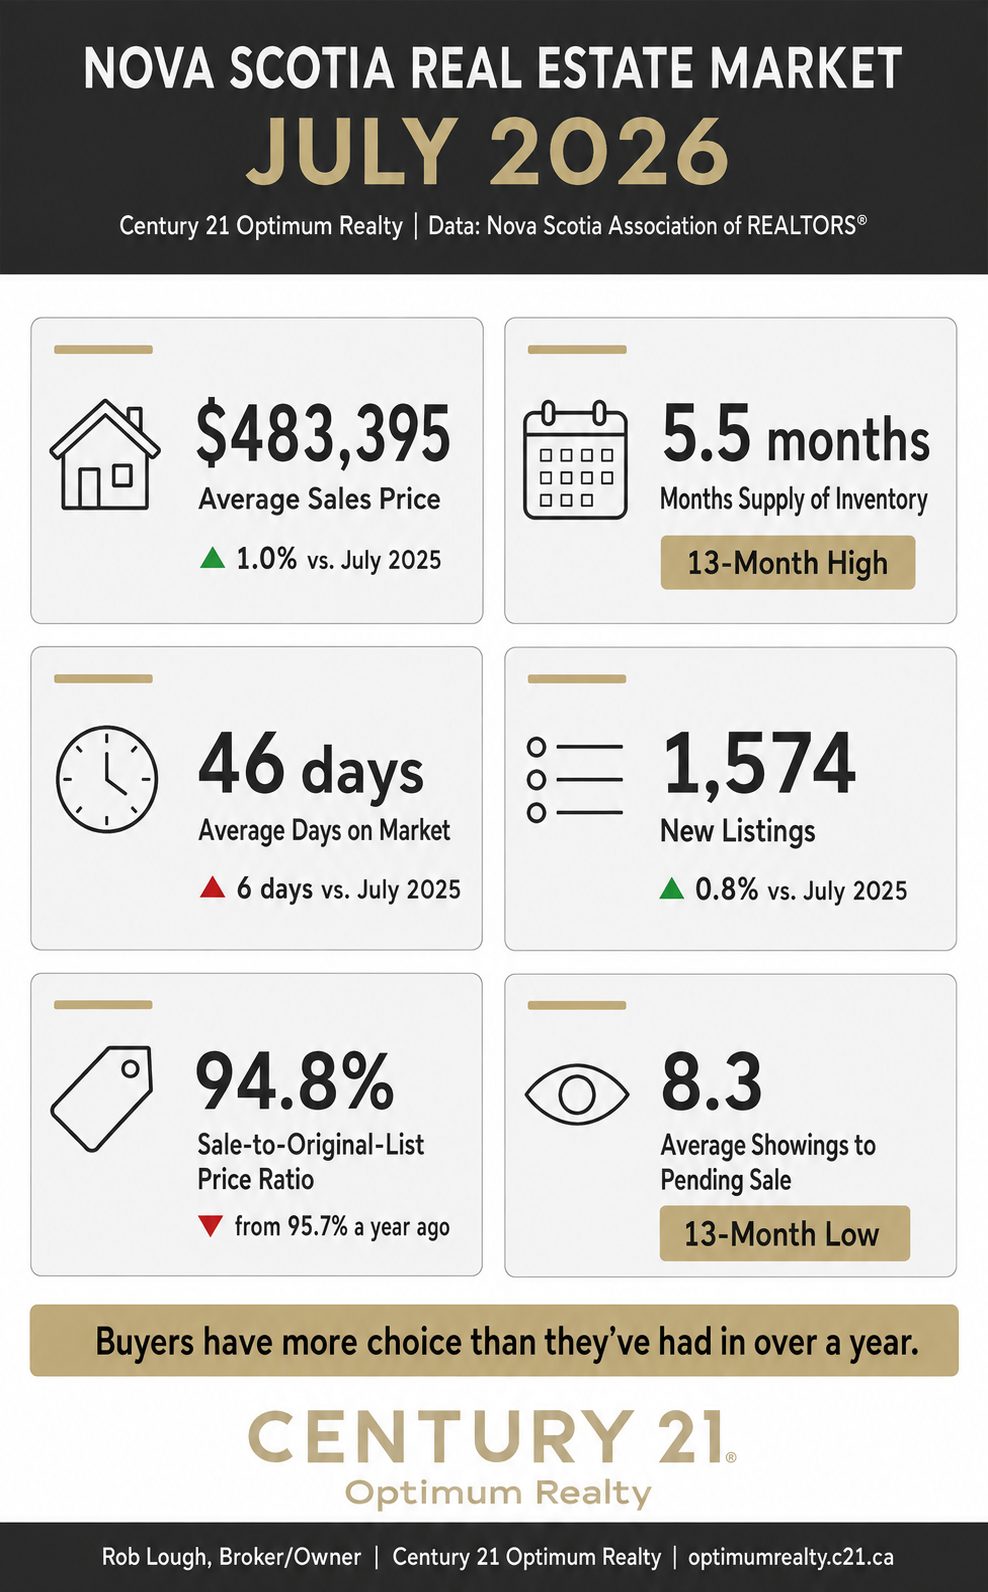
Nova Scotia’s housing market continued its gradual move toward balance in July 2026. Data from the Nova Scotia Association of REALTORS® shows months supply of inventory at its highest level in over a year, prices easing back from the spring peak, and list-price ratios softening further in buyers’ favour. The market isn’t cooling sharply, it’s normalizing. Whether you’re buying or selling, understanding these trends matters. At Century 21 Optimum Realty, we track these numbers every month so you can make informed decisions.
Months Supply Hits a 13-Month High: 5.5 Months
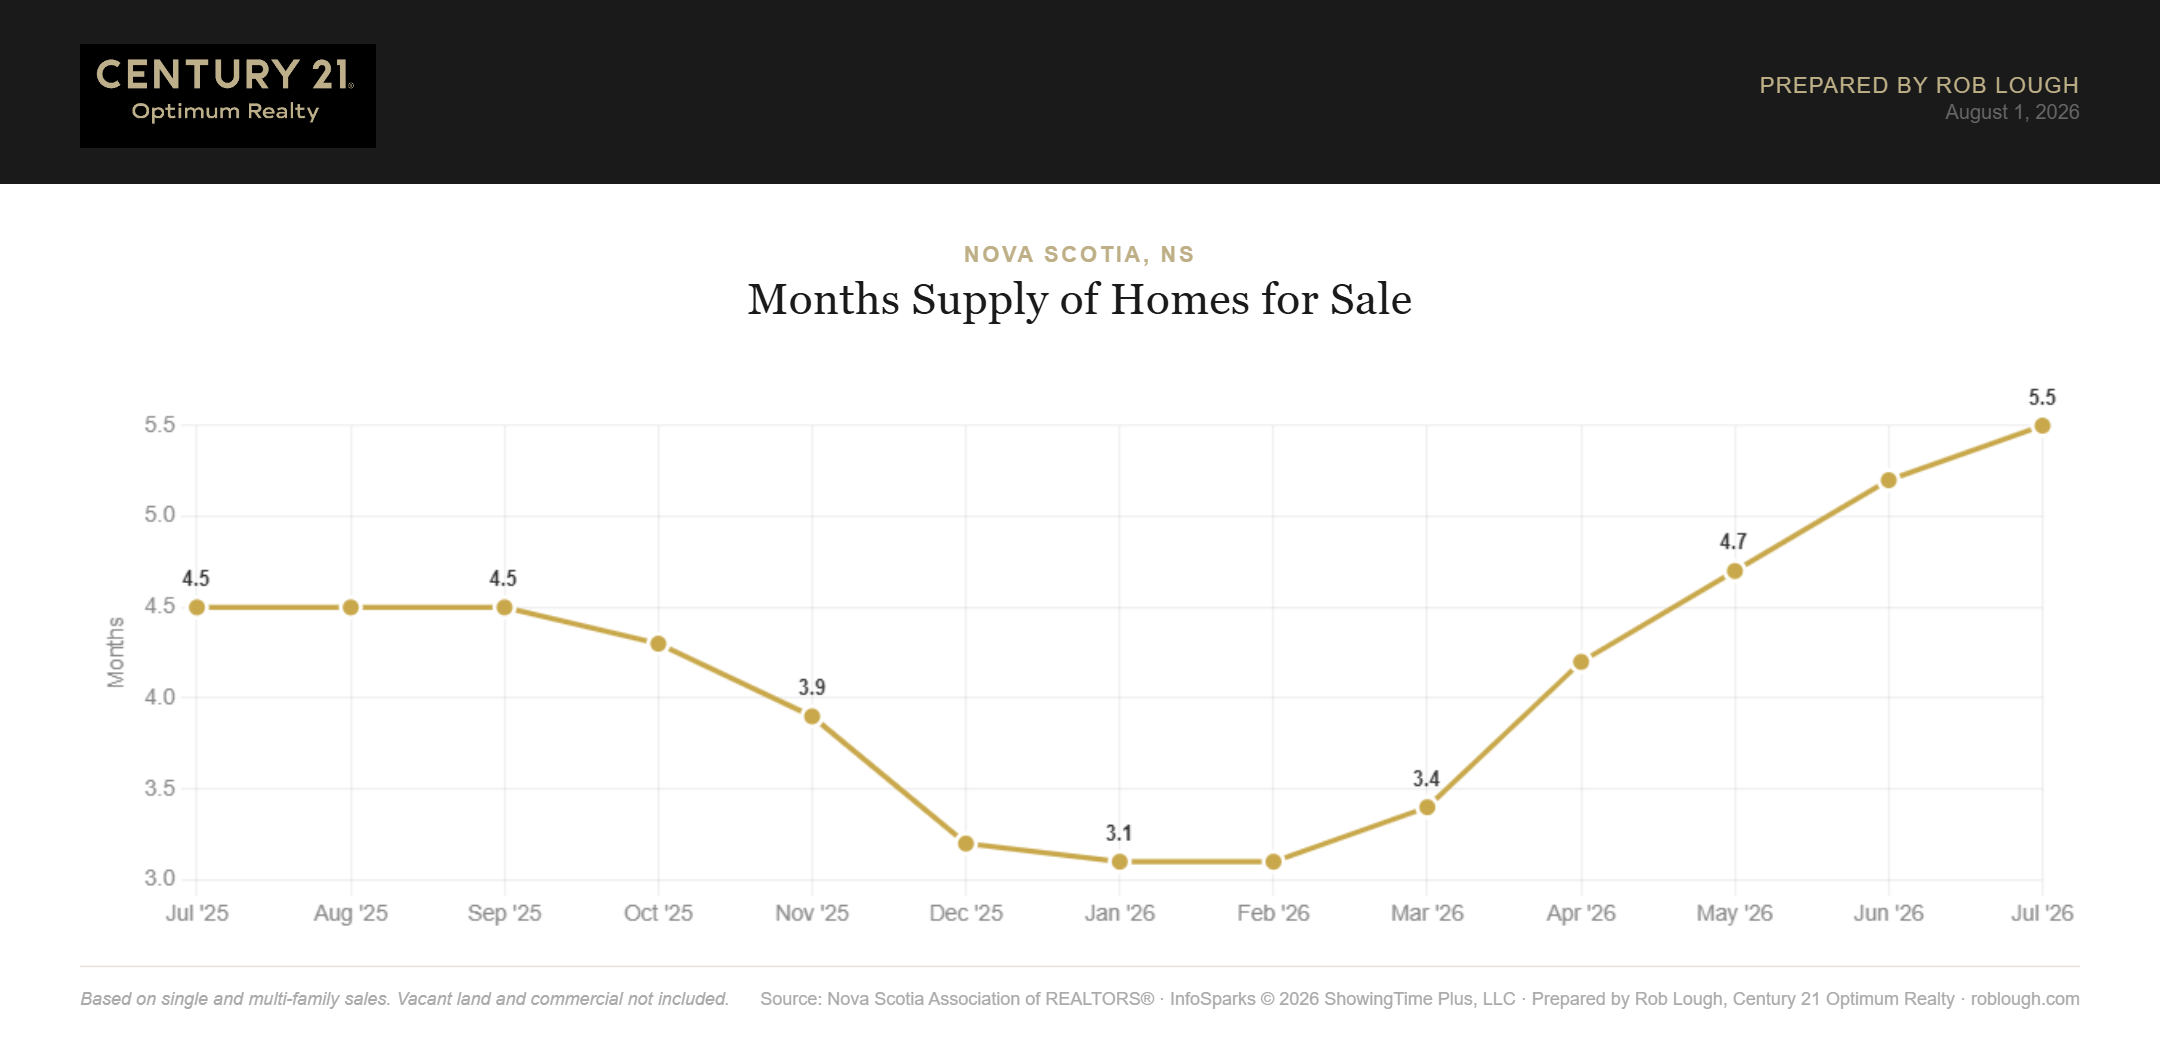
Months supply of homes for sale rose to 5.5 months in July 2026, up from 5.2 in June and well above July 2025’s 4.5 months. That’s the highest reading in the trailing 13 months and puts Nova Scotia right at the doorstep of the 6-month threshold that typically defines a balanced market.
For context, months supply bottomed at 3.1 back in January and February 2026. In six months, buyers have gone from picking through scraps to having genuinely more choice and more time to decide. If you’re considering a purchase, our team at Century 21 Optimum Realty can help you understand what this shift means for negotiating power in your target neighbourhood.
Nova Scotia Real Estate Market Statistics July 2026 Months Supply of Inventory
New Listings Ease From the Spring Pace
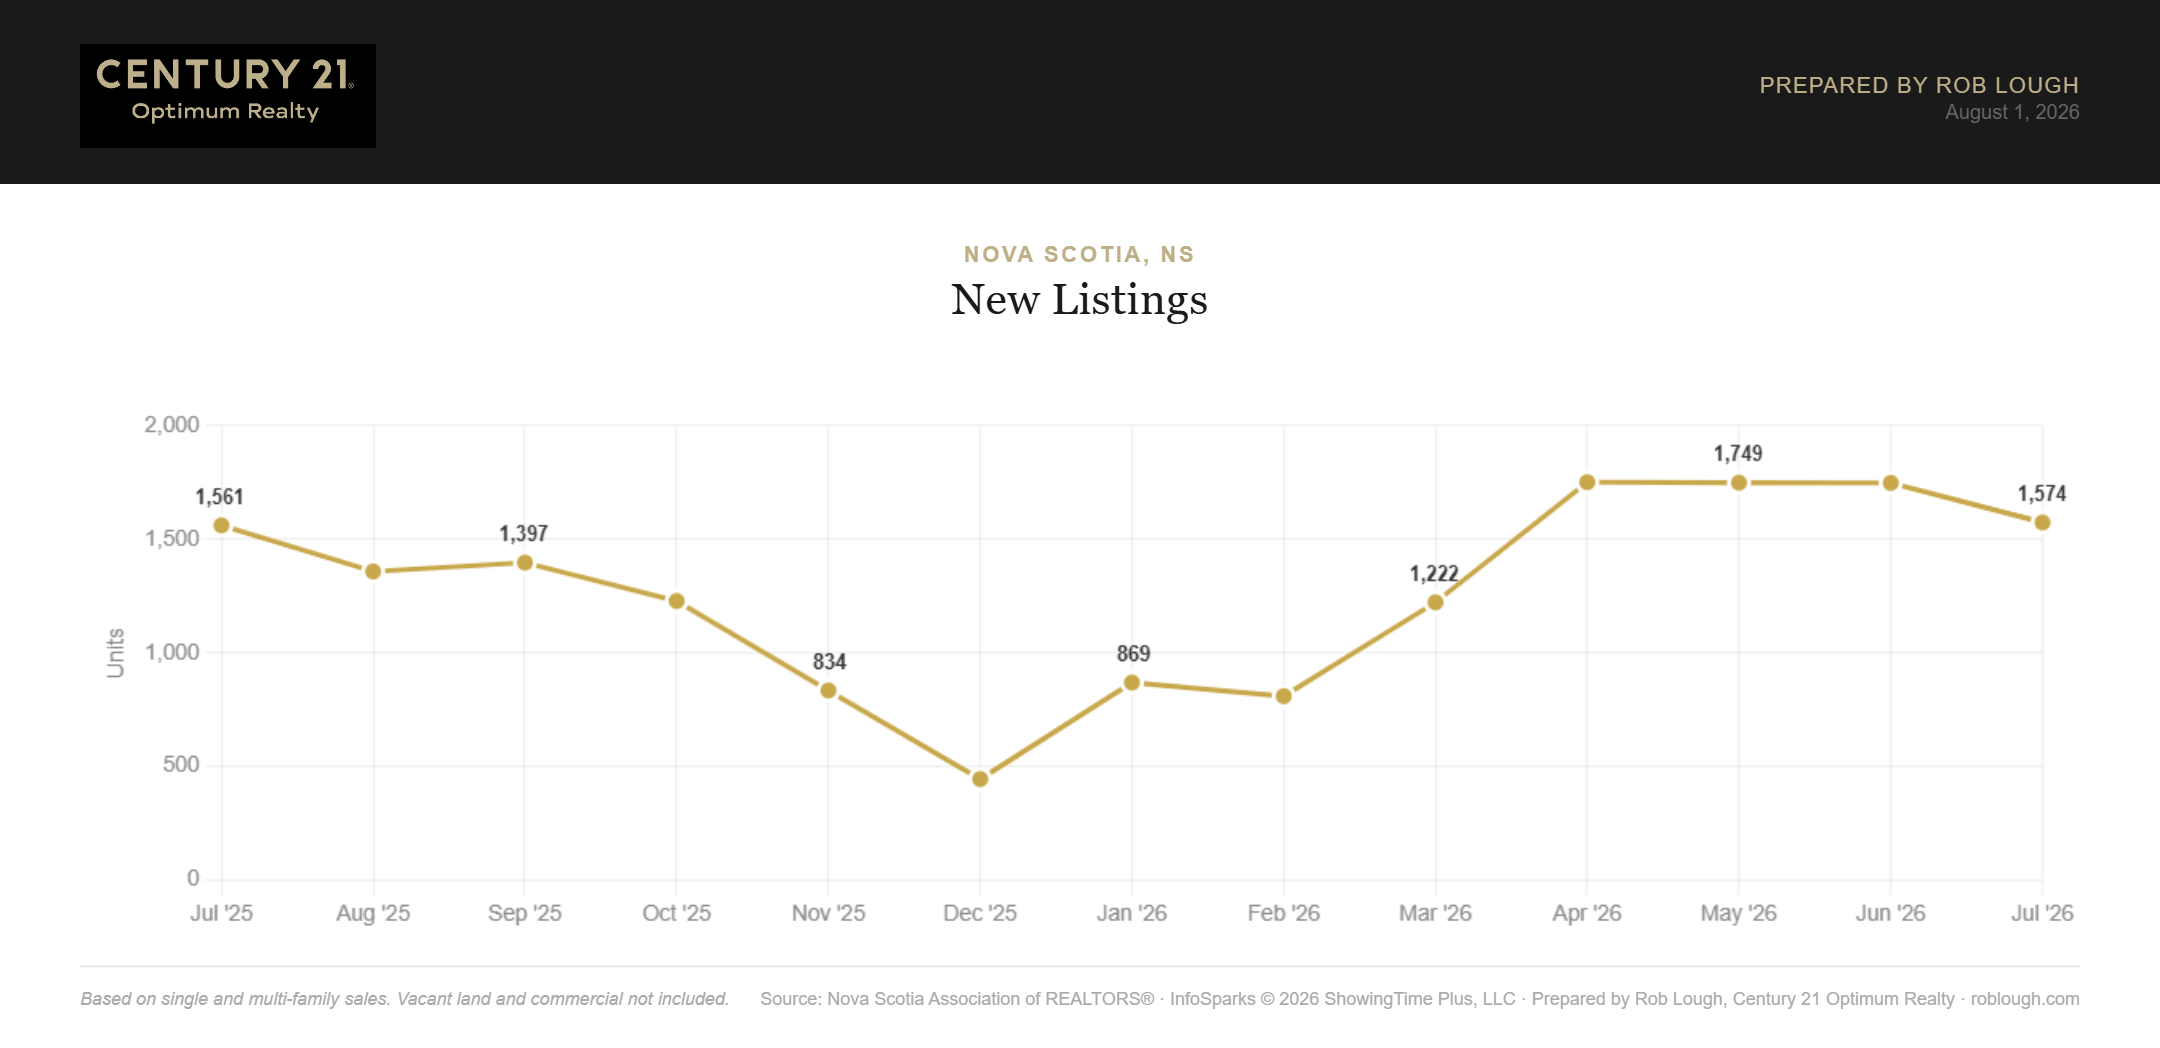
New listings came in at 1,574 in July, down 10.0% from June’s 1,748 but essentially flat against July 2025’s 1,561 (up 0.8%). Spring’s listing surge, April, May and June all landed near 1,750, has settled back to a normal summer rhythm.
That matters for supply: with new inventory tapering while months supply keeps climbing, the build-up in available homes is being driven more by slower absorption than by a flood of new listings. Browse current Nova Scotia listings with our team.
Nova Scotia Real Estate Market Statistics July 2026 Number of new listings
Prices Pull Back From June, Still Up Year-Over-Year
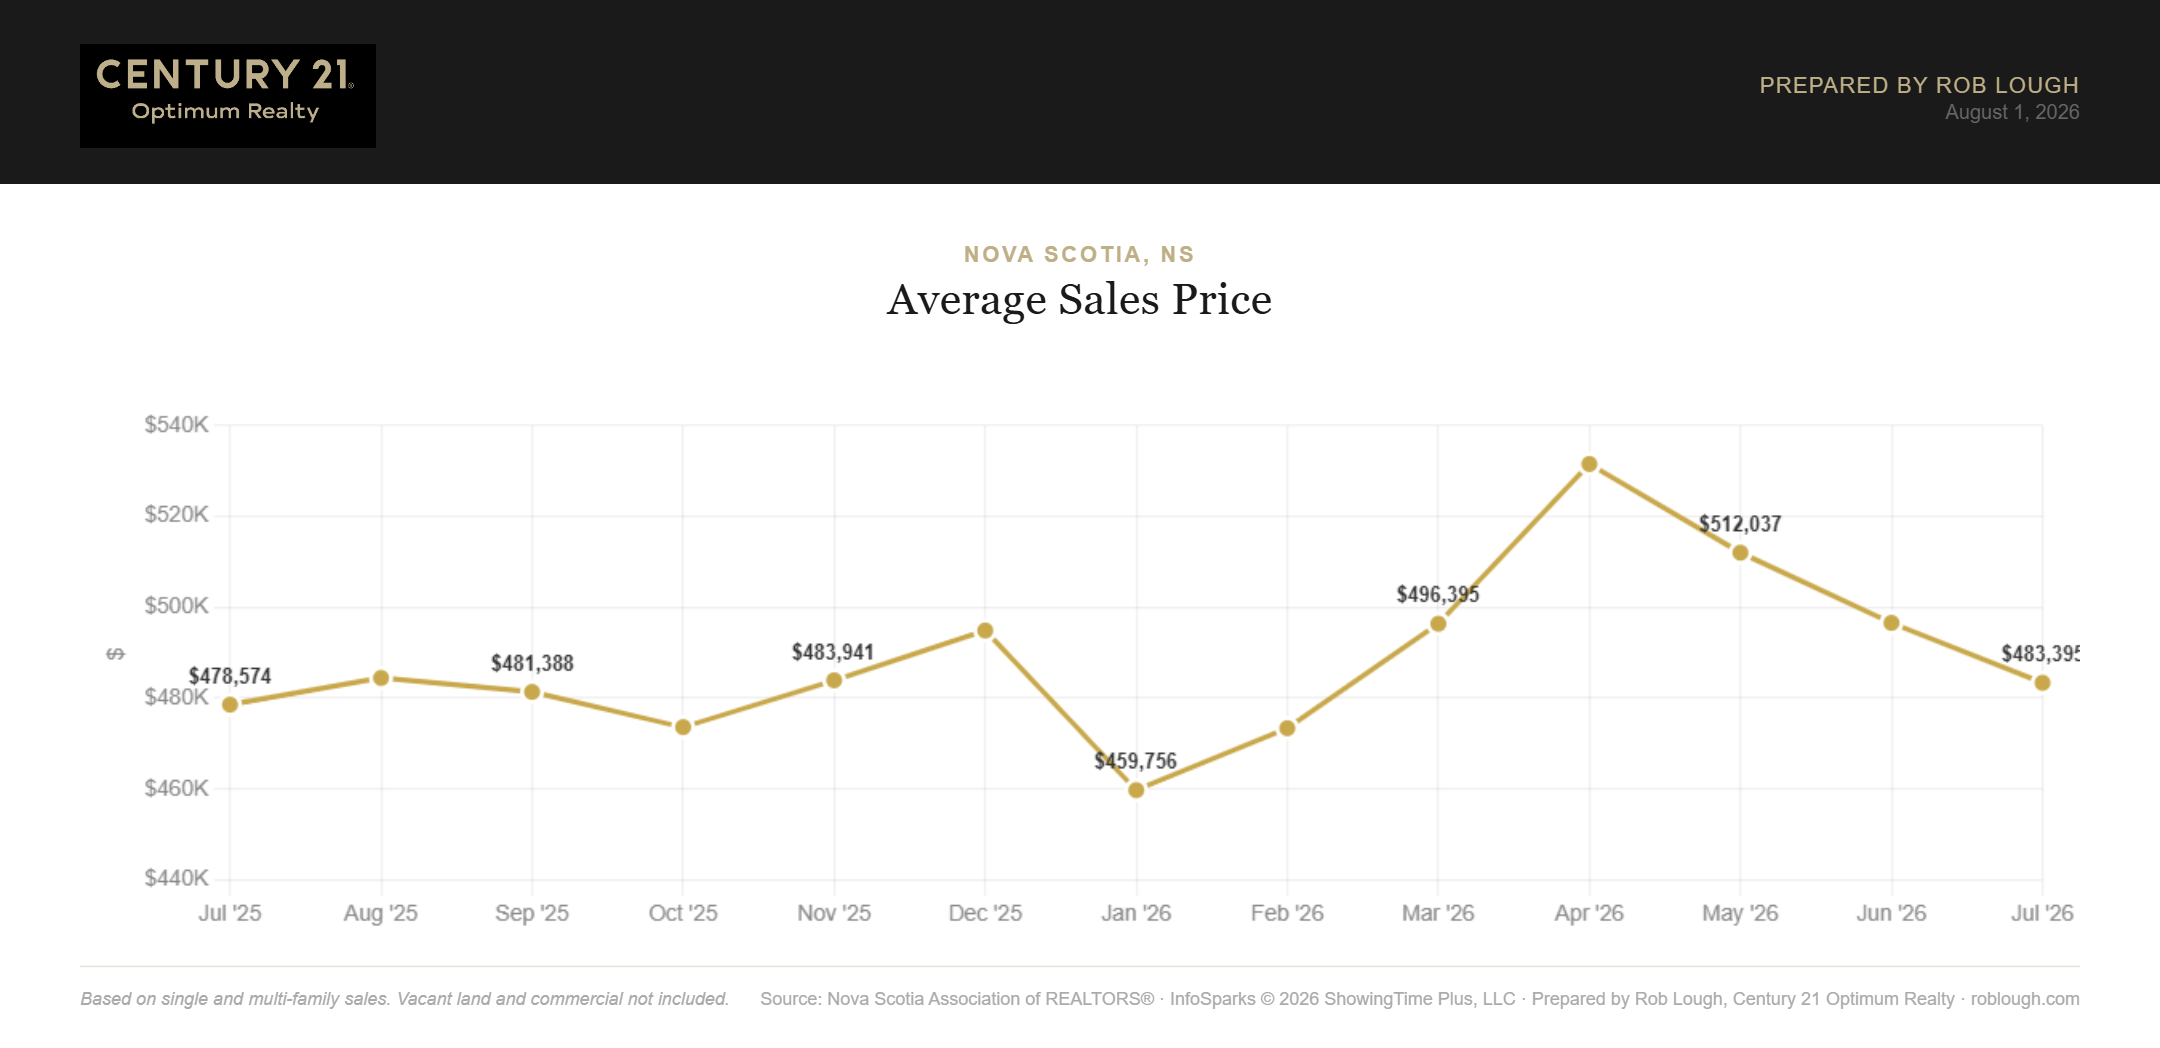
The average sales price was $483,395 in July 2026, down 2.7% from June’s $496,578 but up 1.0% from July 2025’s $478,574. Prices have now eased for two consecutive months from April’s 13-month peak of $531,561.
Nova Scotia Real Estate Market Statistics July 2026 Average Sales Price
The median sales price came in at $440,000, down 4.3% from June’s $460,000 and down 2.0% from July 2025’s $449,000. The median falling faster than the average suggests the mix of homes selling has tilted somewhat toward the lower end of the market this summer. For sellers wondering what their home is worth today, connect with our team at Century 21 Optimum Realty for a current market evaluation.
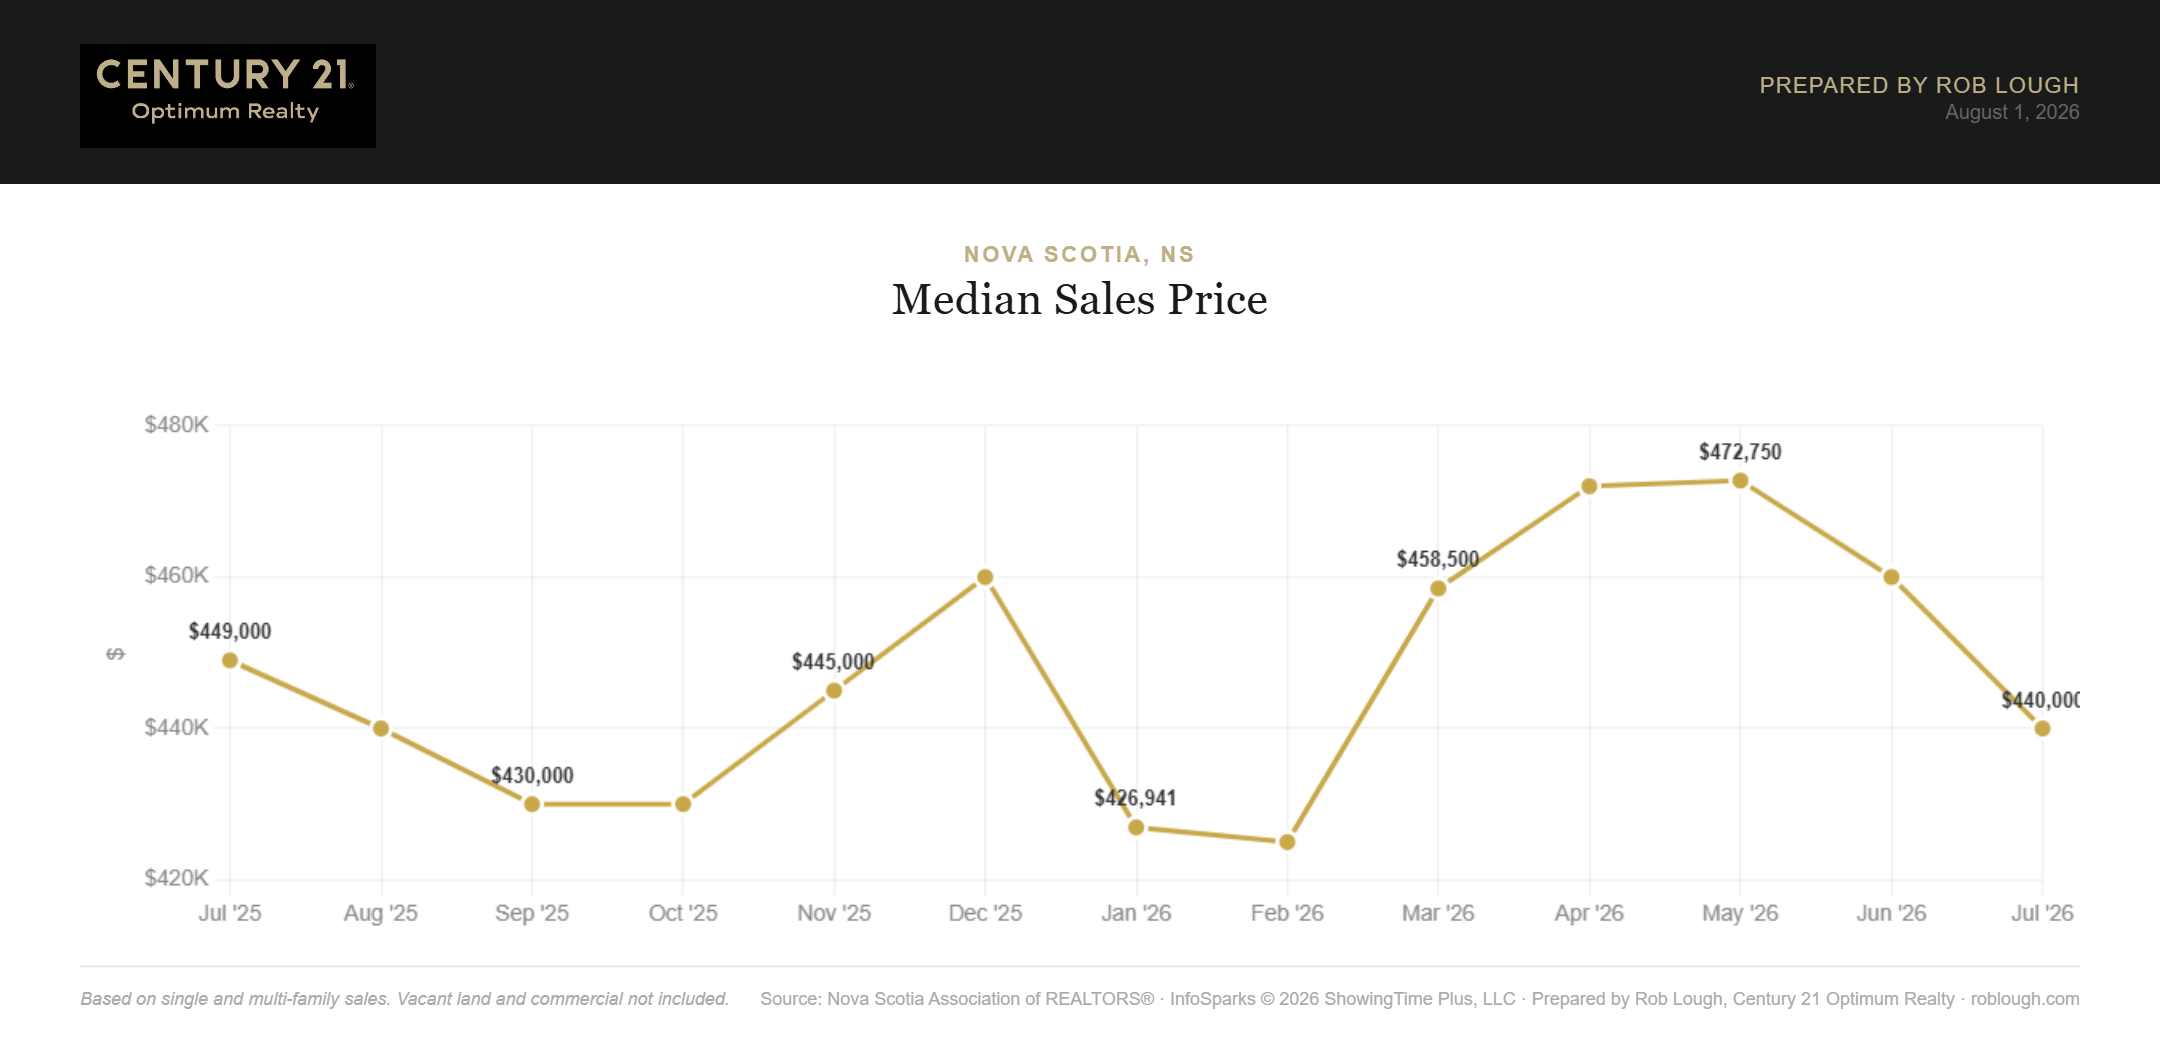
Nova Scotia Real Estate Market Statistics July 2026 Median Sales Price
Price Per Square Foot Holds Firm
While headline prices softened, price per square foot held steady. Average price per square foot on total living area was $281 in July, essentially unchanged from June’s $280 and up 2.6% from July 2025’s $274. On main living area, it came in at $355, down from June’s $362 but still 1.1% above a year ago.
This is a useful signal: on a per-foot basis, Nova Scotia values are not declining. The softer average and median prices reflect what’s selling, not a broad drop in what homes are worth.
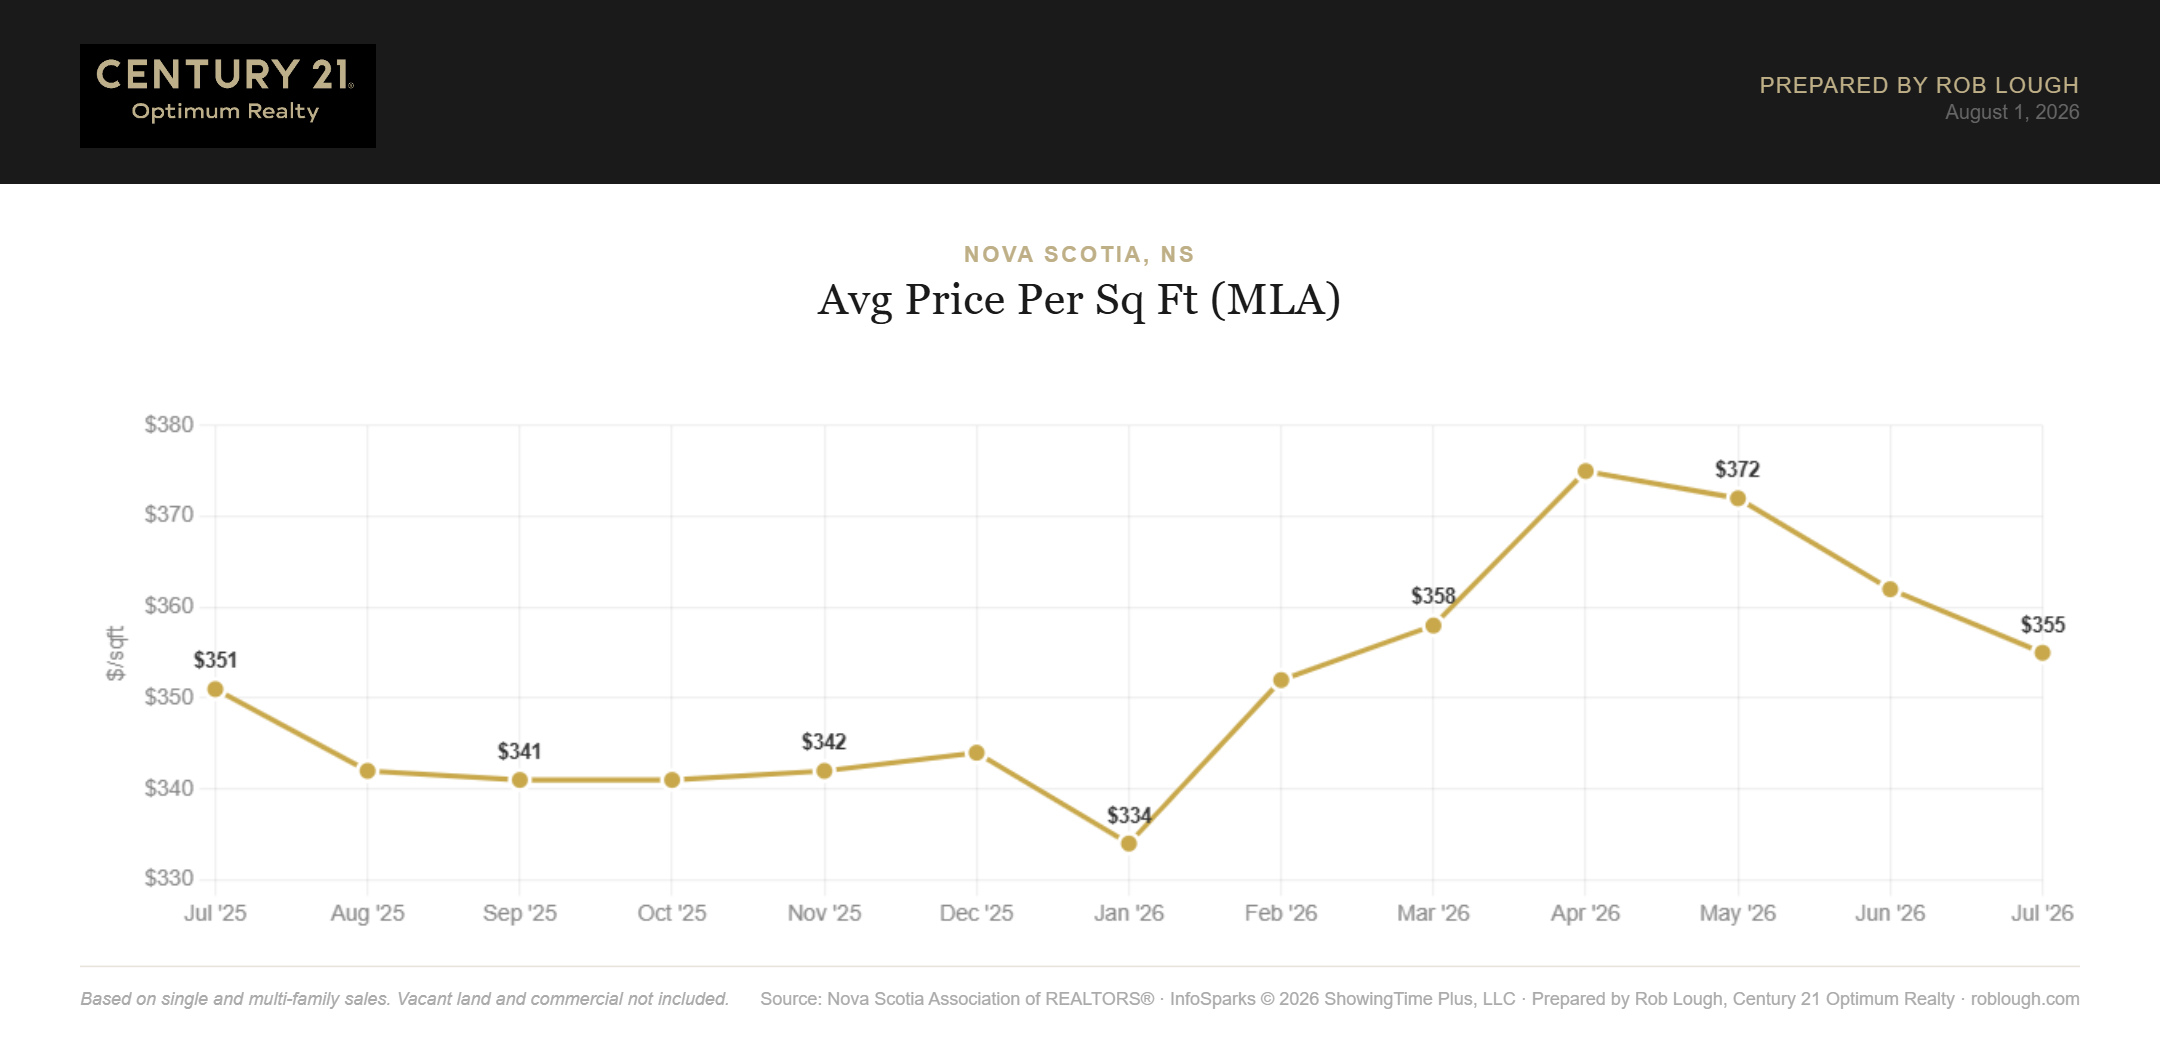
Nova Scotia Real Estate Market Statistics July 2026 Average Price per Square Foot
Dollar Volume of Closed Sales Reaches $470.8M
Total dollar volume of closed sales came in at $470.83 million in July 2026, down 13.3% from June’s $543.26 million and 6.6% below July 2025’s $503.94 million. June’s total was the strongest month in the trailing 13, so some pullback was expected — but the year-over-year gap points to a genuinely quieter summer than 2025.
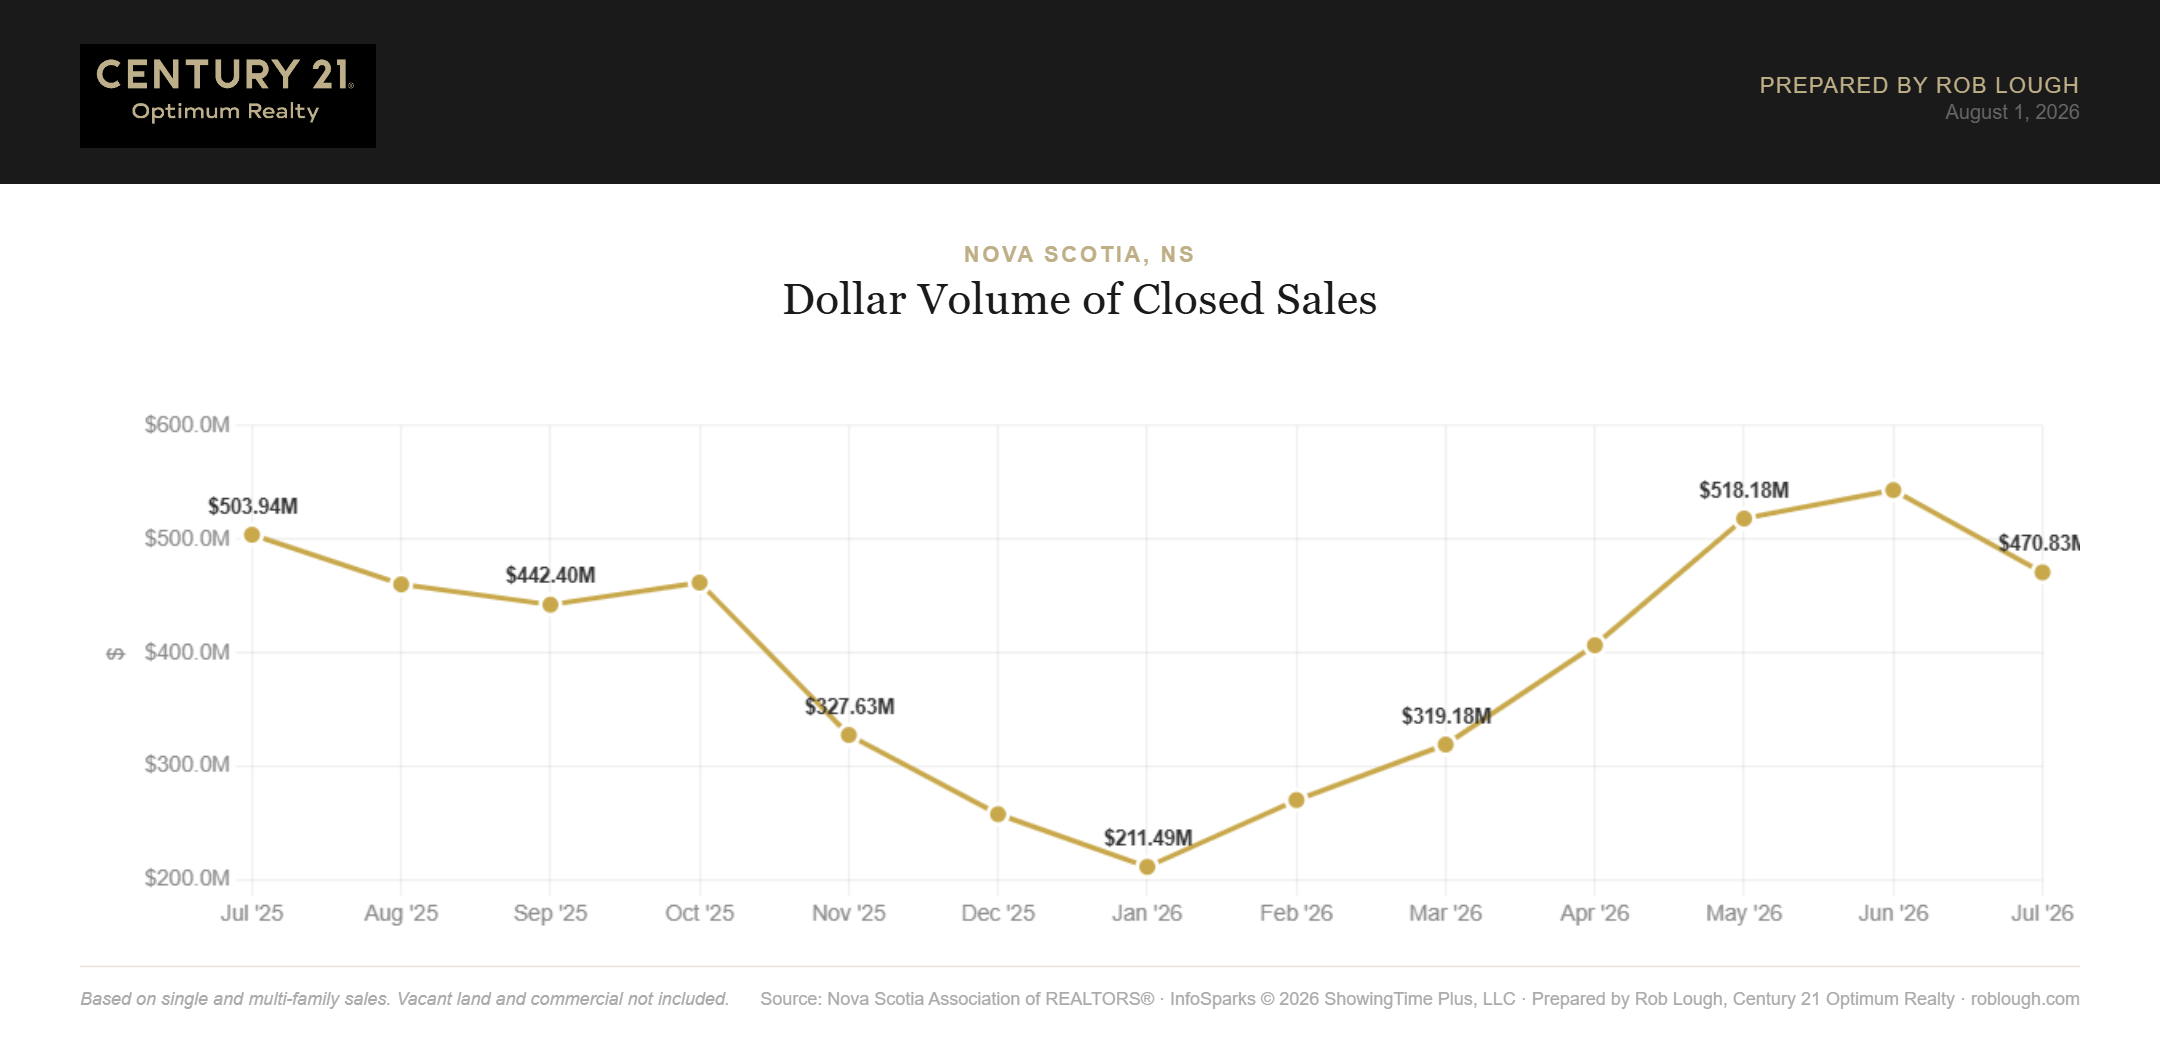
Nova Scotia Real Estate Market Statistics July 2026 Dollar Volume of Closed Sales
Homes Taking Slightly Longer to Sell: 46 Days
Average days on market rose to 46 in July 2026, up from 42 in June and six days slower than July 2025’s 40-day pace. Even so, 46 days remains among the faster readings of the past year — well ahead of the winter stretch when homes sat 57 to 73 days.
If your home has been sitting on the market, or you’re weighing when to list this summer, our agents at Century 21 Optimum Realty can review your pricing strategy to make sure you’re positioned to sell efficiently.
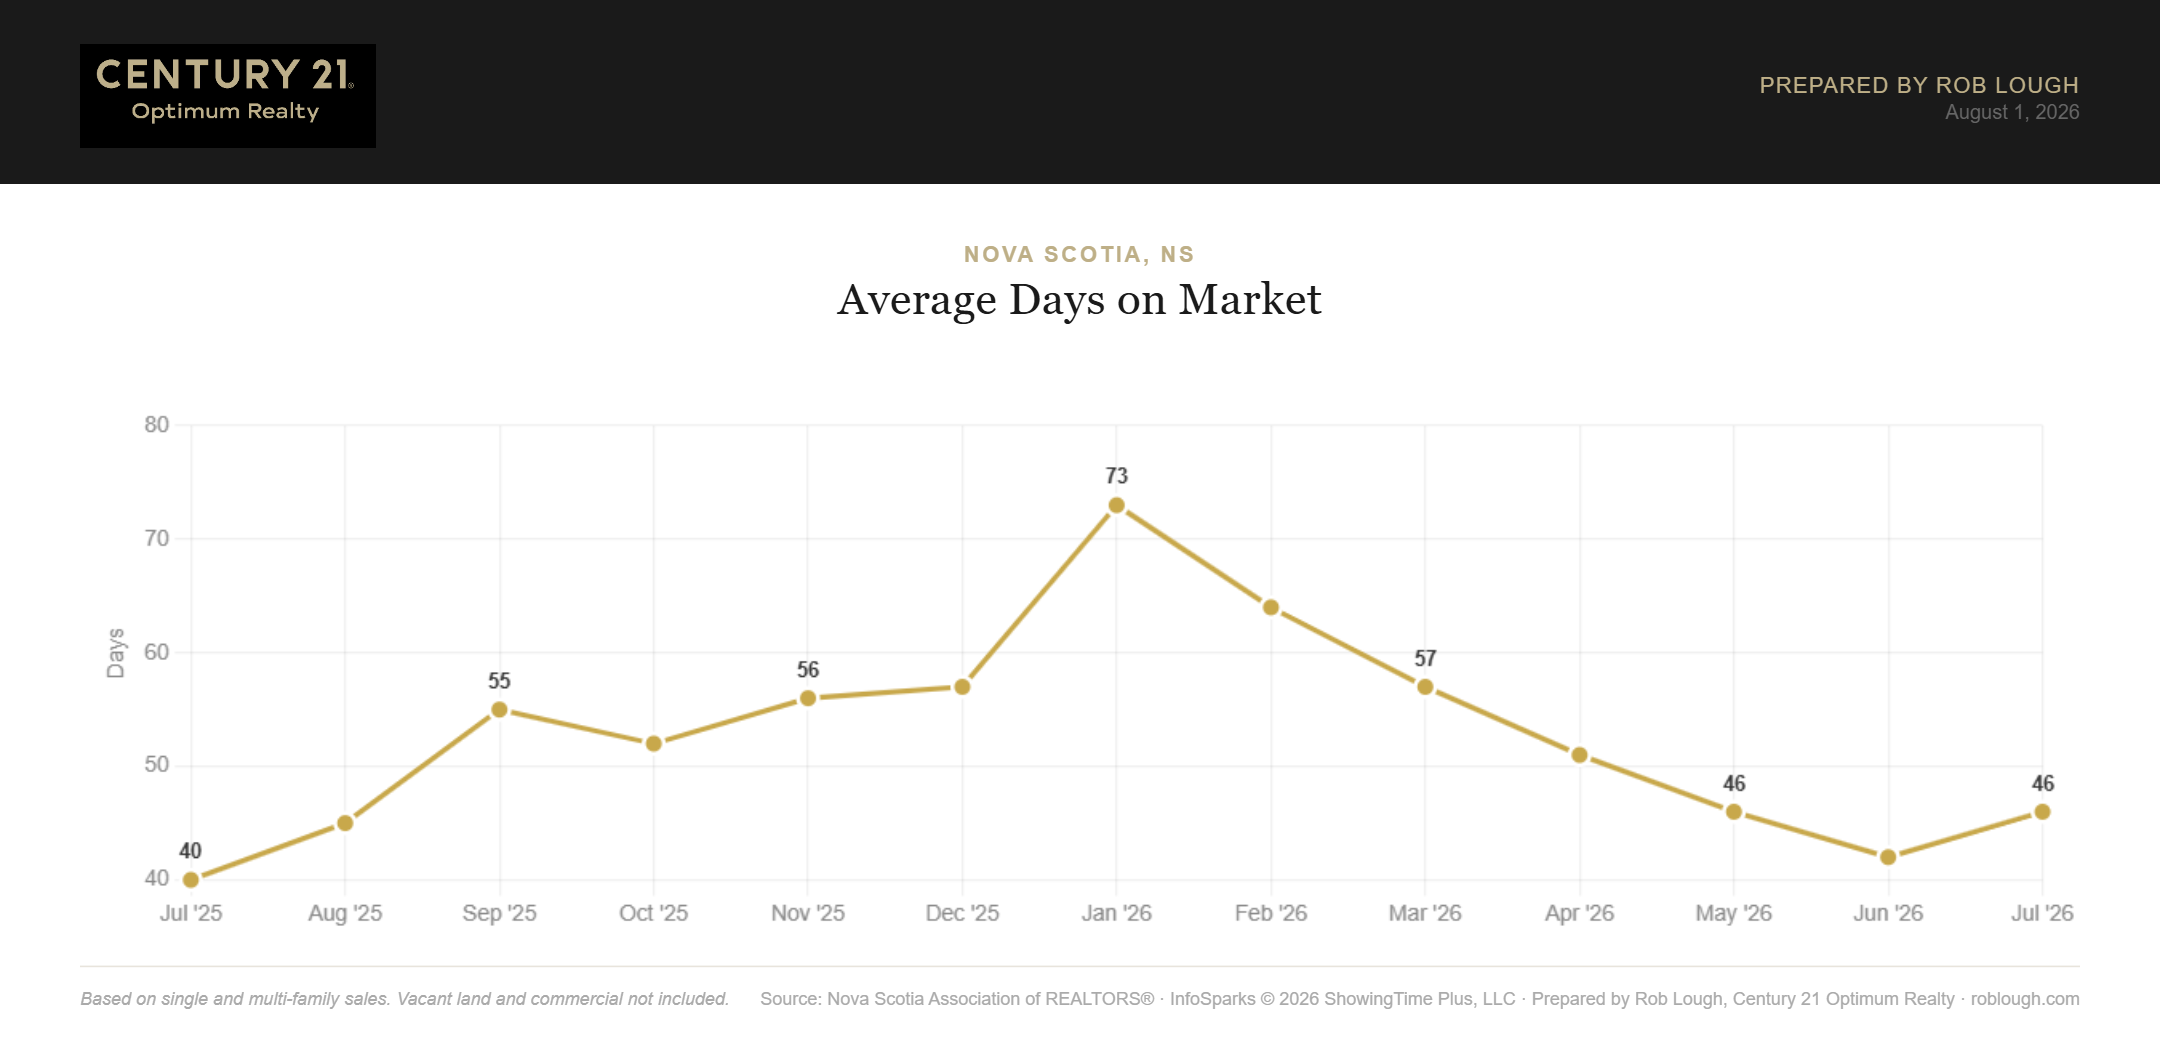
Nova Scotia Real Estate Market Statistics July 2026 Average number of days on market
Sale Price Ratios Keep Softening
The average sale-to-list price ratio eased to 97.1% in July, down from 97.2% in June and 97.7% a year ago — the lowest reading since February 2026.
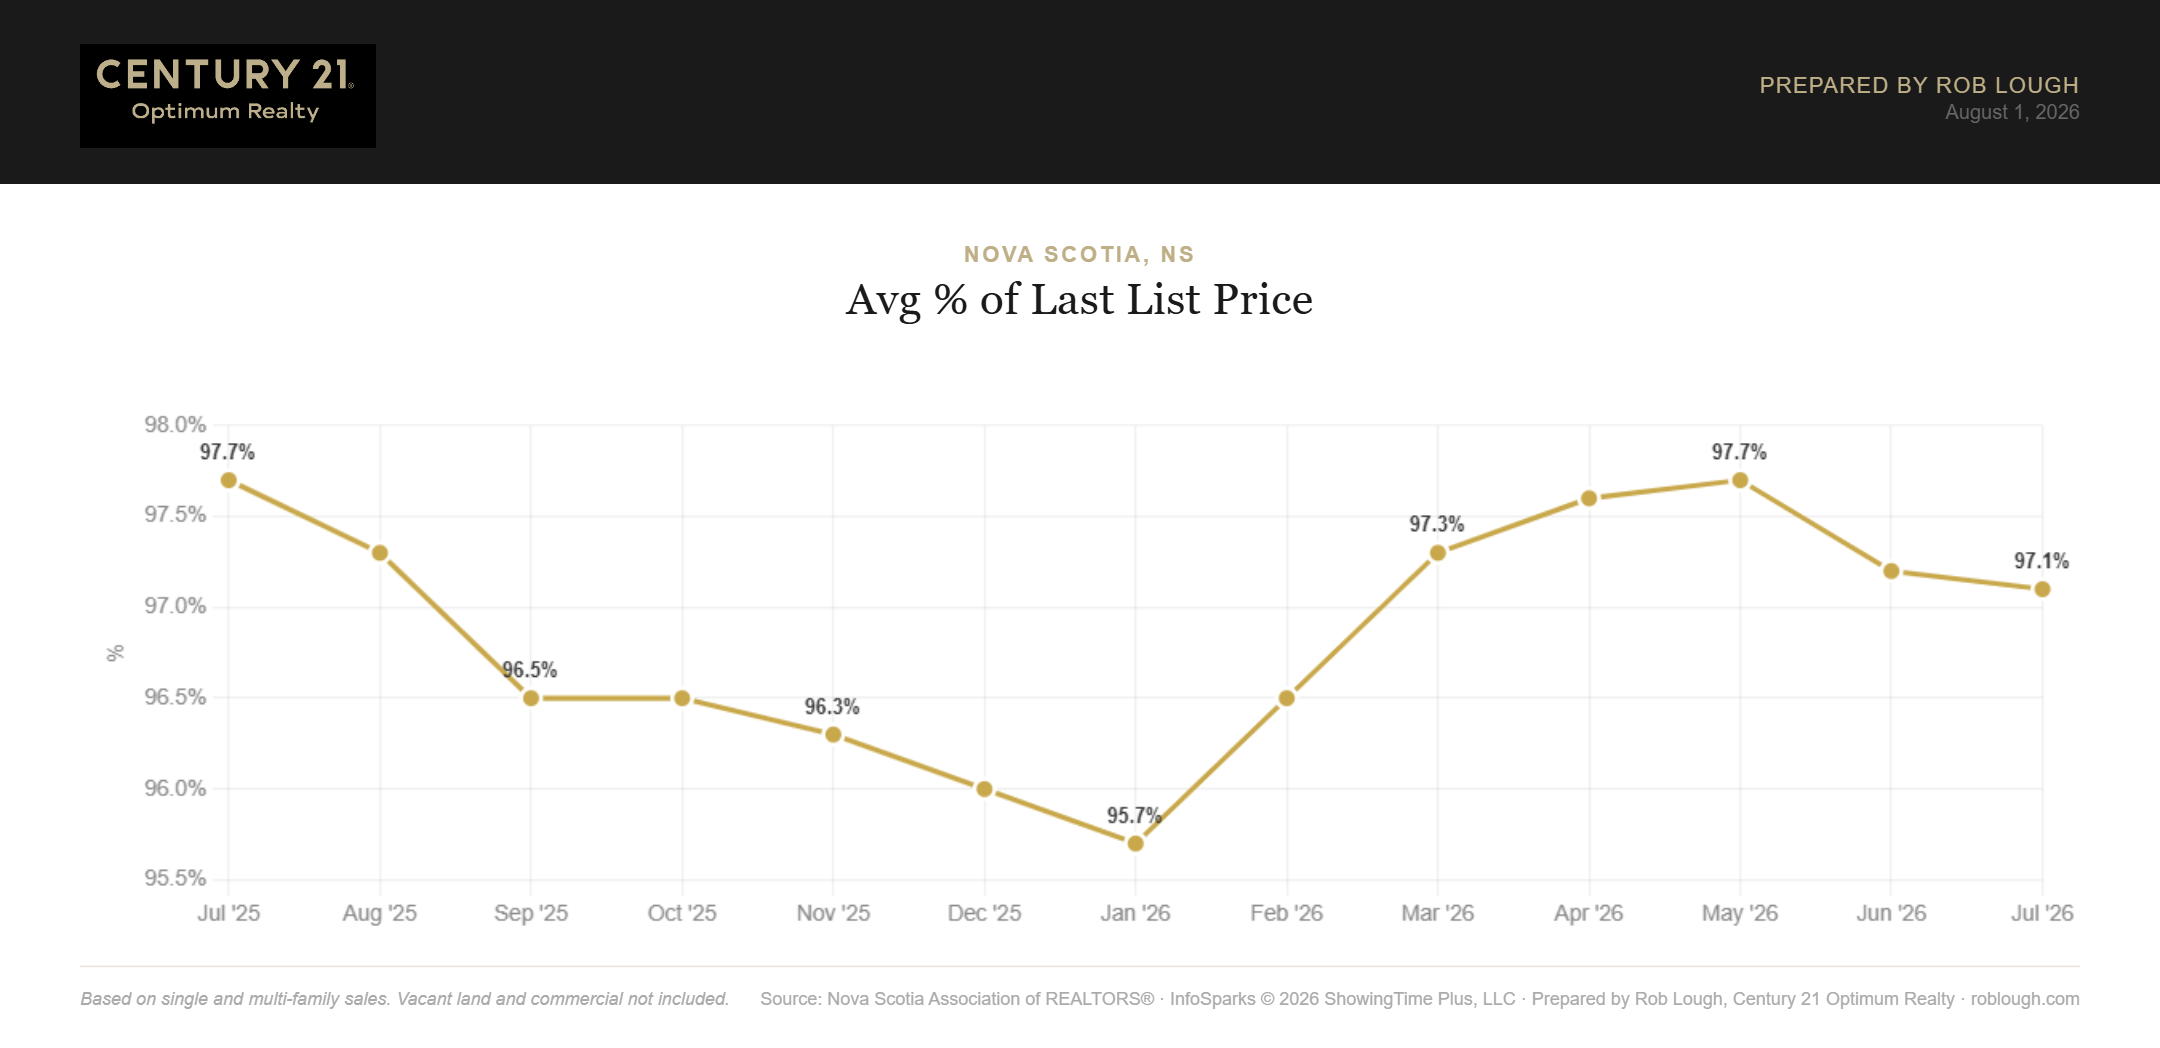
Nova Scotia Real Estate Market Statistics July 2026 Average % of last list price
The sale-to-original-list-price ratio fell further, to 94.8%, down from 95.3% in June and 95.7% in July 2025. The 2.3-point spread between the two ratios means more homes are seeing a price reduction before they sell, a clear indicator that initial pricing expectations are running ahead of what buyers will pay.
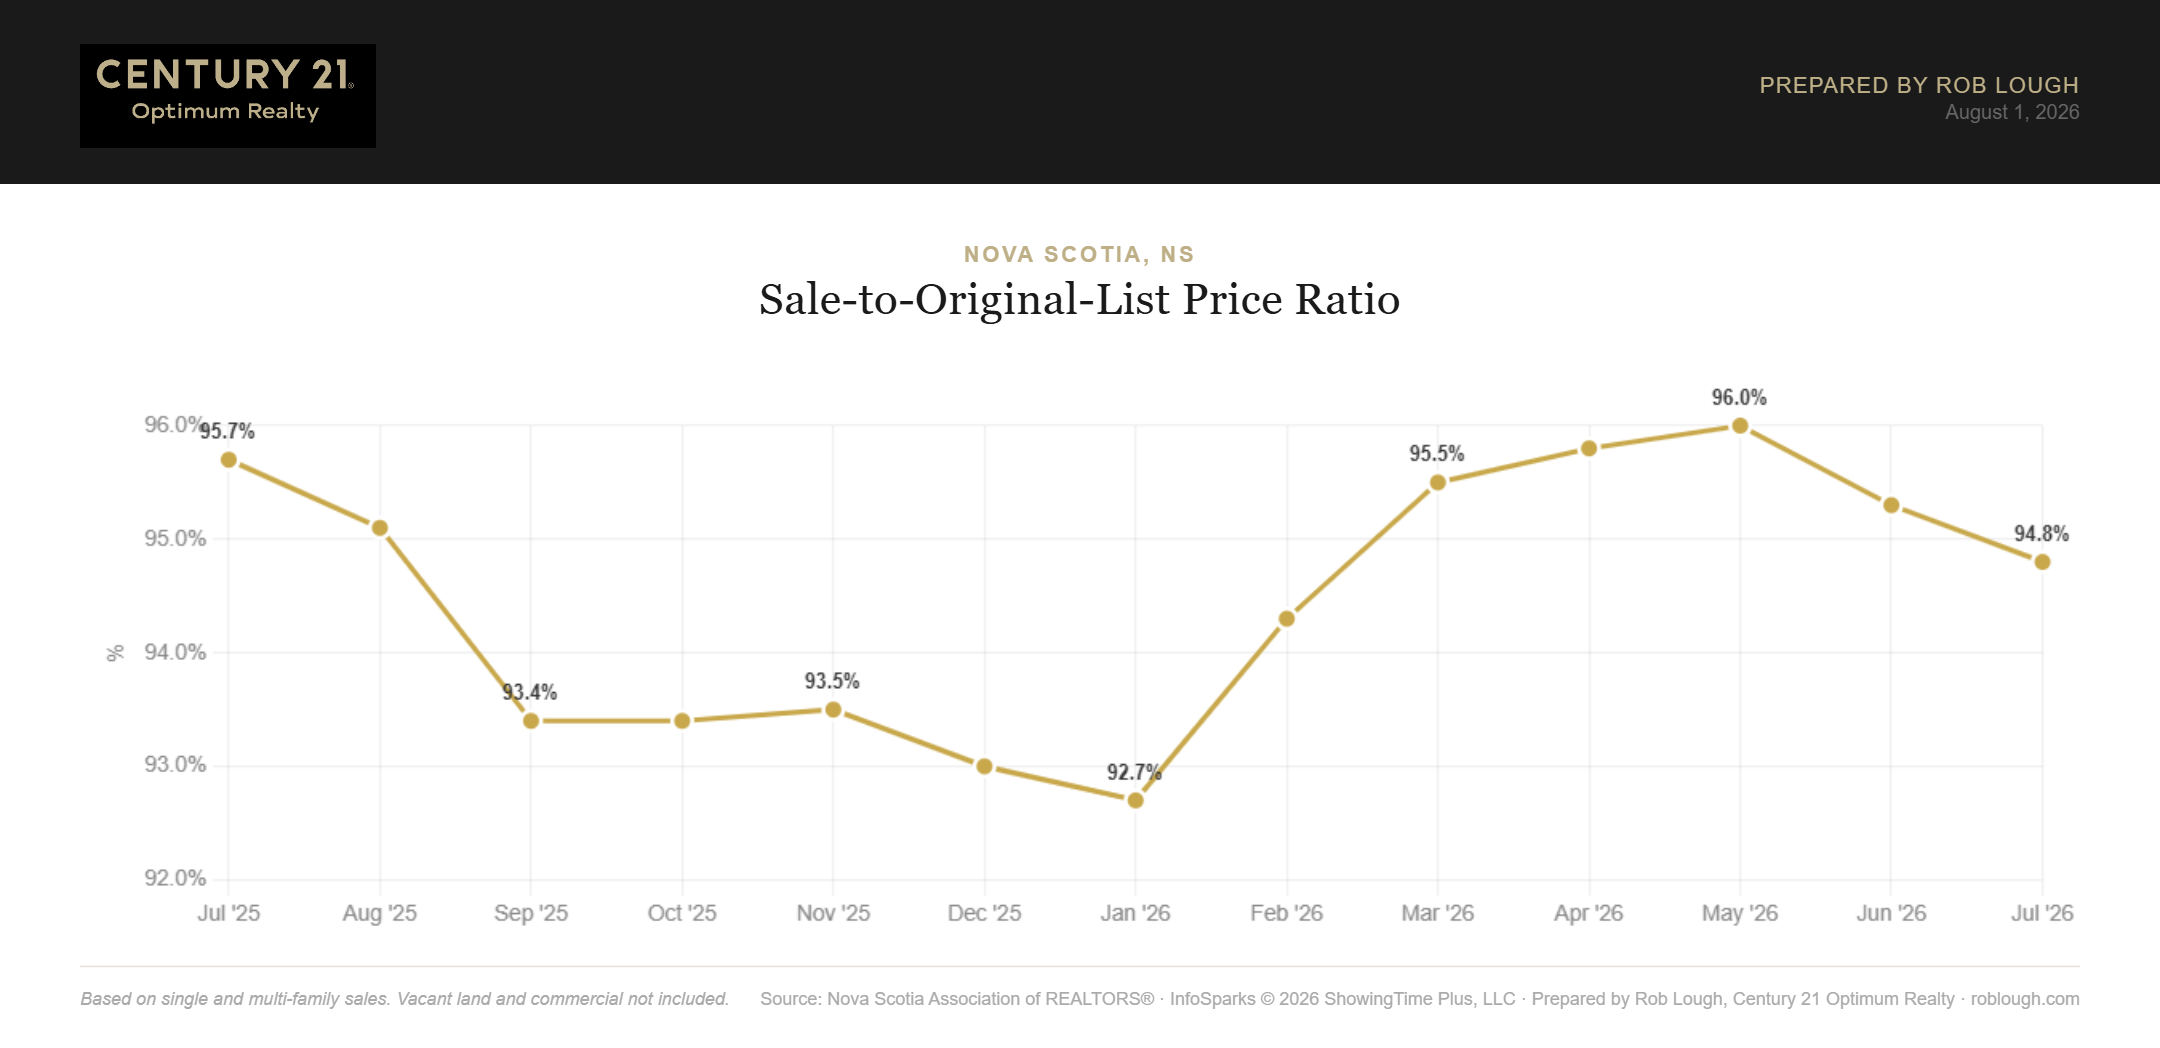
Nova Scotia Real Estate Market Statistics July 2026 Average % of original list price
Buyer Activity Cools, But Converts Efficiently
Showings per listing slipped to 3.7 in July, down from 3.8 in June and 4.0 in July 2025, a 7.5% year-over-year decline. With more listings competing for a similar pool of buyers, showing traffic per home is naturally thinner.
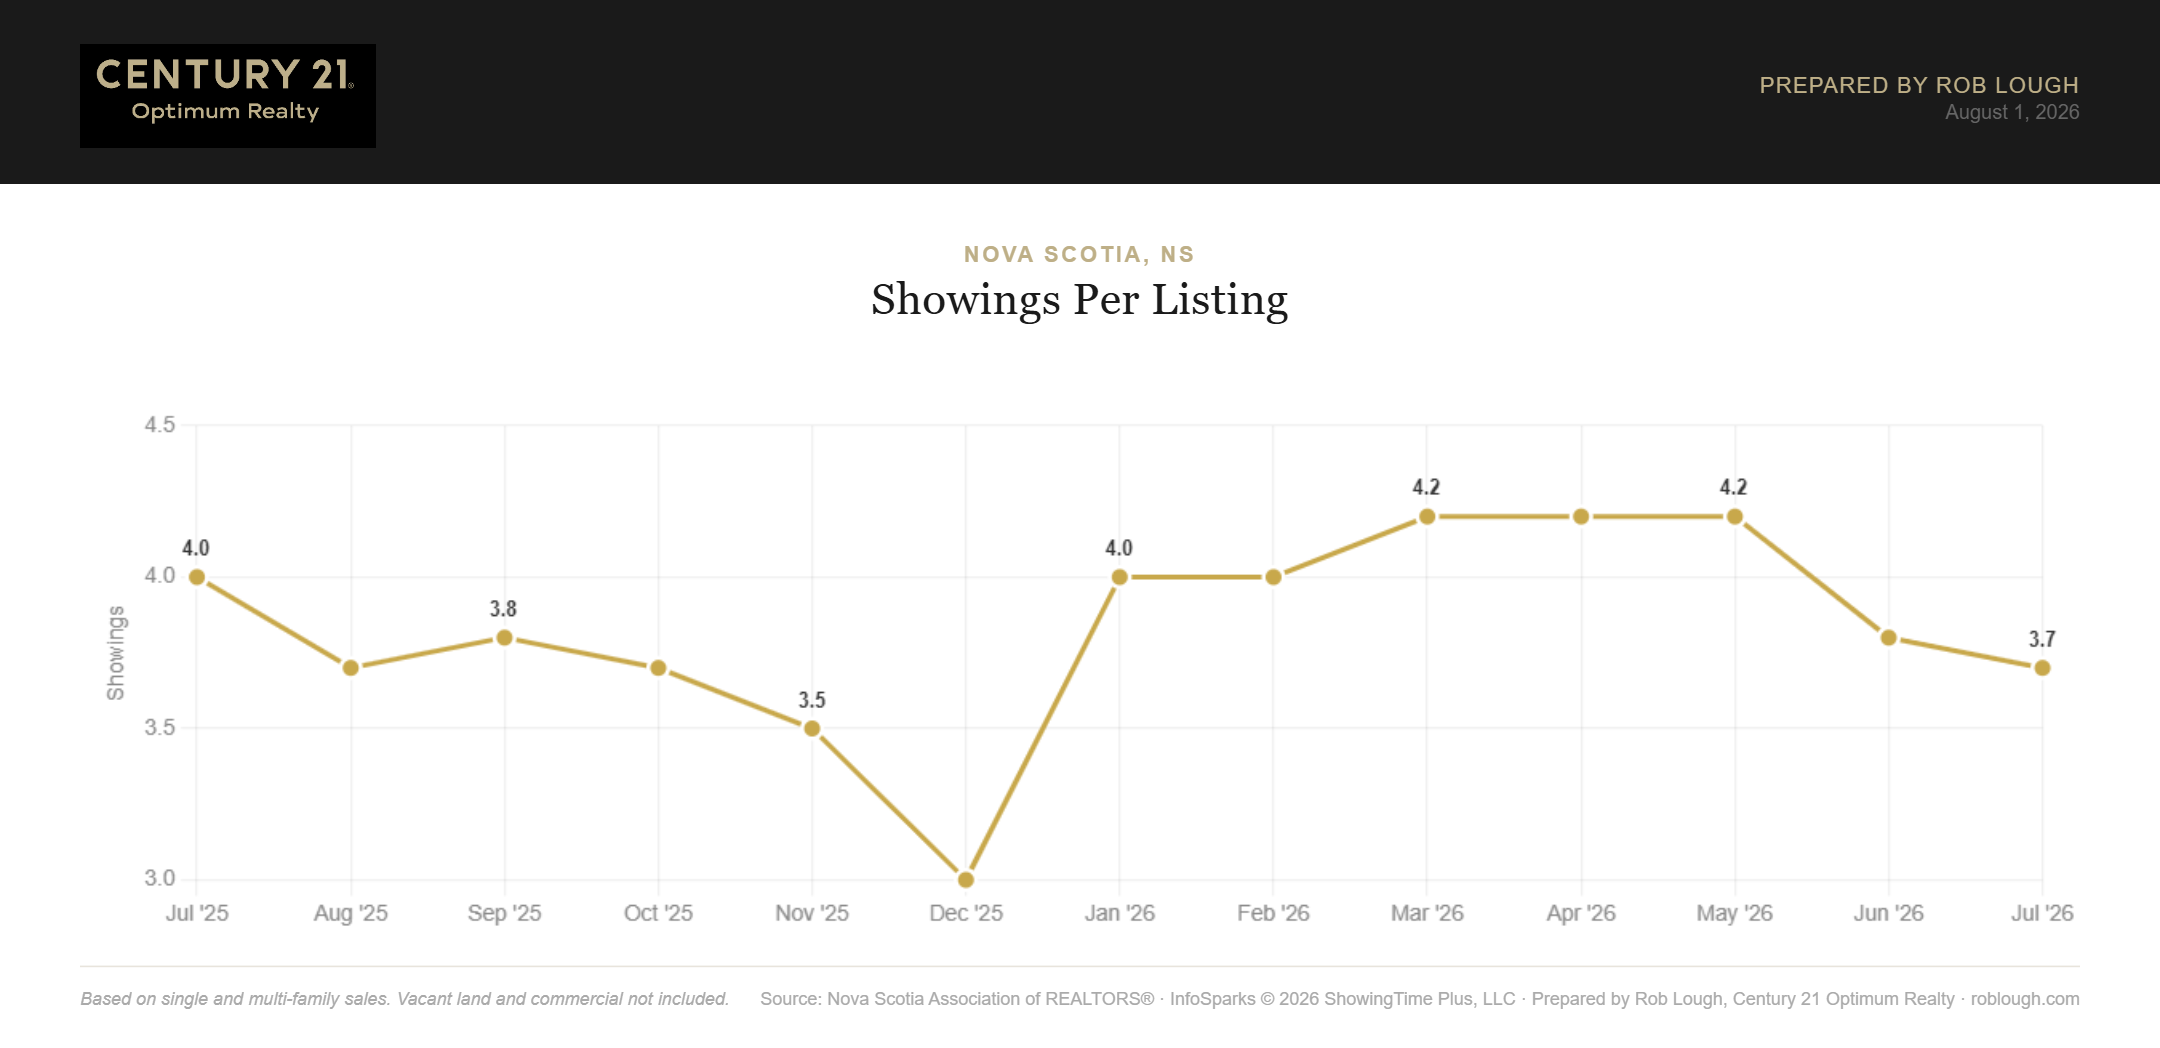
Nova Scotia Real Estate Market Statistics July 2026 number of showings per listing
The encouraging counterpoint: average showings to pending dropped to 8.3, down from 8.6 in June and 8.7 a year ago, the lowest reading in the trailing 13 months. Fewer showings are needed to produce a sale than at any point in the past year. Buyers who are out looking are serious and decisive.
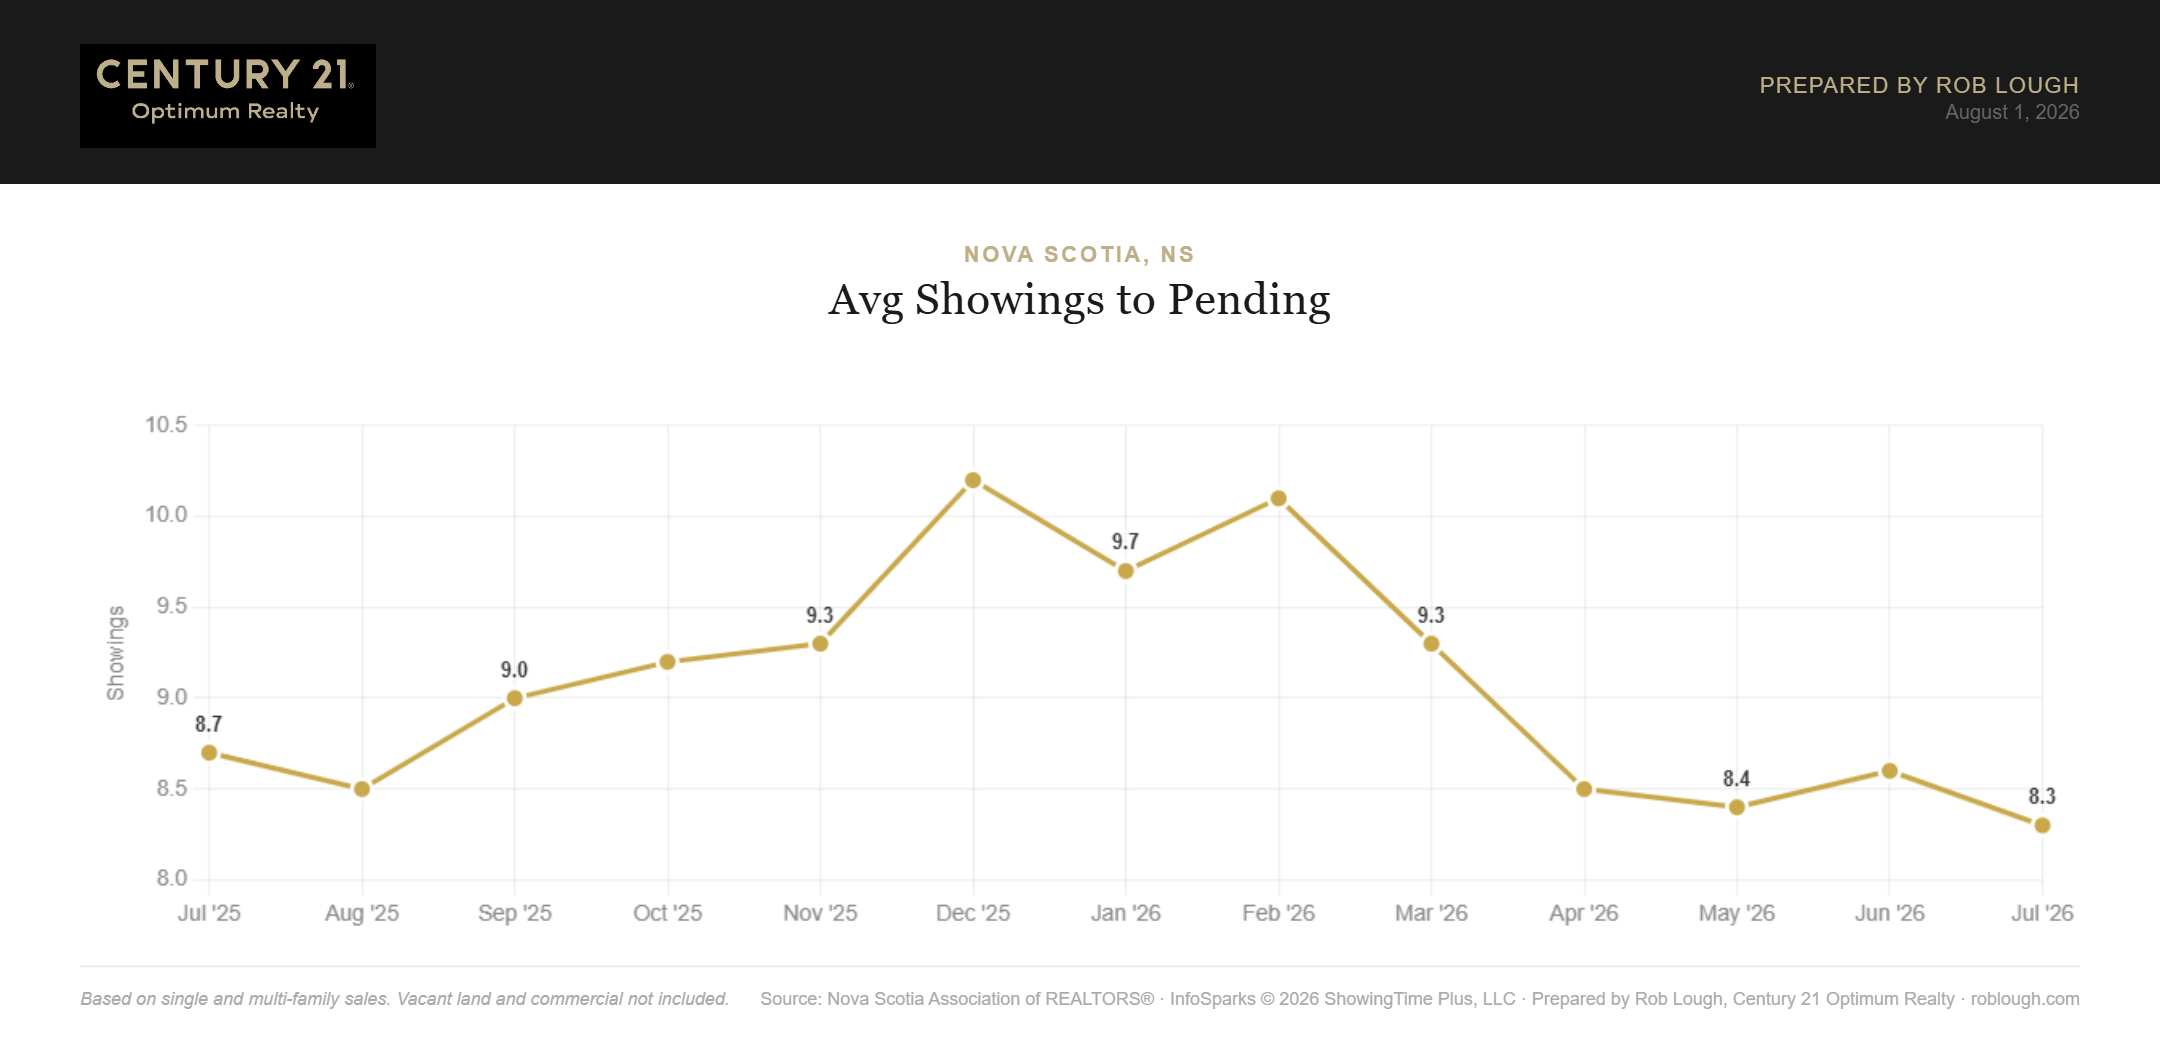
Nova Scotia Real Estate Market Statistics July 2026 average number of showings to pending
What This Means for Buyers and Sellers
For Buyers: This is the most buyer-friendly market Nova Scotia has seen in over a year. Months supply is at a 13-month high, sellers are accepting nearly 5% off original asking price on average, and you have time to look without the pressure of a bidding war. Browse current Nova Scotia listings with our team.
For Sellers: Per-square-foot values are still up year-over-year, and homes that show well are selling in under seven weeks with just 8.3 showings. But the widening gap between list and original-list ratios is the story of this market: overpriced homes are getting cut, and cut homes sell for less. Pricing correctly on day one is now the single biggest lever you control. Get a free market evaluation from Century 21 Optimum Realty.
Frequently Asked Questions
Is Nova Scotia a buyer’s or seller’s market in July 2026? With 5.5 months of supply, a 13-month high, up from 4.5 a year ago, Nova Scotia is approaching the 6-month threshold that typically defines a balanced market. Conditions are the most buyer-friendly they’ve been in over a year, though the province hasn’t fully crossed into buyer’s-market territory.
How much do homes sell for in Nova Scotia? The average sales price was $483,395 in July 2026, down 2.7% from June but up 1.0% from July 2025’s $478,574. The median sales price was $440,000, down 2.0% year-over-year.
How long does it take to sell a home in Nova Scotia? Homes averaged 46 days on market in July 2026, up from 42 days in June and six days slower than July 2025’s 40 days, still among the faster readings of the past 13 months.
Are Nova Scotia home prices falling? Not on a per-square-foot basis. Average price per square foot (total living area) was $281 in July 2026, up 2.6% from $274 a year ago. The softer average and median prices reflect a shift in the mix of homes selling rather than a broad decline in value.
Are buyers gaining negotiating power in Nova Scotia? Yes. The average sale-to-list price ratio slipped to 97.1% in July 2026 from 97.7% a year ago, and the sale-to-original-list ratio fell to 94.8% from 95.7%, meaning sellers are accepting more than 5% below their original asking price on average.
How many showings does it take to sell a home in Nova Scotia? An average of 8.3 showings per pending sale in July 2026, the lowest figure in the trailing 13 months and down from 8.7 a year ago. Buyer traffic is lighter but converts more efficiently.
About This Report
Data sourced from the Nova Scotia Association of REALTORS®. Based on single and multi-family residential sales. Vacant land and commercial properties are not included. Prepared by Rob Lough, Broker/Owner, Century 21 Optimum Realty, Halifax-Dartmouth, Nova Scotia. Curious about the Halifax/Dartmouth Market Stats? Are you a condo owner and want to know about the Halifax Dartmouth Condo Market Report?

