
 Facebook
 X
X
 Pinterest
 Copy Link
Nova Scotia Real Estate Market Stats April 2026: More Inventory, Longer Days, Prices Holding
By Rob Lough, Broker/Owner, Century 21 Optimum Realty Published May 2026 | Data: Nova Scotia Association of REALTORS
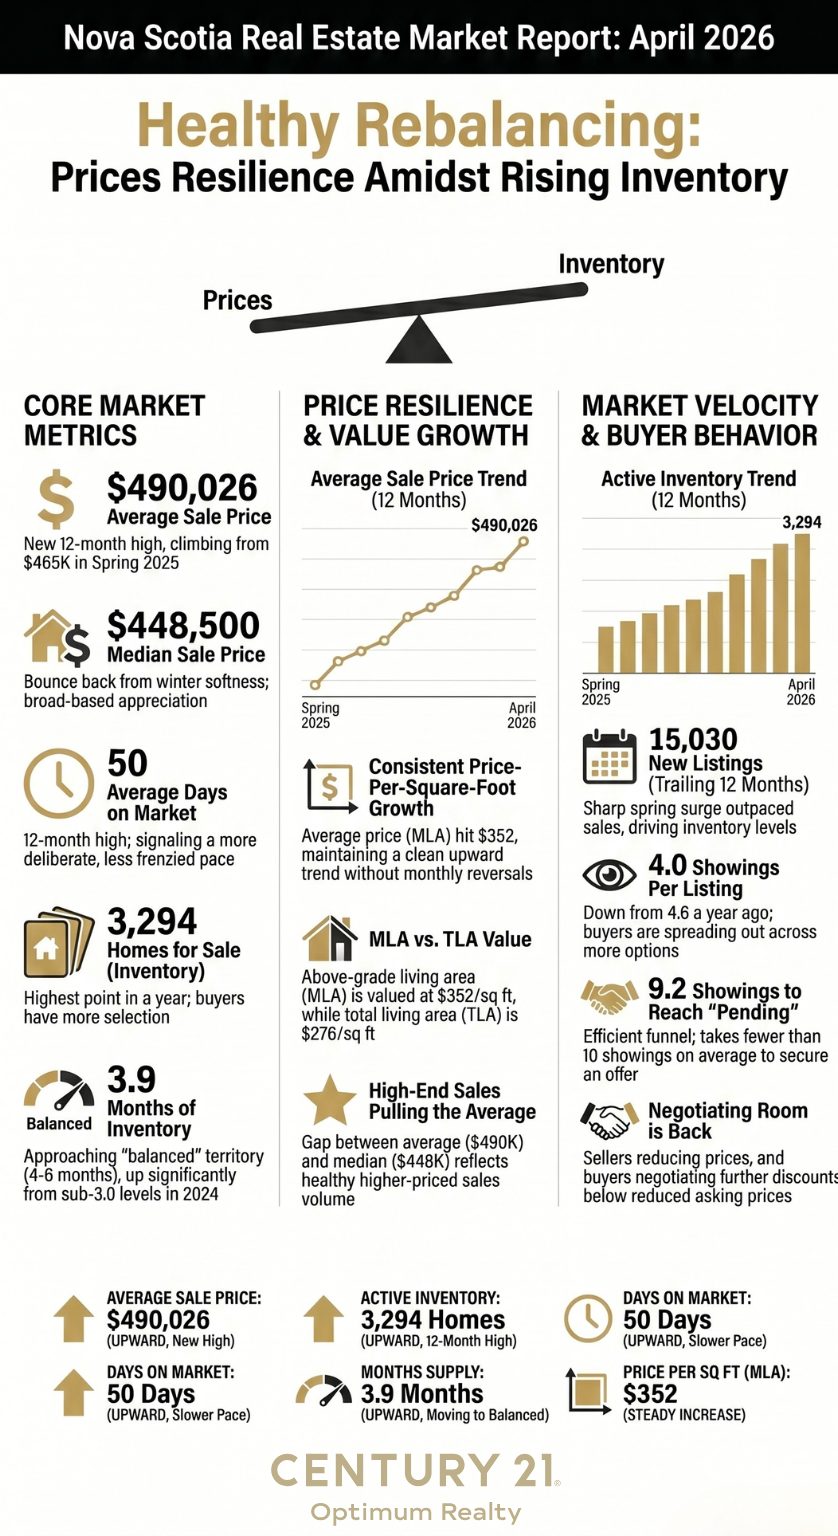
April’s numbers are in, and they continue the story that has been building since the summer of 2025: Nova Scotia’s real estate market is carrying more inventory, taking longer to sell homes, and giving buyers measurably more negotiating room than they had eighteen months ago. Prices, however, are holding, and in some key measures, still climbing.
The average sale price across Nova Scotia reached $490,026 in April 2026. The median came in at $448,500. Neither figure signals a market in retreat. What the full dataset shows is a market that has rebalanced after the extraordinary run-up of the pandemic years, and it is behaving the way a healthy market should: more selection for buyers, more discipline required from sellers, and a genuine window of opportunity for patient investors.
This is our most comprehensive monthly report to date, covering 15 data metrics from the Nova Scotia Association of REALTORS. Here is what each one is telling us. A note on trailing 12-month data: Several of the metrics below are presented as trailing 12-month figures. This means the number reflects the cumulative or rolling total of the most recent 12 months ending in April 2026, rather than April alone. Trailing 12-month data smooths out seasonal swings and gives a more reliable picture of underlying market direction than any single month can. When you see a trailing figure rising or falling, it reflects a genuine trend, not a one-month blip. Point-in-time metrics like average price, days on market, and price per square foot reflect current conditions only and are labeled accordingly.
For context behind these trends, our Nova Scotia Real Estate Market Stats March 2026 and Spring 2026 Nova Scotia Real Estate overview cover the ground leading into this month.
Average Sales Price: $490,026
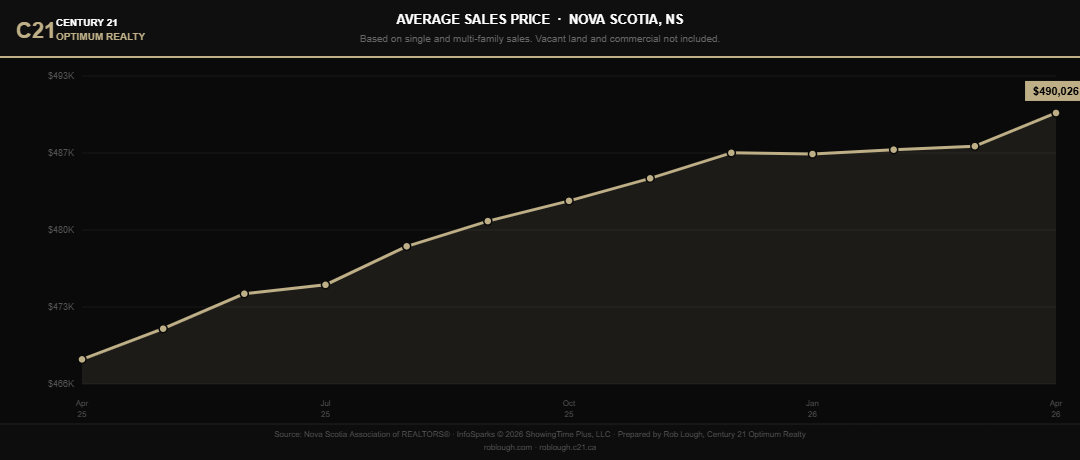
Nova Scotia Market Stats April 2026 Average Sales Price
The average sale price hit $490,026 in April 2026, a new high in the trailing 12-month dataset and a meaningful jump from the $486K to $487K range that held through the winter months. The upward trend in average price has been remarkably consistent, climbing from approximately $465K in spring 2025 to today’s reading without any sustained reversal.
It is worth distinguishing average from median here. The average is pulled upward by higher-end sales; the median at $448,500 reflects the midpoint of all transactions. Both figures matter. Together they confirm that price appreciation is not limited to a narrow luxury segment. The market is broadly holding value.
For Buyers: The average price crossing $490K means your borrowing capacity and purchase budget need to be stress-tested against today’s market, not last year’s. Get pre-approved and know exactly what you qualify for before you start seriously shopping. At these price points, the difference between a well-structured offer and a reactive one is real money.
For Sellers: An average sale price approaching $490K is a strong market signal. Your equity position is significant. The discipline required now is not finding buyers willing to pay, it is pricing accurately enough to attract them in a timely way. Sellers who chase the average without supporting comparables are leaving days on market, not dollars, on the table.
For Investors: Average prices near $490K set a high bar for cash-flow acquisition in the traditional residential space. Run your gross rent multiplier and cap rate calculations carefully. The appreciation story, however, remains intact. The consistent upward climb in average price over the trailing year confirms that Nova Scotia residential real estate continues to build value over time.
Median Sales Price: $448,500
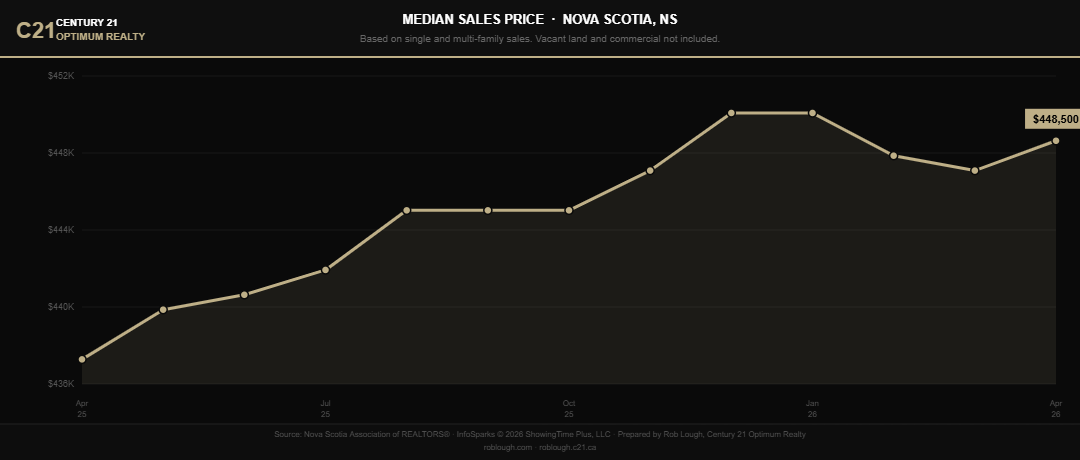
Nova Scotia Market Stats April 2026 Median Sales Price
The median came in at $448,500 for April, bouncing back from the late-winter softness documented in our Nova Scotia Real Estate Market Stats February 2026 report and consistent with the spring recovery we flagged in March. The median peaked around $451K in January 2026 before seasonal compression pulled it down through February, and it has since recovered.
The gap between average ($490K) and median ($448,500) tells its own story. It reflects a healthy spread of property types transacting across the province, with a meaningful volume of higher-priced homes pulling the average above the midpoint.
For Buyers: The median is your most useful reference point when sizing up what the market looks like at the middle of the price distribution. If your budget sits around $448K, you are competing in the heart of the Nova Scotia market, not on the fringe.
For Sellers: If your property falls between the median and average, you are in a well-trafficked part of the market. Buyers exist at your price point. The question is whether your property is positioned to attract them relative to the other options currently available at similar prices.
For Investors: The spread between median and average creates opportunity in both directions. Properties below the median may offer value-add potential in underserved segments. Properties near the average are easier to refinance against if you need to access equity later.
Average Days on Market: 50 Days
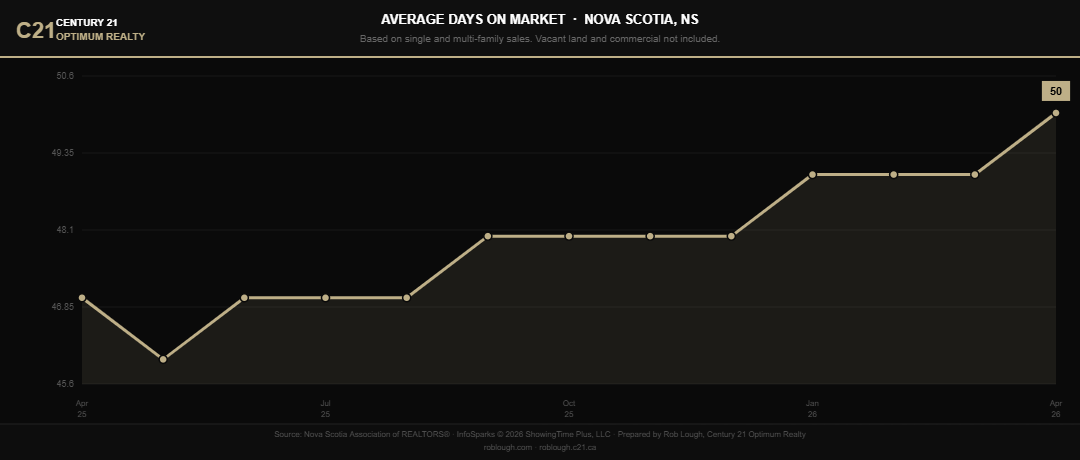
Nova Scotia Market Stats April 2026 Average Days on Market
Average days on market reached 50 days in April, the highest point in the trailing 12-month dataset, continuing the steady climb from the summer 2025 low of approximately 45 days. As we outlined in our Nova Scotia Real Estate Market Stats January 2026 report, this trend has been in place for nearly a year.
It is worth keeping perspective. As our Ten Years of Nova Scotia Real Estate in Five Key Charts documents, pre-pandemic days on market routinely ran in the 60 to 90 day range. Fifty days is not alarming by historical standards. What it confirms is that the frenzied 28 to 30 day turnarounds of 2021 and 2022 are well behind us, and sellers who price as though those conditions still exist are finding that out the hard way.
For Buyers: Fifty days on average means you have time to think. You can book a second showing, bring in your home inspector, and review your financing without feeling like the property will be gone tomorrow. Use that breathing room strategically rather than rushing into a decision.
For Sellers: Overpriced listings are sitting longest. If your property has been on the market beyond the 50-day average with few showings and no offers, the market is giving you clear feedback on price or presentation. Acting on that feedback early saves carrying costs and emotional energy. Reductions after 60-plus days generate less momentum than accurate pricing from day one.
For Investors: Longer days on market expand your window to negotiate and conduct thorough due diligence. Income properties that have been sitting are worth a closer look, particularly if the listing agent can speak to showing history and any price adjustment timeline. Patience is an asset in this environment.
Total Sales: 9,724 (Trailing 12 Months)
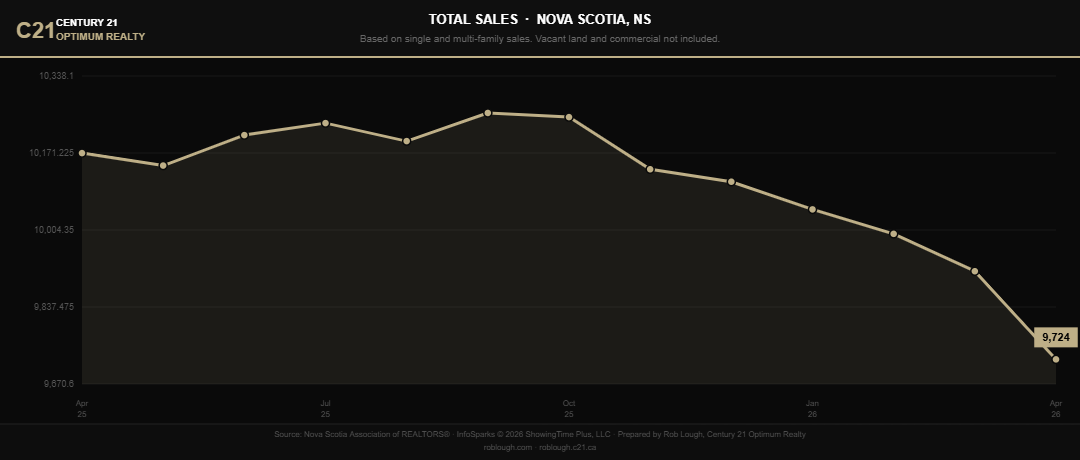
Nova Scotia Market Stats April 2026 Total dollar volume
The trailing 12-month sales count fell to 9,724, continuing a steady decline from the 10,200-plus readings of mid-2025. Transaction volume has been compressing consistently, reflecting both higher carrying costs for move-up buyers and a more cautious buyer pool than we saw during the peak activity period.
This is not a collapse in demand. As the Five Years of Nova Scotia Real Estate Market Analysis shows, sustainable annual volumes for this province sit in the 10,000 to 11,000 range. We are approaching that normalized floor, not falling through it.
For Buyers: Fewer transactions means fewer competing buyers in the room with you on any given property. The bidding war environment that defined 2021 through early 2024 has largely passed. You may still encounter multiple offers on a well-priced, well-presented home, but it is no longer the default condition across the market.
For Sellers: Lower transaction volume means your listing needs to work harder to attract the buyers who are actively in the market. This is not the environment to test pricing above comparable sales and wait for the market to catch up. The buyers transacting right now are informed, deliberate, and comparing carefully.
For Investors: Declining unit volume can sometimes signal a buying window, particularly when prices are stable. Motivated sellers who need to move are more likely to negotiate seriously in a lower-volume market than they were when every listing generated immediate multiple offers.
Pending Sales: 9,779 (Trailing 12 Months)
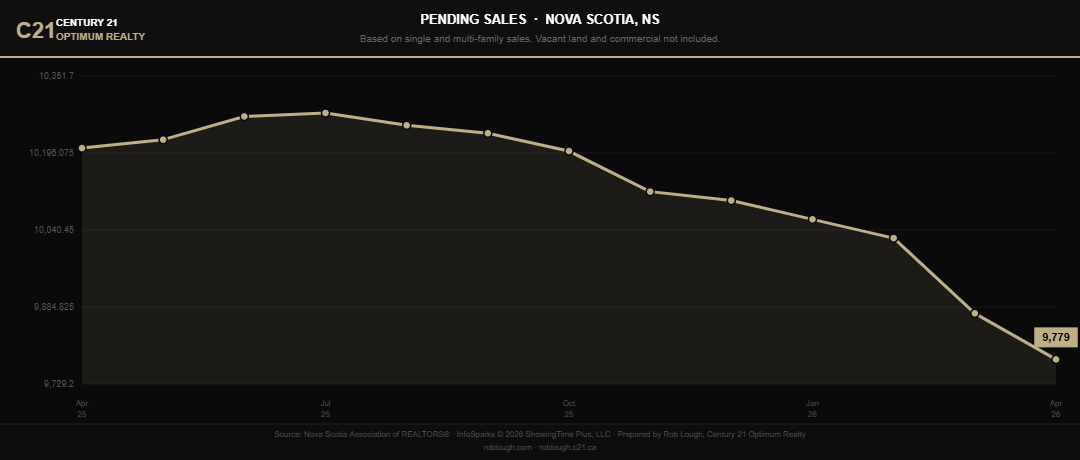
Nova Scotia Market Stats April 2026 number of pending sales
Pending sales came in at 9,779 on a trailing 12-month basis, down from the 10,200-plus readings of summer 2025 and continuing the same compression pattern as total closed sales. Pending sales are a leading indicator: they represent homes that have accepted offers but not yet closed, so today’s pending count previews next month’s closed sales figures.
The fact that pending sales (9,779) are slightly higher than total closed sales (9,724) is actually a modest positive signal. It suggests the pipeline is not thinning further and that the current pace of buyer activity should sustain closed volumes at roughly this level in the near term.
For Buyers: A relatively stable pending count means you are not stepping into a market that is either seizing up or suddenly surging. Conditions are consistent. Offers are being made and accepted. The market is functioning.
For Sellers: The pending count tells you that buyers are writing offers. If your property is not generating offer interest after adequate market exposure, the feedback is specific to your listing, not a sign that the market has stopped moving.
For Investors: Pending sales tracking close to closed sales volume is a liquidity indicator. Properties that are well-priced and in good condition are still finding buyers. Your exit strategy on any acquisition remains viable in this environment.
New Listings: 15,030 (Trailing 12 Months)
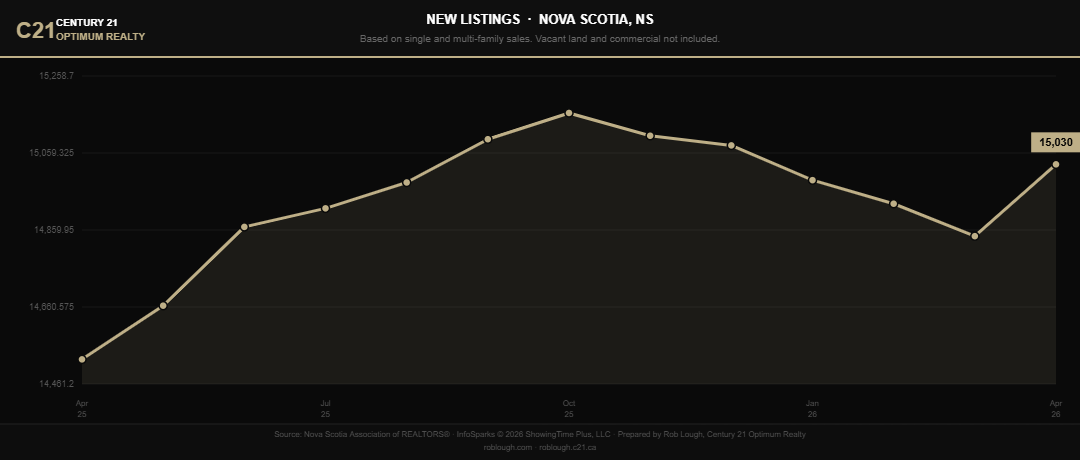
Nova Scotia Market Stats April 2026 number of new listings
New listings rebounded sharply in April to a trailing 12-month total of 15,030, the highest reading since the October 2025 peak. That spring surge in seller activity is exactly what we would expect at this time of year, and it is bringing meaningful new product to market just as buyer foot traffic picks up.
The math here is important. With 15,030 new listings entering the market and only 9,724 closed sales, the province is generating significantly more inventory than it is absorbing. That gap is the structural reason supply is building and months supply is rising.
For Buyers: The spring listing surge is working in your favour. More inventory means more selection, more comparison opportunities, and more room to walk away from a property that does not meet your criteria and find another one. For more on what buyer motivation looks like right now provincially, see The Homeownership Dream Is Still Alive in Nova Scotia.
For Sellers: You are listing into a market with more competition than existed a year ago. Your property needs to stand out. Professional photography, a clean and decluttered presentation, and accurate pricing are not optional extras in April 2026. They are the baseline for generating showings.
For Investors: Rising new listings create short-term buying opportunities, particularly for properties that come to market overpriced and then reduce within 30 to 45 days. Setting up saved searches and acting quickly on price-adjusted listings that meet your criteria is a practical strategy right now.
Homes for Sale (Inventory): 3,294
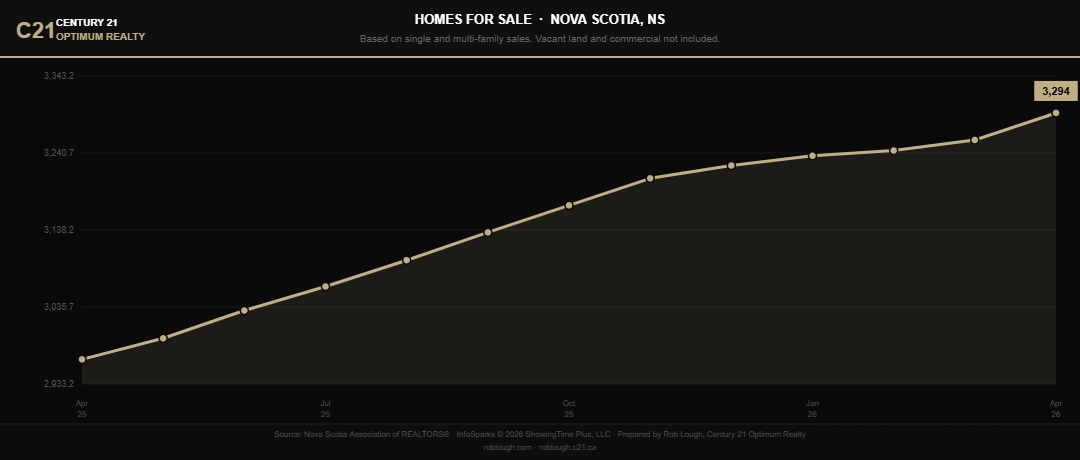
Nova Scotia Market Stats April 2026 number of homes for sale
Active inventory reached 3,294 homes, the highest point in the full trailing year and a consistent upward climb from the 2,960-ish levels of spring 2025. More homes on the market is a structural shift that buyers have been waiting on for years. This is still not a traditional buyers’ market, but it is meaningfully more balanced than anything seen during the pandemic period.
For Buyers: More inventory means more choices and less desperation. You can be selective. If a home has a feature that concerns you or a price that feels stretched, there is another listing worth considering. That was simply not true in 2022.
For Sellers: You are no longer the only house on the block. Buyers browsing listings today have real alternatives. Anything that makes your home less competitive, whether deferred maintenance, dated presentation, or an aspirational price, will push buyers toward the next property on their list.
For Investors: Higher inventory levels historically correlate with better acquisition conditions for patient buyers. Set your criteria and let the market come to you. With 3,294 active listings to monitor, the opportunity cost of waiting for the right deal is low.
Months Supply of Homes for Sale: 3.9 Months
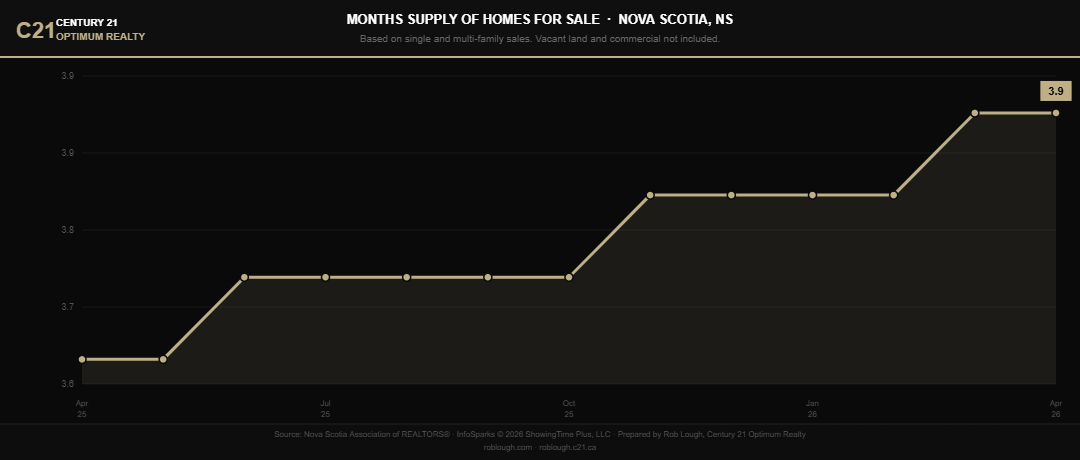
Nova Scotia Market Stats April 2026 months of inventory supply
Months supply came in at 3.9, up significantly from the 3.6 readings of earlier this year and dramatically above the sub-3.0 levels that defined the frenzied market of 2023 and 2024. The standard threshold for a balanced market is 4 to 6 months. Nova Scotia is knocking on that door.
For Buyers: At 3.9 months, you are operating in a near-balanced market. You have leverage you did not have eighteen months ago, without being in a situation where sellers are desperate. Negotiate with confidence on price and conditions, but do not assume every seller will capitulate. Well-priced homes are still attracting serious interest.
For Sellers: You are not in a buyers’ market yet, but the trend line is moving in that direction. Sellers who price accurately and list while spring momentum is at its peak will be better positioned than those who wait until fall when months supply typically climbs further.
For Investors: Months supply approaching the balanced threshold is often where experienced investors become more active. There is enough inventory to be selective, enough motivated sellers to negotiate, and enough price stability to underwrite acquisitions with reasonable confidence in exit values.
Dollar Volume of Closed Sales: $4.76 Billion (Trailing 12 Months)
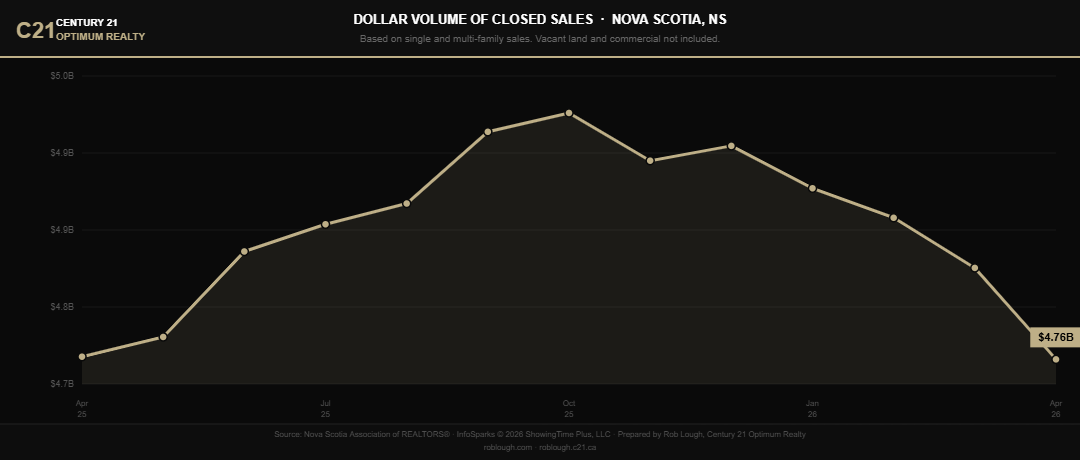
Nova Scotia Market Stats April 2026 total dollar volume of closed sales
The trailing 12-month dollar volume of closed sales came in at $4.76 billion, down from the $4.9 billion readings recorded near the peak in late 2025. This compression reflects fewer transactions rather than lower prices, a distinction worth understanding clearly. Dollar volume is the product of units sold multiplied by average price. With prices holding and even rising while unit counts decline, the softness in total volume is entirely a function of transaction pace.
For Buyers: Stable prices alongside lower dollar volume means the market is not in freefall, but it also means you should not expect a significant price correction to bail you out if you overpay. Buy what you can genuinely afford at today’s prices.
For Sellers: The $4.76 billion trailing volume confirms that substantial real estate activity is still transacting in Nova Scotia. Buyers with real purchasing power are in the market. The issue is not a lack of buyers; it is a more selective and patient buyer pool that requires the right property at the right price.
For Investors: Total dollar volume at this scale confirms market liquidity. Exit strategies remain viable. If you are buying now with a 3 to 5 year horizon, the Nova Scotia Real Estate Market Statistics 2025: Year in Review documents how this market has sustained and grown value through multiple rate and supply cycles.
Avg Price Per Sq Ft (MLA): $352
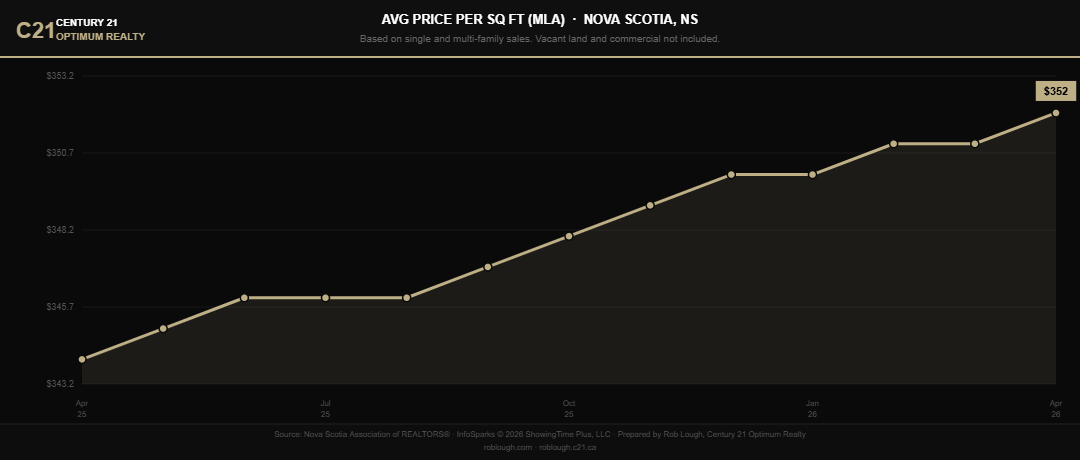
Nova Scotia Market Stats April 2026 average cost per square foot MLA
The average price per square foot based on main living area (MLA) reached $352 in April 2026, continuing a remarkably consistent upward trend that has moved from approximately $343 in spring 2025 to today’s reading without a single monthly reversal. This is one of the cleanest uptrend lines in the entire dataset.
MLA-based pricing strips out finished basement space and provides the most straightforward comparison of above-grade living area value across property types. The consistent rise here tells you that buyers are paying more per usable square foot even as other demand indicators soften. The per-square-foot story at the provincial level mirrors what our Condo vs. House in Halifax-Dartmouth: A Decade of Data analysis found at the local level: per-square-foot values in Nova Scotia have been remarkably durable.
For Buyers: At $352 per sq ft on MLA, you have a benchmark to evaluate any property you are considering. Listings pricing significantly above this figure need to justify the premium with location, condition, or features. Listings below this figure in good condition may represent relative value worth acting on.
For Sellers: Rising price per square foot is good news for your net proceeds calculation. If you have invested in finished space, updated kitchens, or improved living areas, the market is rewarding square footage at a higher rate than it was a year ago. Make sure your listing highlights the quality and livability of your above-grade space.
For Investors: A consistently rising price per square foot is one of the more reliable indicators of underlying value growth in a market. At $352/sqft MLA, you can underwrite renovation and addition costs against a metric that has shown no signs of softening.
Avg Price Per Sq Ft (TLA): $276
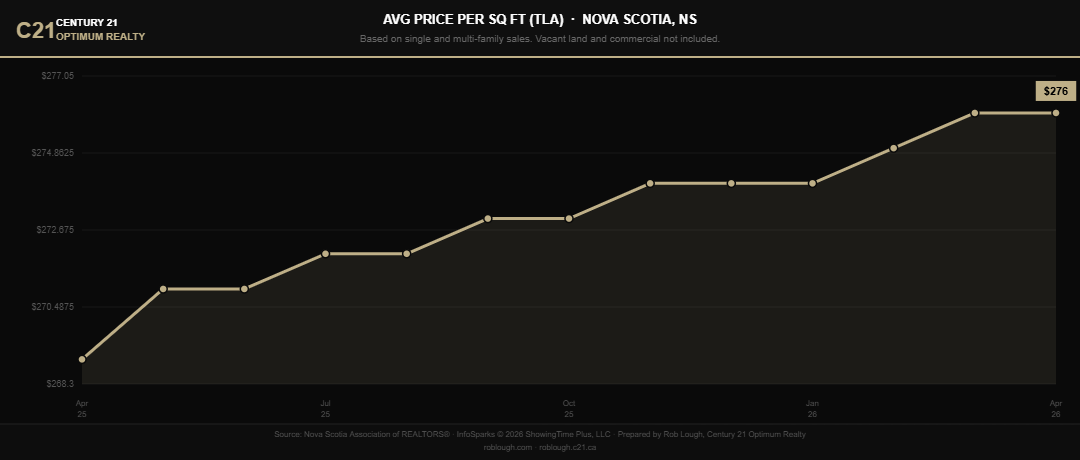
Nova Scotia Market Stats April 2026 average cost per square foot TLA
The average price per square foot based on total living area (TLA), which includes finished basement space, came in at $276 in April 2026. Like the MLA figure, this has trended consistently upward from approximately $268 a year ago, rising steadily through every month of the trailing dataset.
The gap between MLA ($352) and TLA ($276) per square foot reflects the discount the market applies to below-grade finished space relative to above-grade living area. That differential is consistent with what buyers experience in practice: finished basements add value, but not dollar-for-dollar with main floor space.
For Buyers: The TLA figure is relevant when comparing properties where one home has significant finished basement space and another does not. A house with 1,500 sq ft MLA and 800 sq ft finished basement is not the same value proposition as one with 2,300 sq ft entirely above grade, even if the total square footage looks similar.
For Sellers: If your home has a fully finished lower level, make sure your agent is presenting that square footage accurately in the listing and that buyers understand the value it adds. The $276 TLA figure gives you a starting point, but location, finish quality, and natural light all influence how buyers price finished lower levels.
For Investors: For properties where you are considering a basement development or conversion project, the spread between TLA ($276) and MLA ($352) per square foot tells you the approximate value uplift you can expect per square foot of new above-grade-equivalent finished space. Run those numbers carefully against your renovation costs.
Showings Per Listing: 4.0
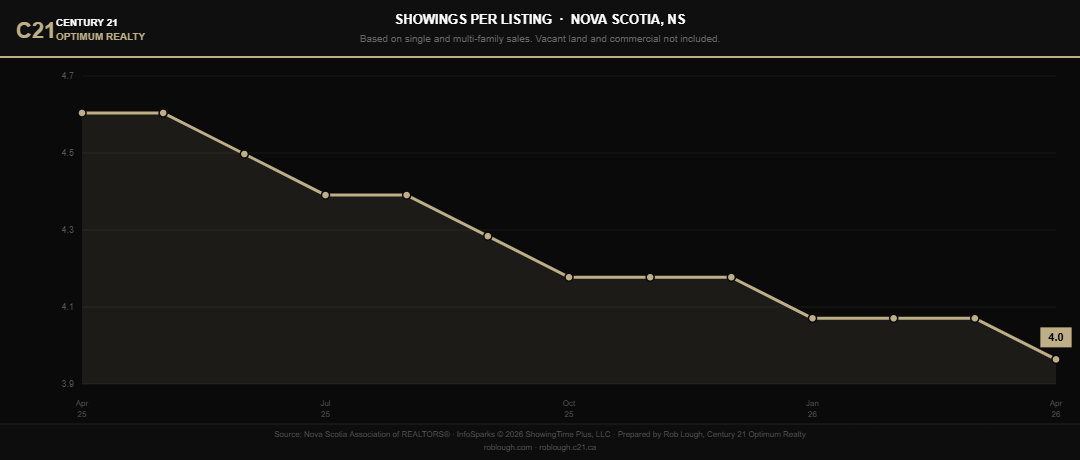
Nova Scotia Market Stats April 2026 average number of showings per listing
Showings per listing dropped to 4.0 in April, extending a downward trend in place since the spring 2025 highs above 4.6. Fewer showings per property is a direct function of more inventory competing for the same pool of active buyers.
For Buyers: Four showings per listing on average means competition at individual properties has softened meaningfully. You are less likely to arrive at a showing and learn that three other offers came in overnight. Take the time to see a property properly before committing.
For Sellers: Every showing counts more than it did a year ago. Your home needs to convert interest into offers at a higher rate when showing traffic is lighter. Homes that show well are still generating offers. Homes that do not are accumulating days on market instead.
For Investors: Fewer showings per listing can indicate which properties are generating genuine market interest versus which ones are sitting. A listing with minimal showing activity after 30 days is typically telling you something about price or condition that deserves your analytical attention before making an offer.
Average Showings to Pending: 9.2
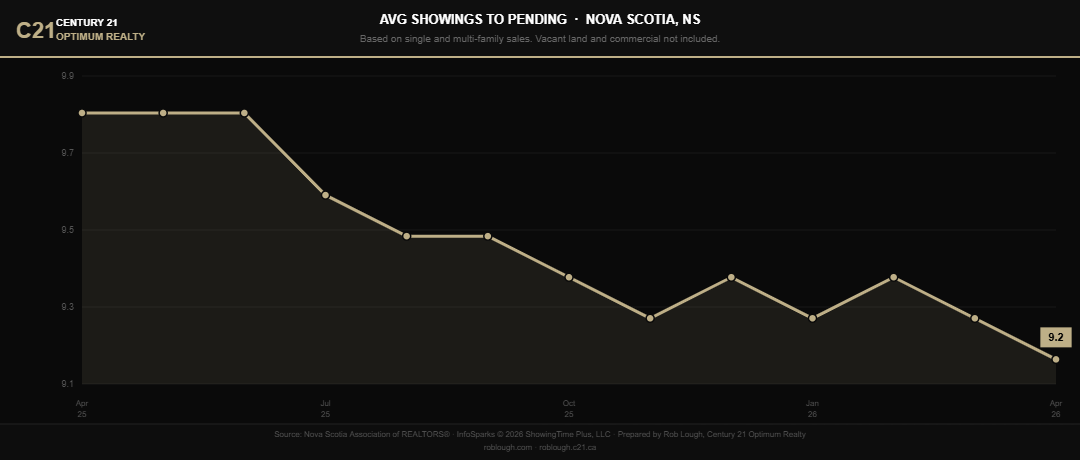
Nova Scotia Market Stats April 2026 average number of showings per listing to pending
It now takes an average of 9.2 showings before a property goes pending, down from near-9.8 levels of spring 2025. That downward trend is actually a modest positive signal: homes that do attract buyers are converting to pending status somewhat more efficiently than they were a year ago. The funnel from showing to offer has tightened even as overall showing volume per listing has declined.
For Buyers: A 9.2 showings-to-pending average means there is a real buyer pool out there working through the inventory. If you are on showing number four or five at a property you love, you are not alone in the market. Move with intention when you find the right home.
For Sellers: Fewer showings are needed to generate an offer than earlier in the cycle. If you are getting quality showings from motivated buyers, your conversion rate is improving. Focus your energy on attracting the right showings through accurate pricing and strong marketing rather than simply maximizing foot traffic.
For Investors: The showings-to-pending ratio is one of the cleaner signals of true buyer demand. At 9.2, demand is present and real. A well-priced income property in a desirable area is still finding its buyer within a reasonable timeframe.
Avg % of Last List Price and Avg % of Last Original Price
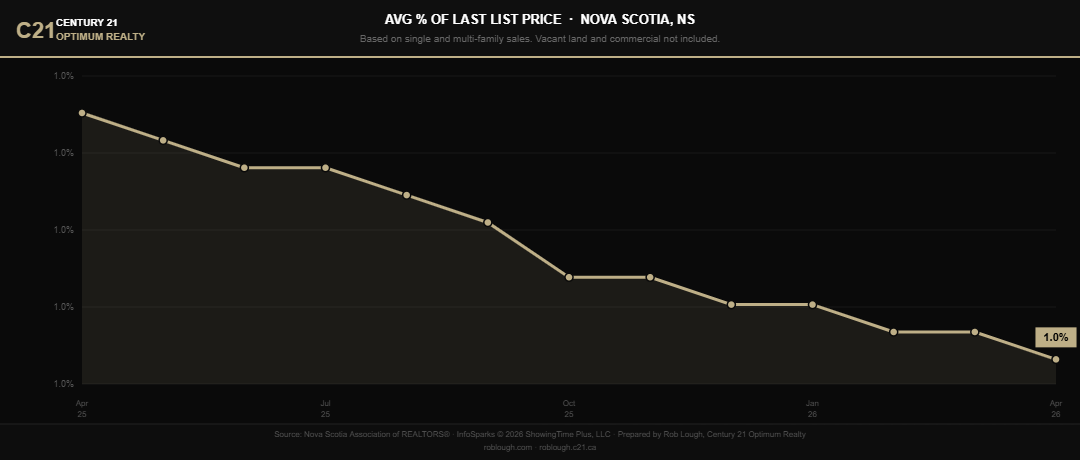
Nova Scotia Market Stats April 2026 average sale to last list price
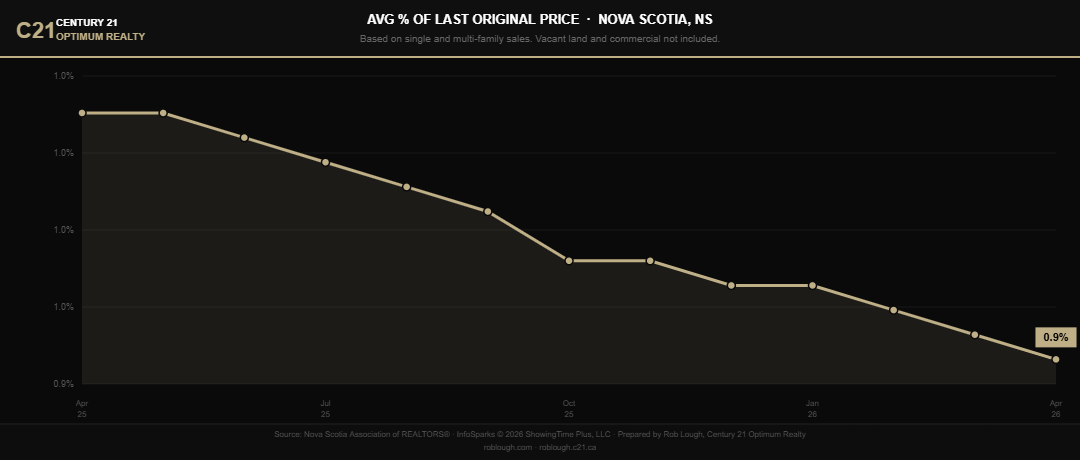
Nova Scotia Market Stats April 2026 average sale to original list price
These two metrics together tell the most important story for anyone actively negotiating right now. Both continued their steady downward drift through April.
The Avg % of Last List Price reflects how close buyers are coming to the most recent asking price, after any reductions. The Avg % of Last Original Price reflects how far the final sale sits from where the seller started. When both figures decline simultaneously, it tells you two things: sellers are reducing before selling, and even after reducing, buyers are still negotiating further below that reduced price.
As noted in our March 2026 report, at current ratios a buyer on a $450,000 to $500,000 home is typically landing $15,000 to $20,000 below the original asking price. The gap between where sellers start and where they close has widened meaningfully over the past year.
For Buyers: You have negotiating room that simply did not exist in 2021 or 2022. Use it. A well-structured offer that comes in below list with reasonable conditions is no longer considered unusual in most segments of the market. Work with your agent to understand what comparable sales support and offer accordingly. The data is on your side.
For Sellers: The two-chart combination here is your clearest warning. Overpricing your home at the outset does not result in a higher sale price. It results in a price reduction followed by a further negotiated discount, leaving you with less than accurate initial pricing would have delivered. Price right the first time and protect your net proceeds.
For Investors: Softening sold-to-ask ratios are your signal that acquisition costs are negotiable. The gap between original list price and final sale is your first layer of value creation on any acquisition. Budget your offer based on realistic comparable sales, not on what sellers are asking.
What This Means Heading Into May
The April 2026 data across all 15 metrics paints a coherent and consistent picture.
Prices are holding and the average is setting new highs. Price per square foot is rising steadily. At the same time, total sales, pending sales, showings per listing, and sold-to-ask ratios are all softening. Inventory is up. Days on market are at their longest point in the trailing year. Months supply is approaching the balanced threshold.
This is not a market in distress. It is a market that has rebalanced after an unprecedented run, and it is operating the way a healthy market should. Buyers have more selection, more time, and more negotiating power than at any point since before the pandemic surge. Sellers who approach pricing and presentation with discipline are still closing successfully at strong prices. Investors who are patient and analytical have more opportunity to acquire on favorable terms than they have had in years.
If you are thinking about buying, selling, or investing in Halifax-Dartmouth, East Hants, or District 104 this spring, reach out. The conditions are workable on all sides of the transaction. It just requires more strategy and preparation than it did two years ago.
For the full context behind these trends, our Nova Scotia Real Estate Market Statistics 2025: Year in Review and Five Years of Nova Scotia Real Estate Market Analysis remain essential reading.
Data source: Nova Scotia Association of REALTORS Based on single and multi-family residential sales. Vacant land and commercial not included. Prepared by Rob Lough, Broker/Owner, Century 21 Optimum Realty.
Related Resources
- Nova Scotia Real Estate Market Stats March 2026
- Spring 2026 Nova Scotia Real Estate
- Nova Scotia Real Estate Market Stats February 2026
- Nova Scotia Real Estate Market Stats January 2026
- Nova Scotia Real Estate Market Statistics 2025: Year in Review
- Five Years of Nova Scotia Real Estate Market Analysis (2021-2025)
- Condo vs. House in Halifax-Dartmouth: A Decade of Data
- The Homeownership Dream Is Still Alive in Nova Scotia

