Facebook
 X
 Pinterest
 Copy Link
Nova Scotia Real Estate Market Statistics October 2026
By Rob Lough, Broker/Owner | Century 21 Optimum Realty | November 3, 2026
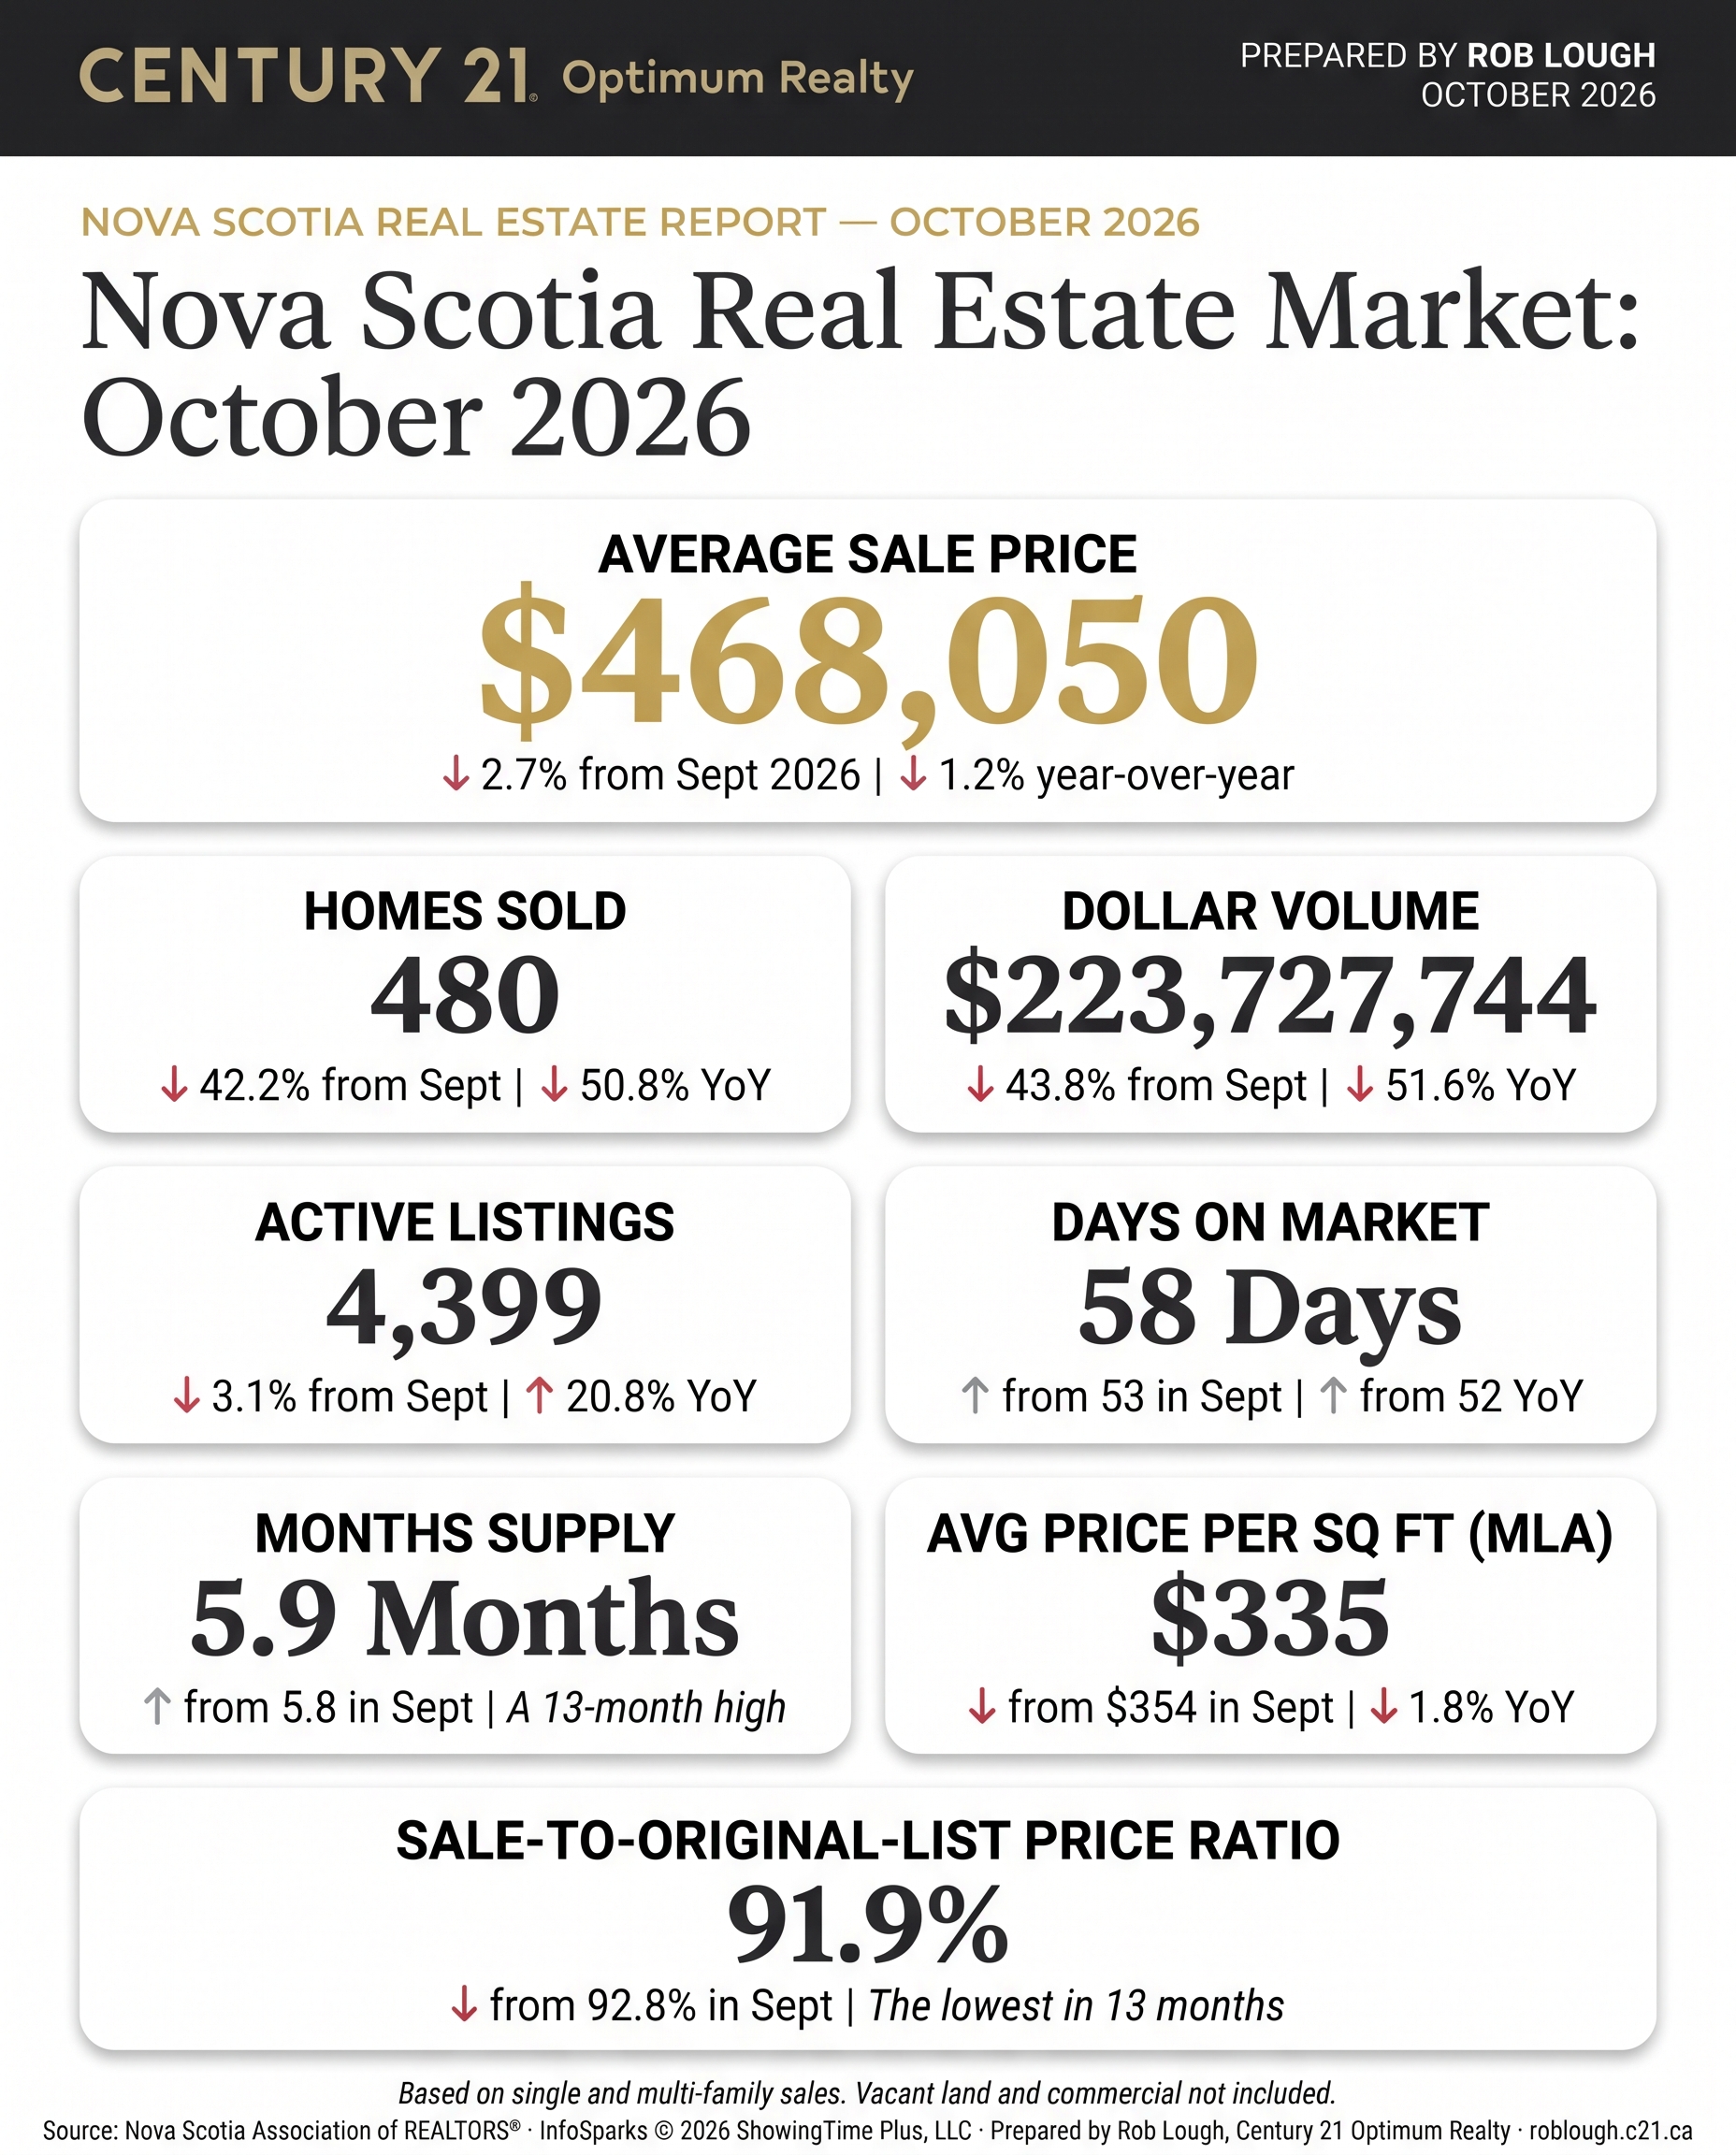
October was a hard month for Nova Scotia real estate. Sales roughly halved from a year ago, new listings and pending sales fell sharply, and homes that did sell took longer and closed further below asking. Months supply still edged up to 5.9, just under the six-month balanced-market line, while inventory eased for the first time since February as sellers pulled back. Here’s what the numbers from the Nova Scotia Association of REALTORS® show for October 2026.
Sales Fall to 480, Roughly Half of Last October
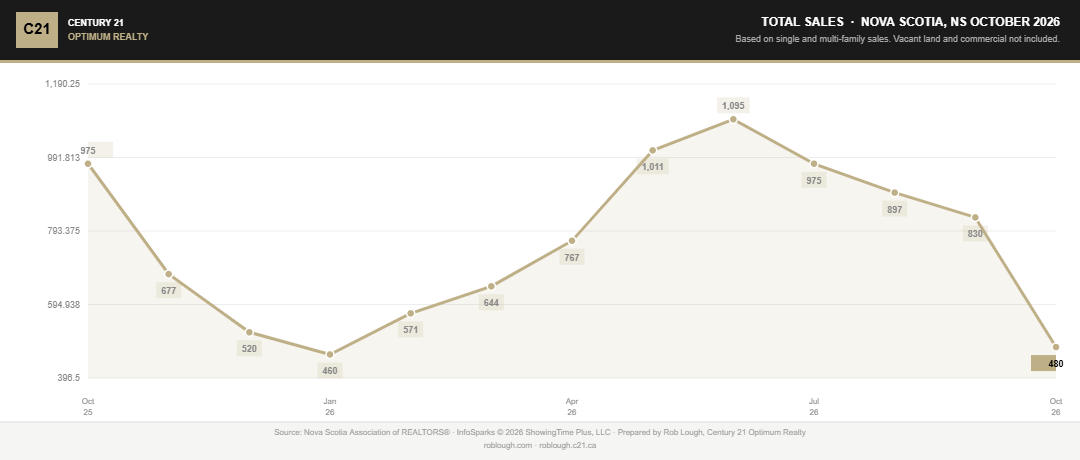
Nova Scotia Real Estate Market Statistics October 2026 total number of units sold
Total units sold came in at 480 in October, down 42.2% from September’s 830 and down 50.8% from the 975 homes sold in October 2025. That is the lowest total in the trailing 13 months outside of January’s 460-sale winter trough, and it comes in the fall, when activity normally holds up.
Pending sales fell to 515, down 37.3% from September’s 822 and down 40.7% from 869 a year ago, which points to a quiet start to November closings as well.
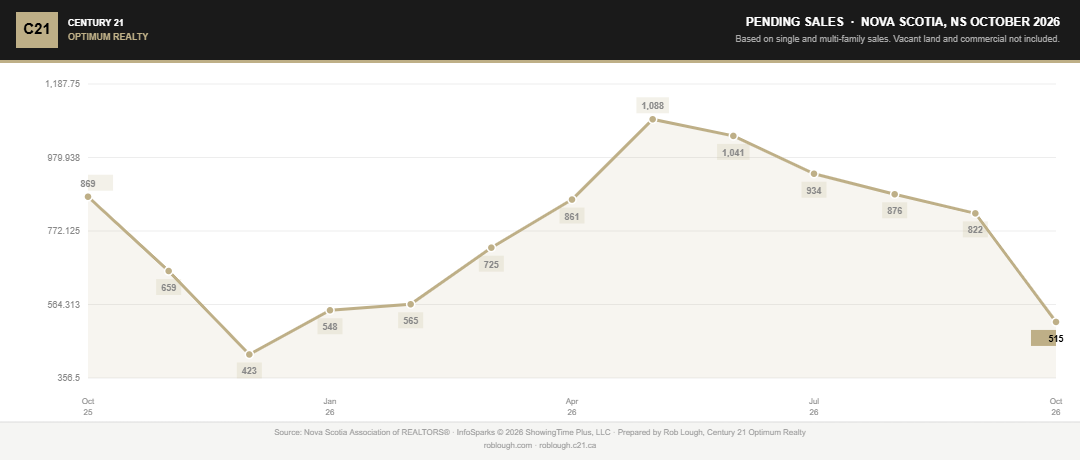
Nova Scotia Real Estate Market Statistics October 2026 number of pending sales
Dollar Volume Drops to $223.7 Million
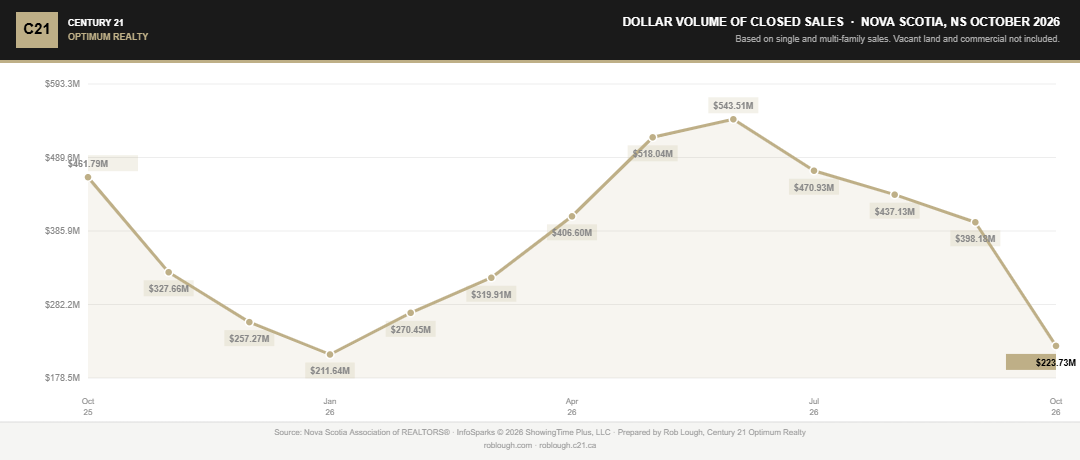
Nova Scotia Real Estate Market Statistics October 2026 dollar volume of closed sales
Dollar volume of closed sales was $223.7 million in October, down 43.8% from $398.2 million in September and down 51.6% from $461.8 million in October 2025. Volume fell slightly faster than unit sales because the average price also came down.
Months Supply Reaches 5.9 Months, Another 13-Month High
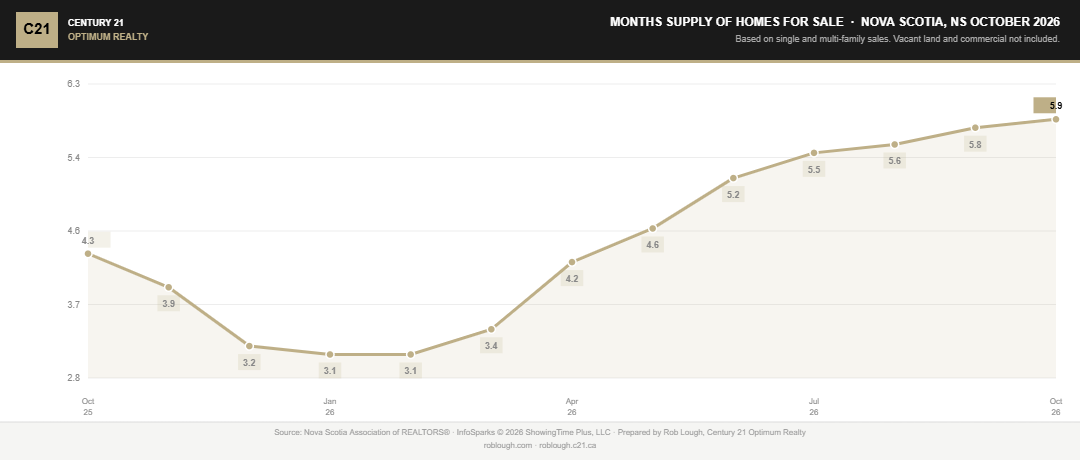
Nova Scotia Real Estate Market Statistics October 2026 months supply of homes for sale
Months supply rose to 5.9 months in October, up from 5.8 in September and well above the 4.3 months recorded in October 2025. That is the highest reading in the trailing 13 months and the eighth straight monthly increase since the 3.1-month low in January and February.
At 5.9, Nova Scotia is now a rounding error away from the six-month threshold that typically separates a seller’s market from a balanced one.
Inventory Eases to 4,399 Homes
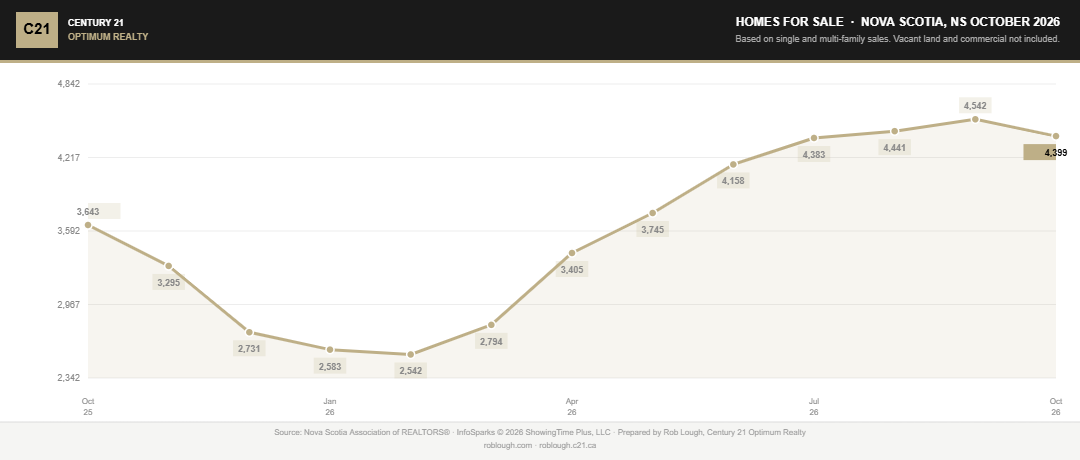
Nova Scotia Real Estate Market Statistics October 2026 number of homes for sale
Homes for sale finished October at 4,399, down 3.1% from September’s 4,542 but still up 20.8% from the 3,643 available in October 2025. It is the first month-over-month decline since February.
The dip is coming from the supply side, not from buyers absorbing homes, which brings us to new listings.
New Listings Drop to 751
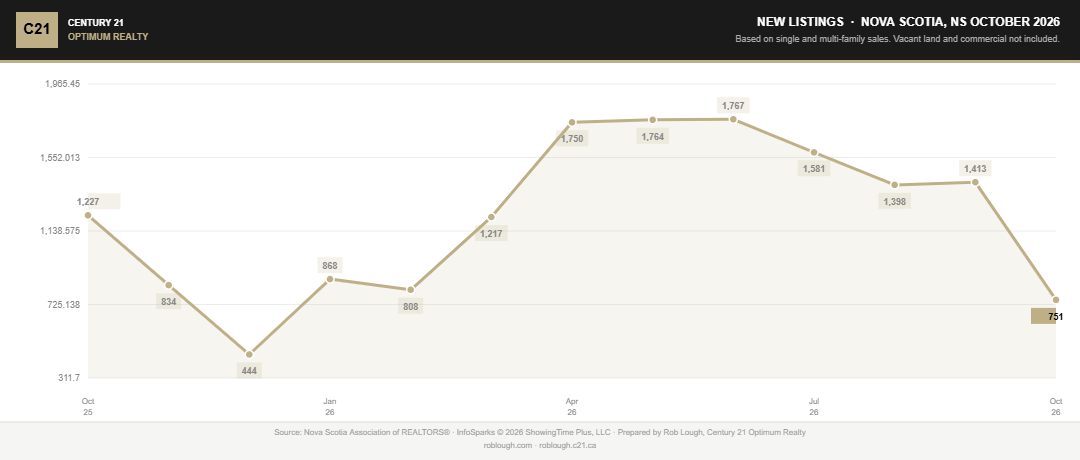
Nova Scotia Real Estate Market Statistics October 2026 number of new listings
New listings totalled 751 in October, down 46.9% from September’s 1,413 and down 38.8% from 1,227 a year ago. That is the lowest total since December’s 444.
Some of this is seasonal, as sellers who don’t see results take their homes off the market for the winter. But a decline this steep suggests many would-be sellers are choosing to wait, not list into a slower market.
Prices Soften: Average Down 2.7%, Median Down 6.5%
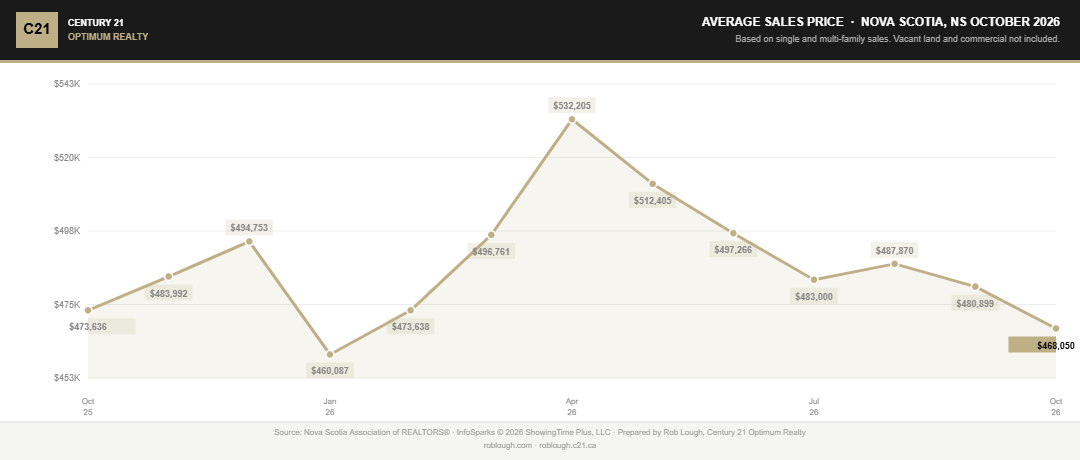
Nova Scotia Real Estate Market Statistics October 2026 average sales price
The average sales price was $468,050 in October, down 2.7% from $480,899 in September and down 1.2% from $473,636 a year earlier. It is the lowest average in the trailing 13 months.
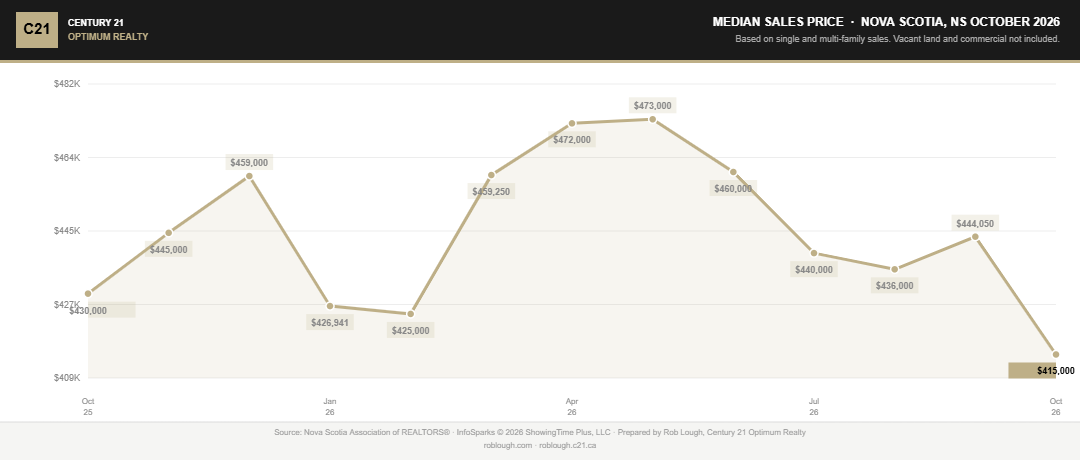
Nova Scotia Real Estate Market Statistics October 2026 median sales price
The median sales price fell harder, to $415,000 from $444,050 in September (-6.5%) and from $430,000 a year ago (-3.5%). A median that falls faster than the average points to more mid-range and entry-level sales in the mix this month.
Price Per Square Foot Slips
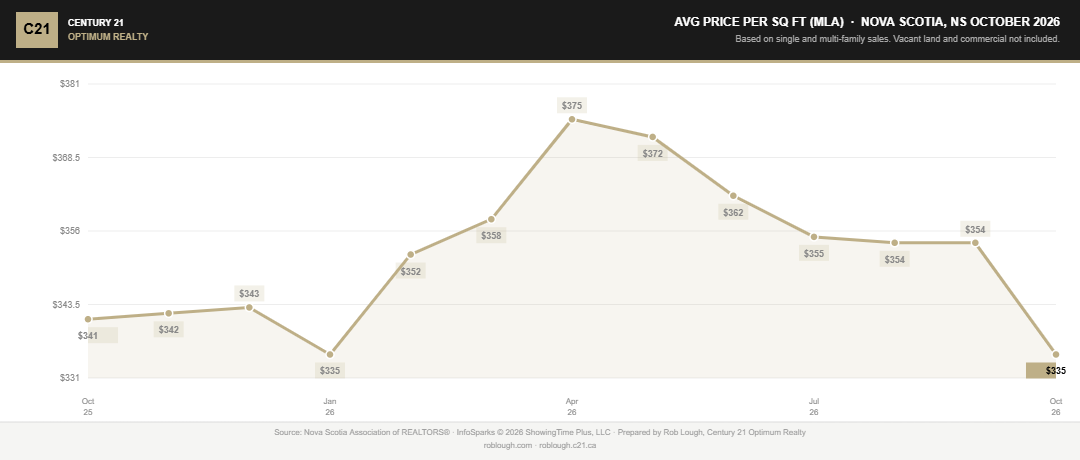
Nova Scotia Real Estate Market Statistics October 2026 average price per square foot MLA
Average price per square foot on total living area was $268 in October, down from $277 in September and 1.1% below the $271 recorded a year ago. On main living area, the figure was $335, down from $354 in September and 1.8% below October 2025’s $341.
This is the first month in this dataset where per-square-foot values sit below last year on both measures. A shift from the “still up year-over-year” story of the past several months.
Days on Market Stretch to 58
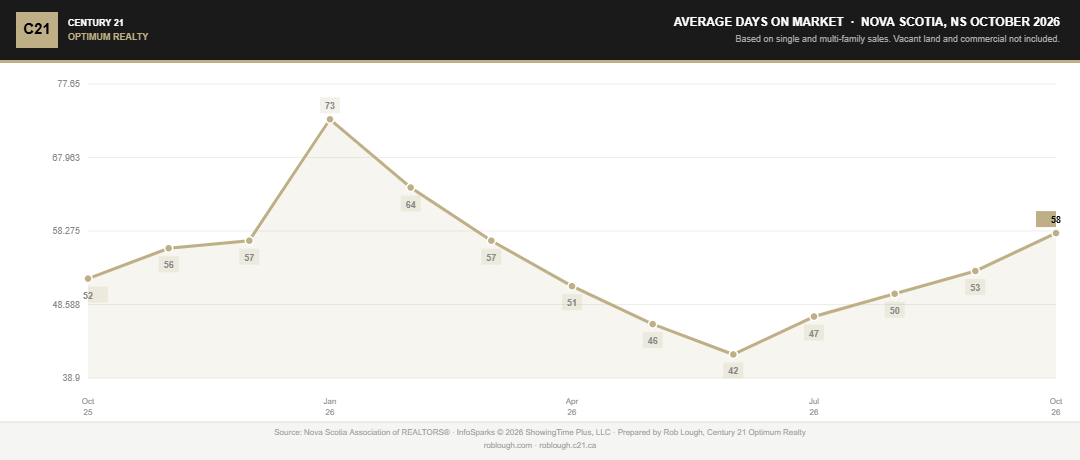
Nova Scotia Real Estate Market Statistics October 2026 average days on market
Average days on market rose to 58 in October from 53 in September and 52 in October 2025. That is the longest time to sell since February’s 64 days, and it is now six days slower than a year ago.
Homes that are priced right still sell faster than the average suggests. But sellers should plan on roughly two months from listing to sale rather than the six weeks they might have counted on in the spring.
Sale Price Ratios Fall to 13-Month Lows
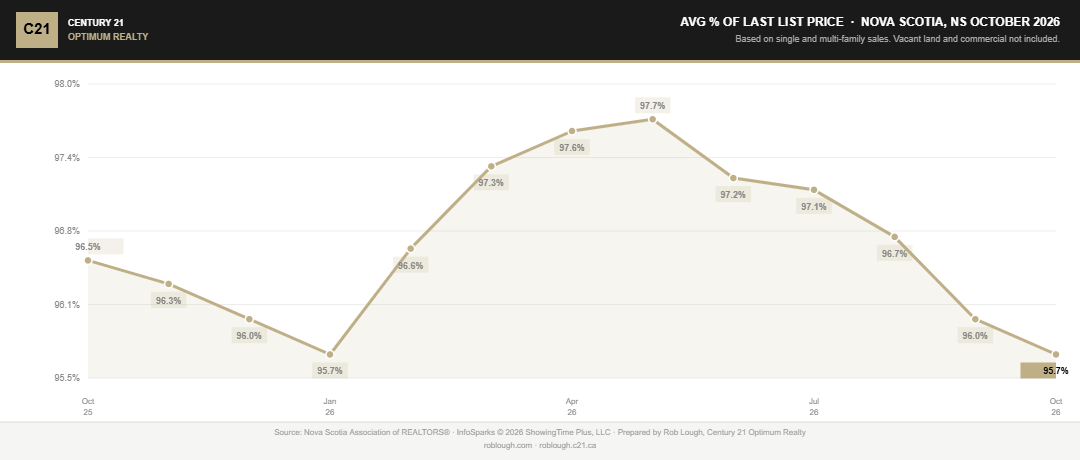
Nova Scotia Real Estate Market Statistics October 2026 average % of last list price
Sellers received 95.7% of their last list price in October, down from 96.0% in September and 96.5% a year ago.
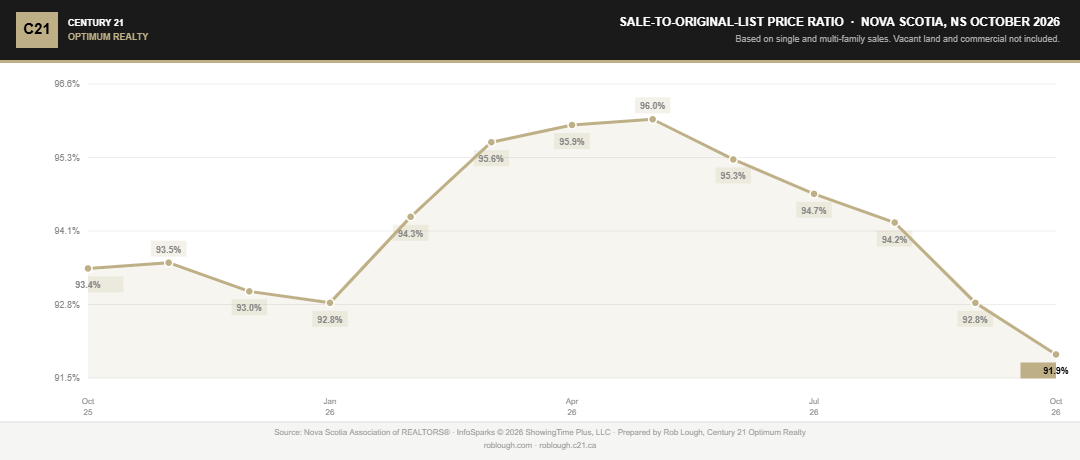
Nova Scotia Real Estate Market Statistics October 2026 average % of original list price
Against the original list price, the ratio was 91.9%, down from 92.8% in September and 93.4% in October 2025. Both ratios are the lowest in the trailing 13 months, and the gap between them has widened to 3.8 percentage points, the widest yet. On a home originally listed at $500,000, that works out to roughly $40,500 off the starting number, most of it from price reductions before the sale.
Buyer Traffic Thins While Conversion Slows
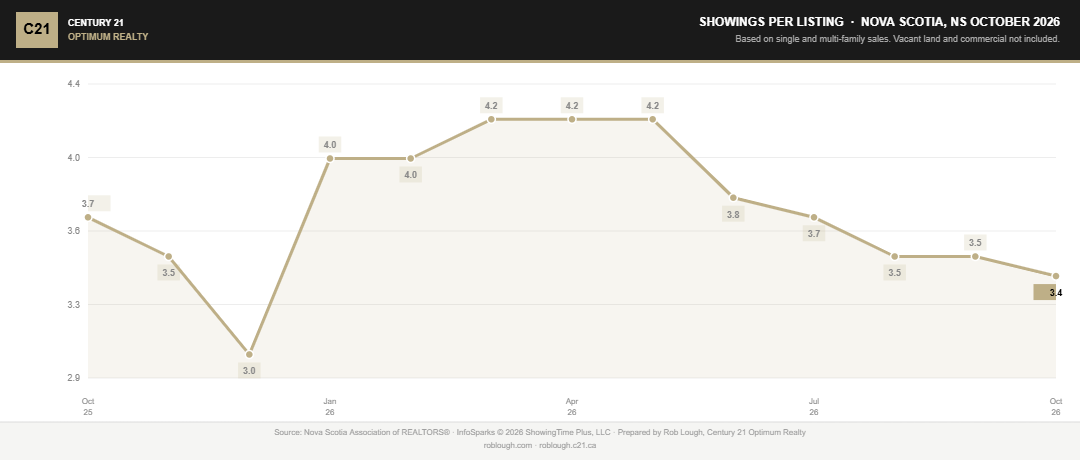
Nova Scotia Real Estate Market Statistics October 2026 average showings per listing
Showings per listing slipped to 3.4 in October from 3.5 in September and 3.7 a year ago, the lowest reading in the trailing 13 months.
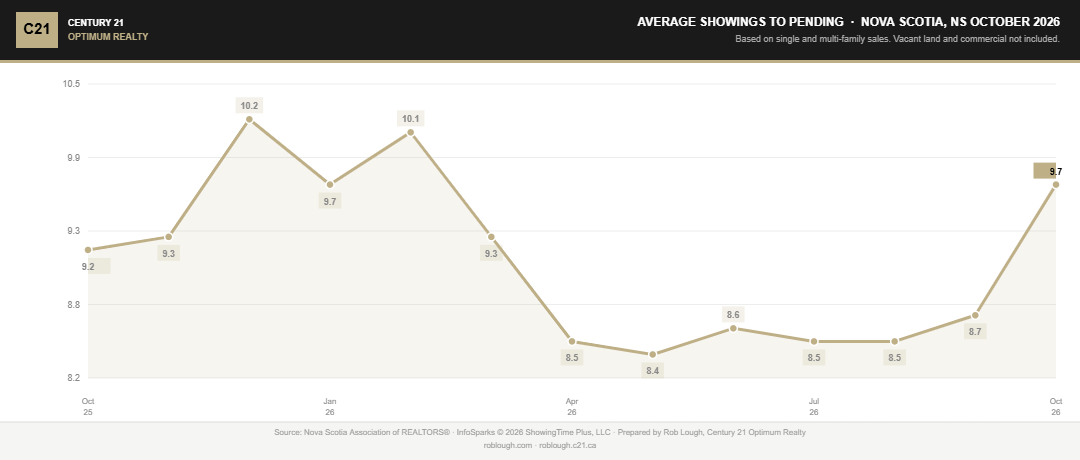
Nova Scotia Real Estate Market Statistics October 2026 average showings to pending
Average showings to pending rose to 9.7, up from 8.7 in September and 9.2 a year ago. Fewer buyers are out, and the ones who are need about one more showing to commit than they did a month ago.
What This Means for Buyers and Sellers
For buyers: The leverage is yours to use. With 4,399 homes on the market, 5.9 months of supply and sellers closing at 91.9% of original list price, you have choice, time and negotiating room. Fewer competing buyers and longer days on market mean you can be more deliberate with inspections, financing and conditions. Don’t assume every listing will take a big discount, though, since well-priced homes still sell. With the Bank of Canada in focus, read our rate decision preview for Nova Scotia buyers and sellers, then get pre-approved and run the numbers with our mortgage calculator before you start touring.
For sellers: Fewer buyers means every showing counts. The 3.8-point gap between the last-list and original-list ratios is the price of a reduction, and with showings per listing at a 13-month low there is little room to test the market high. Price to where the market is today, present the home well, and plan for about two months. Get a free market evaluation before you set your number. If a winter listing isn’t right for you, a well-prepared spring launch is a reasonable alternative.
Frequently Asked Questions
Is Nova Scotia a buyer’s or seller’s market in October 2026? It is essentially balanced and leaning toward buyers. At 5.9 months of supply, the province sits just below the six-month line typically used to define a balanced market, with individual communities varying.
Why did sales drop so much in October 2026? Sales fell to 480 from 975 a year ago (-50.8%), with new listings and pending sales also down sharply. Longer days on market, wider list-price discounts and thinner buyer traffic all point to a cautious market, with many buyers and sellers waiting on the sidelines.
Are Nova Scotia home prices falling? Modestly. The average sales price of $468,050 is down 1.2% year-over-year and the median of $415,000 is down 3.5%. Price per square foot is also below last year for the first time in this dataset.
How long does it take to sell a home in Nova Scotia? Average days on market was 58 in October 2026, up from 52 a year earlier and the longest since February.
How much below asking are homes selling for? The average sale closed at 95.7% of the last list price and 91.9% of the original list price, meaning a home originally listed at $500,000 sold for roughly $40,500 less, on average, mostly due to price reductions along the way.
Why did inventory fall if the market is cooling? New listings dropped 46.9% from September, so fewer homes came on the market while some existing listings were withdrawn or sold. Inventory is still 20.8% higher than a year ago.
Should I wait for prices to drop further? Conditions favour buyers today, and the negotiating advantage is real. Waiting trades a known advantage now for an uncertain one later, and rate decisions can move affordability quickly. Run the numbers on a specific property with our mortgage calculator.
About This Report
Data is sourced from the Nova Scotia Association of REALTORS® and covers province-wide single-family and multi-family residential sales for October 2026. Market statistics describe province-wide averages and may not reflect conditions in a specific community, price band, or property type. For advice on a particular property, connect with our team at Century 21 Optimum Realty.
Related Resources
- Nova Scotia Real Estate Market Statistics – September 2026
- Nova Scotia Real Estate Market Statistics – August 2026
- Nova Scotia Real Estate Market Statistics – July 2026
- Will the Bank of Canada Raise Rates on October 28?
- What Is My Nova Scotia Home Worth? Free Evaluation
- Mortgage Calculator
- Get Pre-Approved
- Century 21 Optimum Realty
Data source: Nova Scotia Association of REALTORS® 2026 ShowingTime Plus, LLC). Prepared by Rob Lough, Broker/Owner, Century 21 Optimum Realty.