Uncategorized โ€ข 10 August 2026

Nova Scotia Loosens the Non-Resident Deed Transfer Tax Rules

Nova Scotia Loosens the Non-Resident Deed Transfer Tax Rules: Good Timing, or Missing the Point?

By Rob Lough, Broker/Owner, Century 21 Optimum Realty, Halifax-Dartmouth, Nova Scotia

On August 7, 2026, the Province quietly announced administrative changes to the Non-Resident Provincial Deed Transfer Tax (PDTT) the 10% tax that non-residents pay when they buy a residential property (three units or fewer) in Nova Scotia. The tax rate itself isn’t changing. What’s changing is how much breathing room buyers get to prove they’ve actually moved here.

Since this affects a real slice of our client base, especially people relocating to Nova Scotia from other provinces, I wanted to dig into whether this is a smart, well-timed adjustment or a cosmetic fix to a policy that’s been controversial since day one. I’ve tried to lay out the case both ways rather than just cheerlead it.

What Actually Changed

Effective for property transfers on or after August 7, 2026, the Province of Nova Scotia made five administrative adjustments to the PDTT:

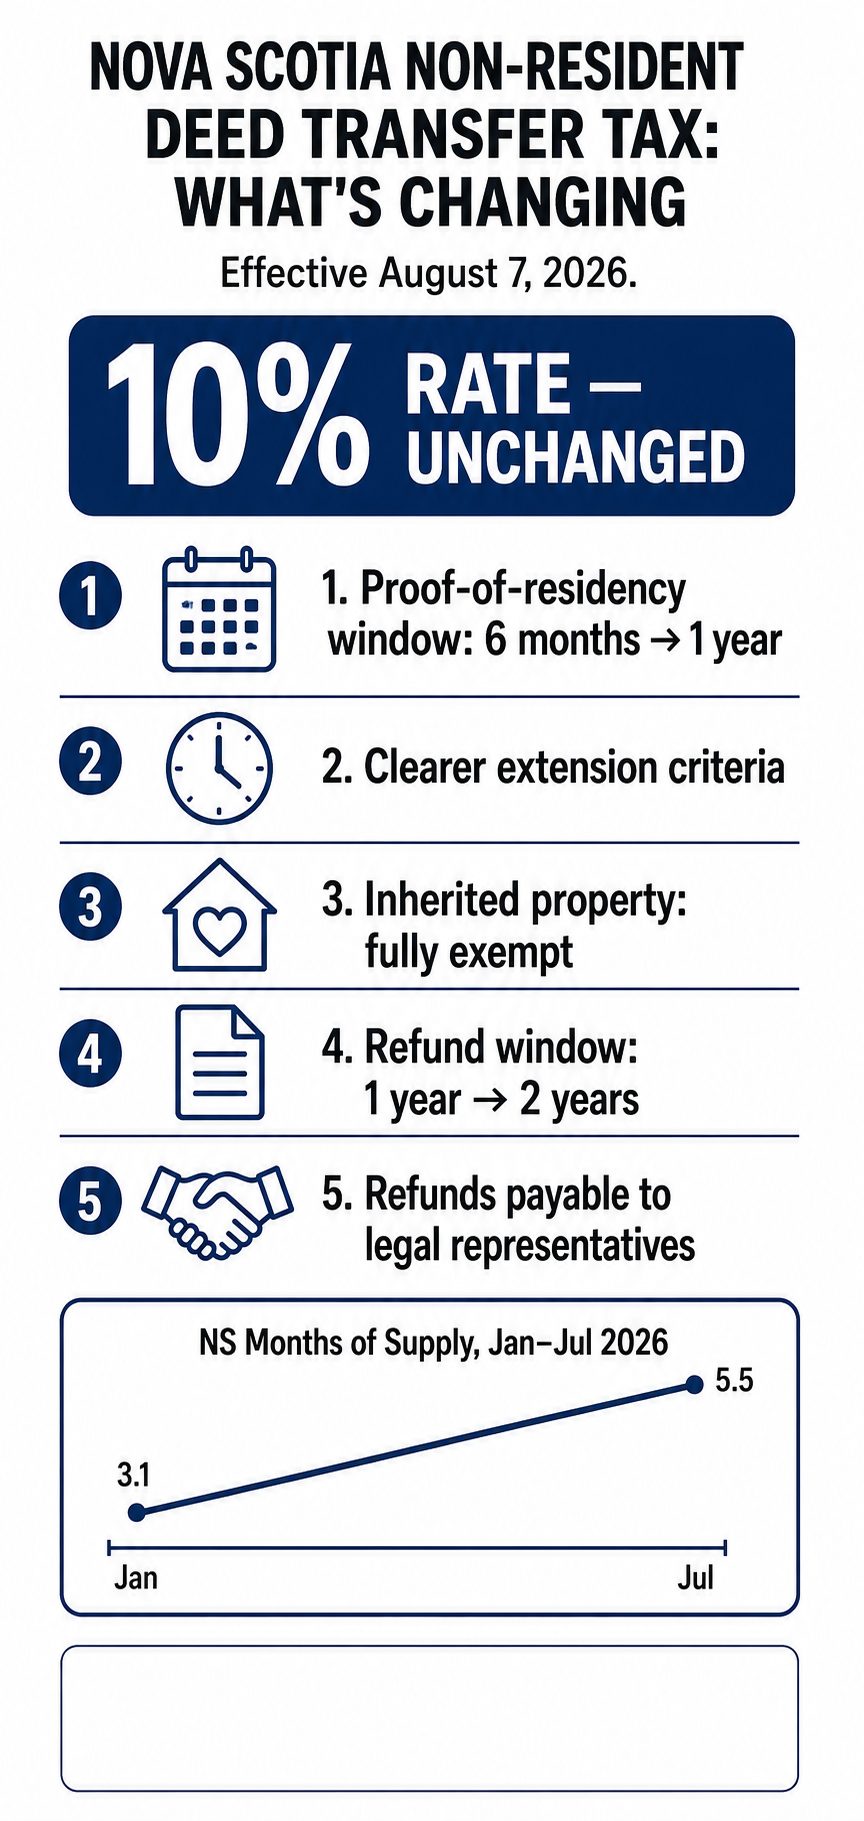
  1. Proof-of-residency timeline doubled – from 6 months to 1 year to show you’ve actually become a Nova Scotia resident.

  2. Clearer rules for extensions – more explicit criteria for delays like construction holdups or job transitions.

  3. Inheritance exemption – property willed to a non-resident after a death is now exempt from the tax outright.

  4. Refund window doubled – from 1 year to 2 years to apply for a refund if you paid the tax and later qualified for an exemption.

  5. Refunds payable to legal representatives – cutting down on estate and probate friction.

The tax rate stays at 10% of the greater of purchase price or assessed value, and it still applies only to non-residents buying residential property with three units or fewer (Government of Nova Scotia). As of this writing, the Province’s own PDTT web page and guidelines still reflect the pre-August 7 rules, the government has said the site, Guidelines, and Property Online interface will be updated “as soon as possible.”

Where Our Market Sits Right Now

Here’s the part that matters most for judging the timing of this move. According to our July 2026 Nova Scotia market statistics, sourced from the Nova Scotia Association of REALTORSยฎ:

Metric July 2026 July 2025 Change
Months supply of inventory 5.5 months 4.5 months Highest reading in the trailing 13 months
Average sale price $483,395 $478,574 +1.0% YoY, down 2.7% from June
Median sale price $440,000 $449,000 -2.0% YoY
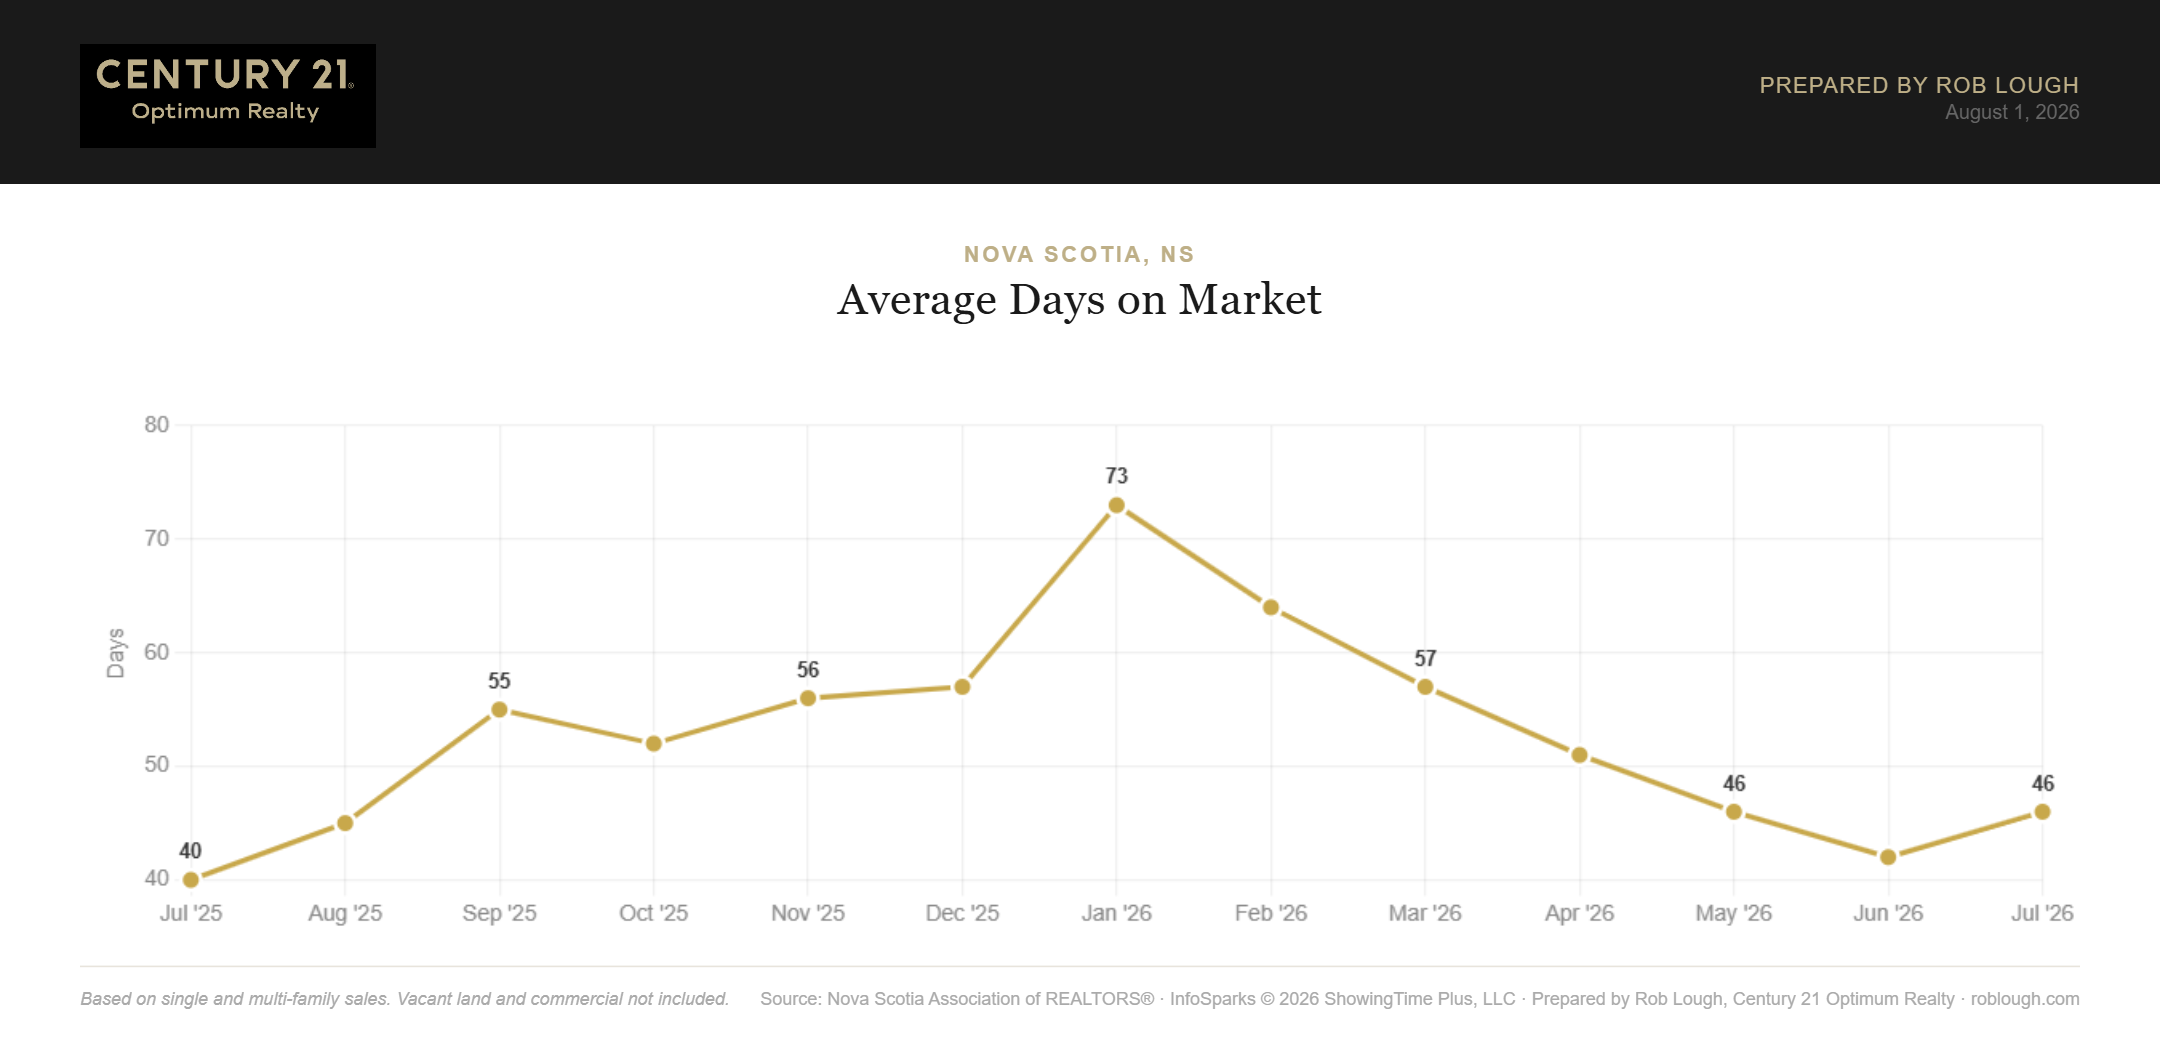
Average days on market 46 days 40 days 6 days slower
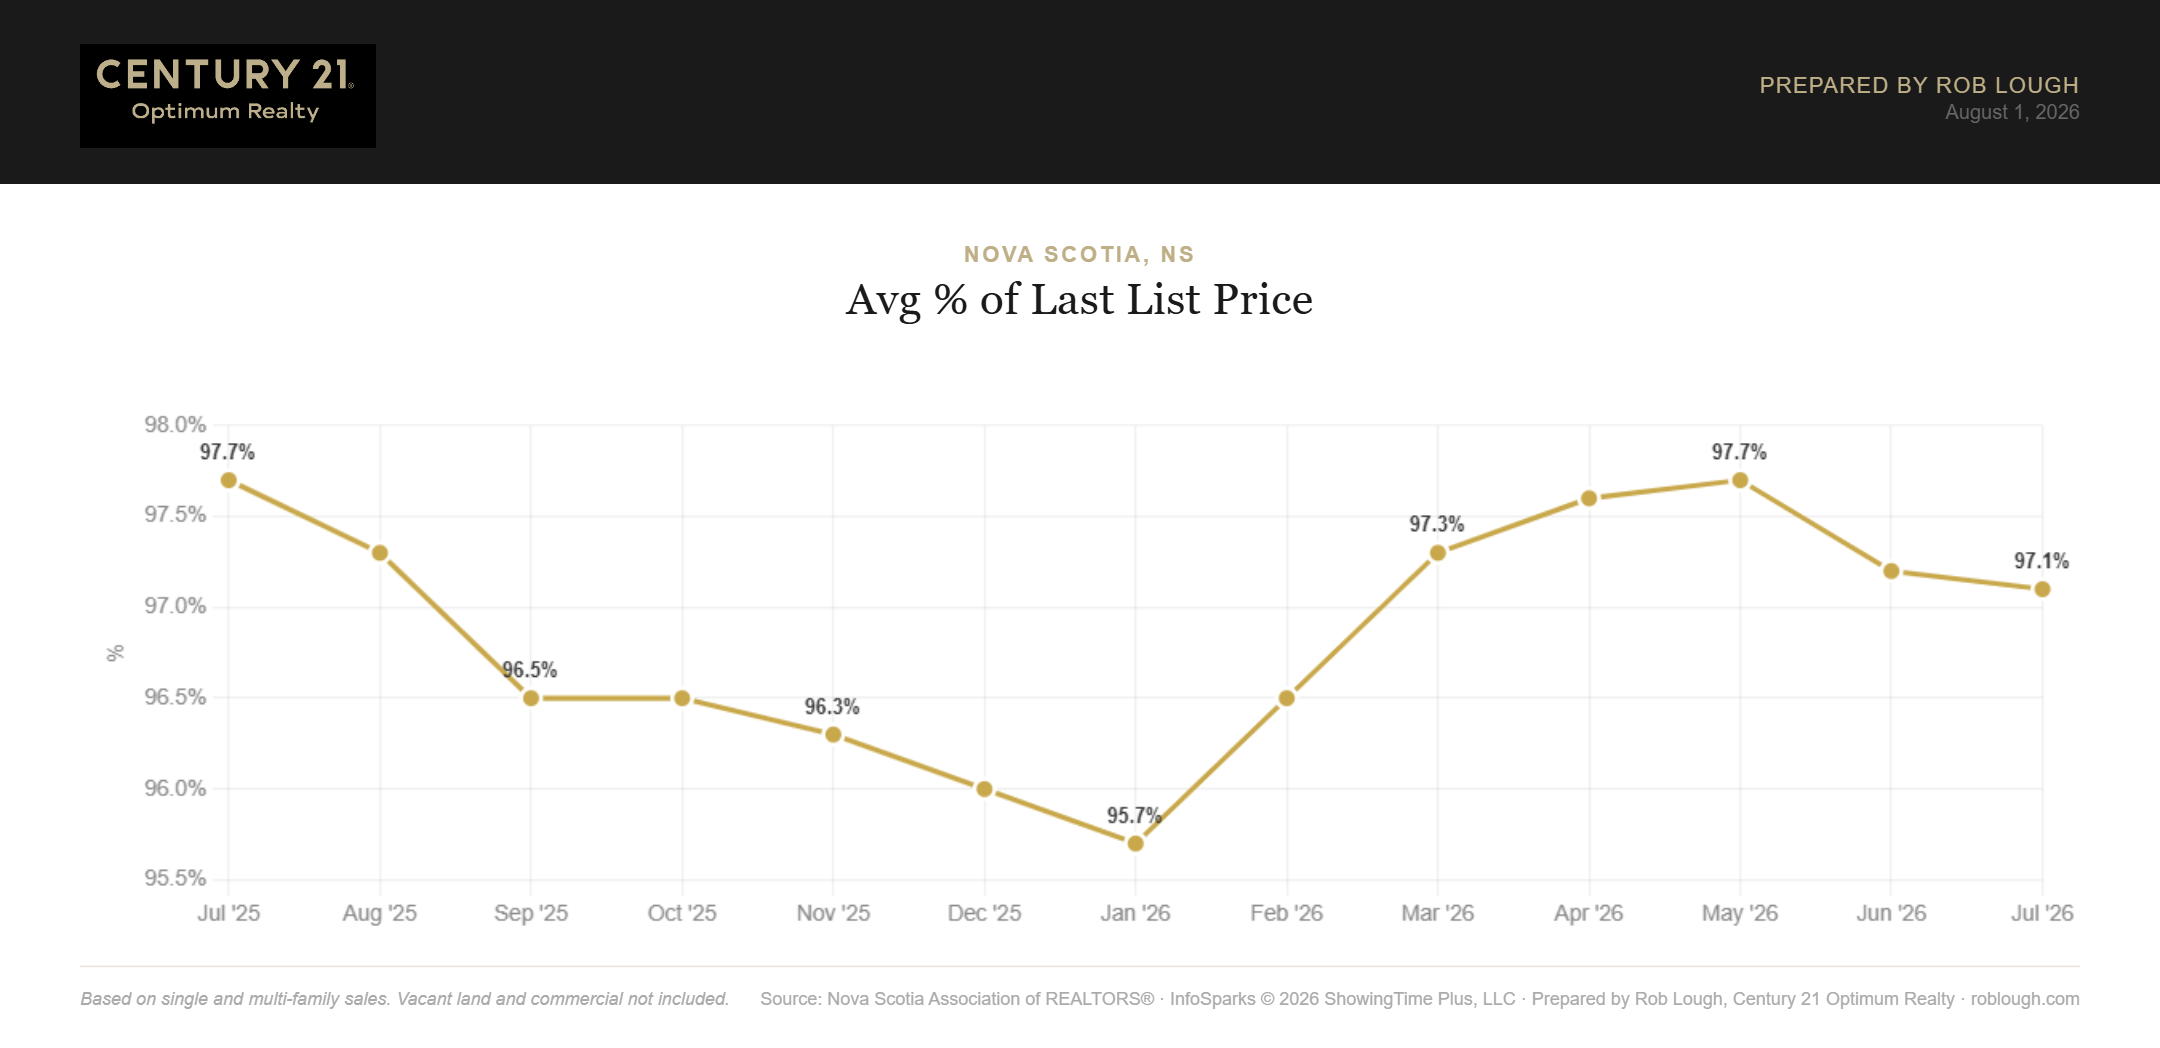
Sale-to-list price ratio 97.1% 97.7% Lowest since February 2026
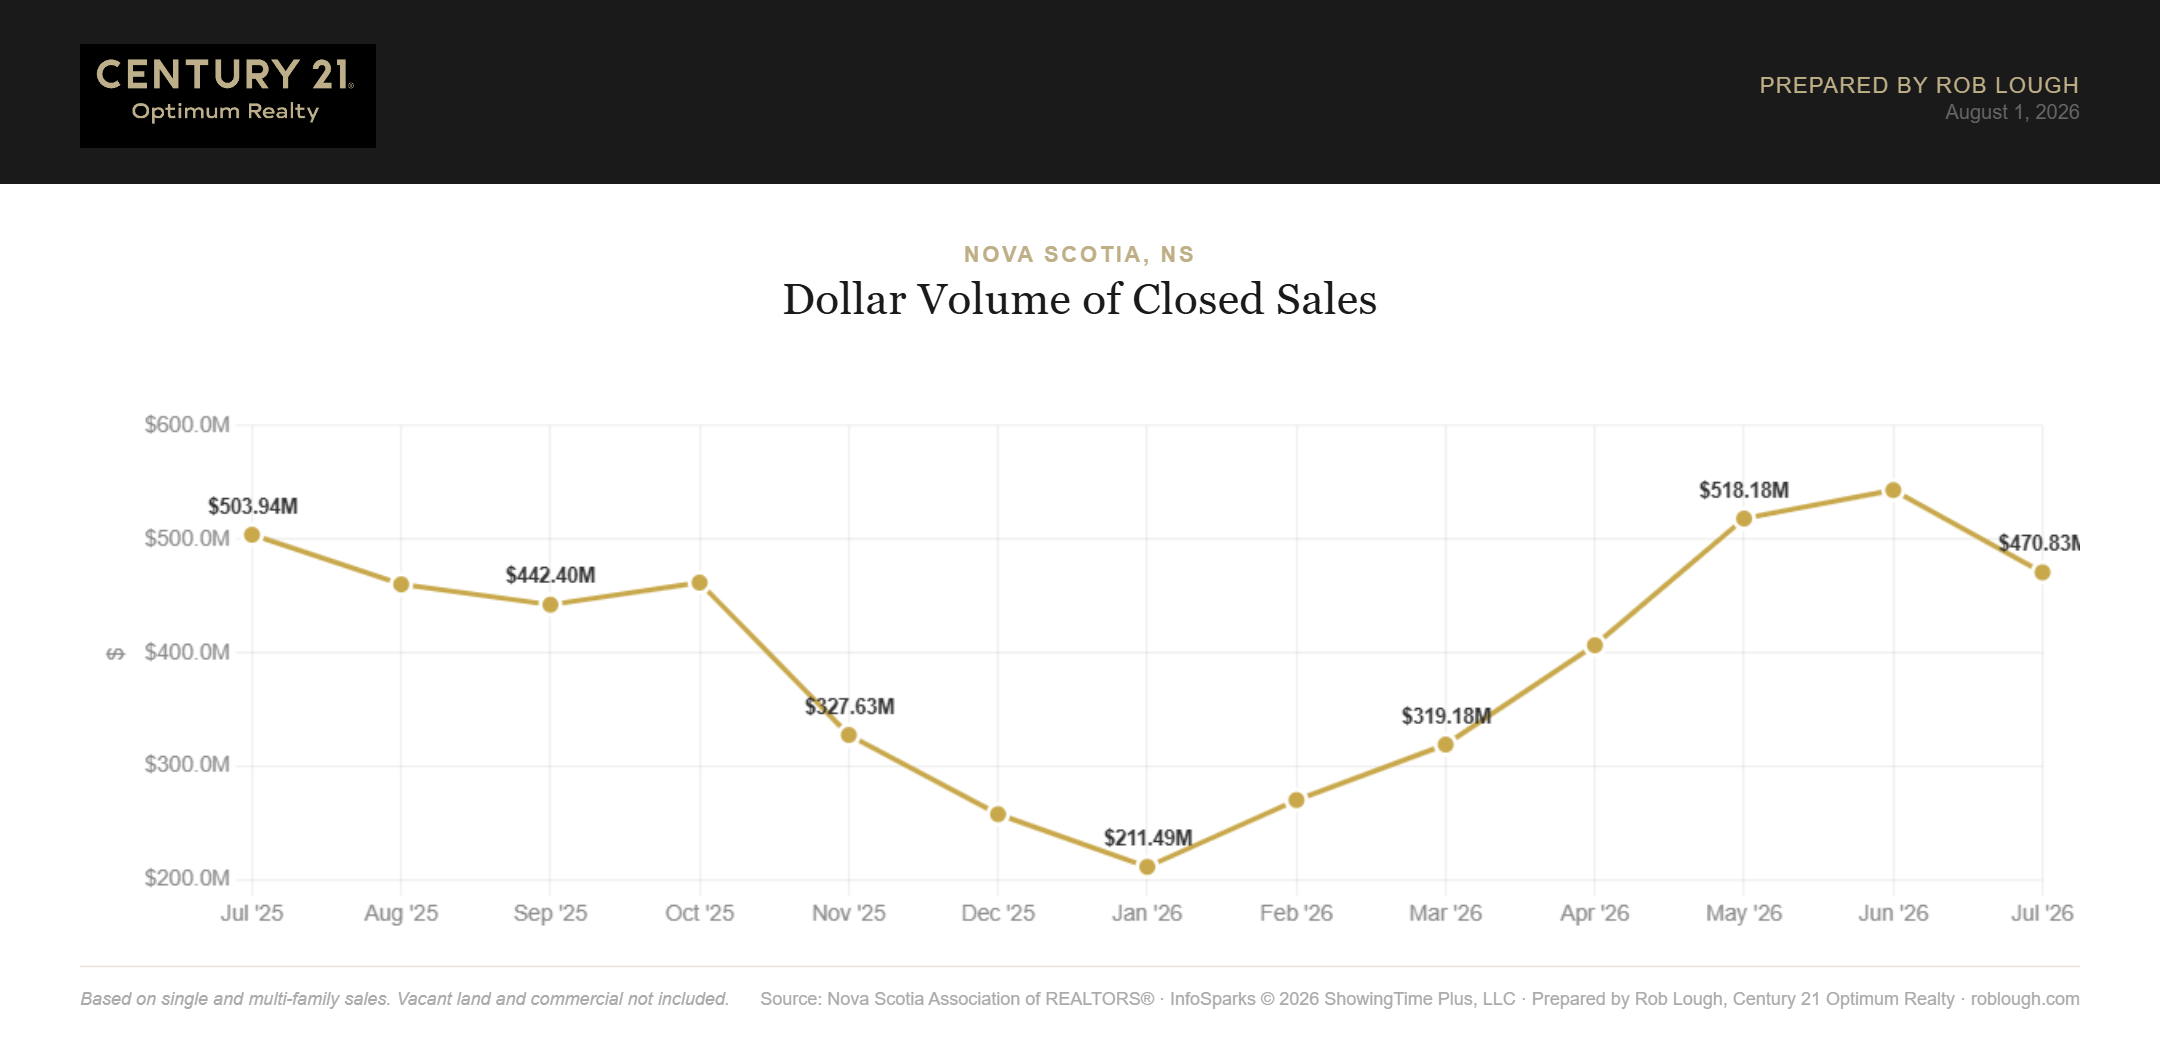
Dollar volume of closed sales $470.83M $503.94M -6.6% YoY

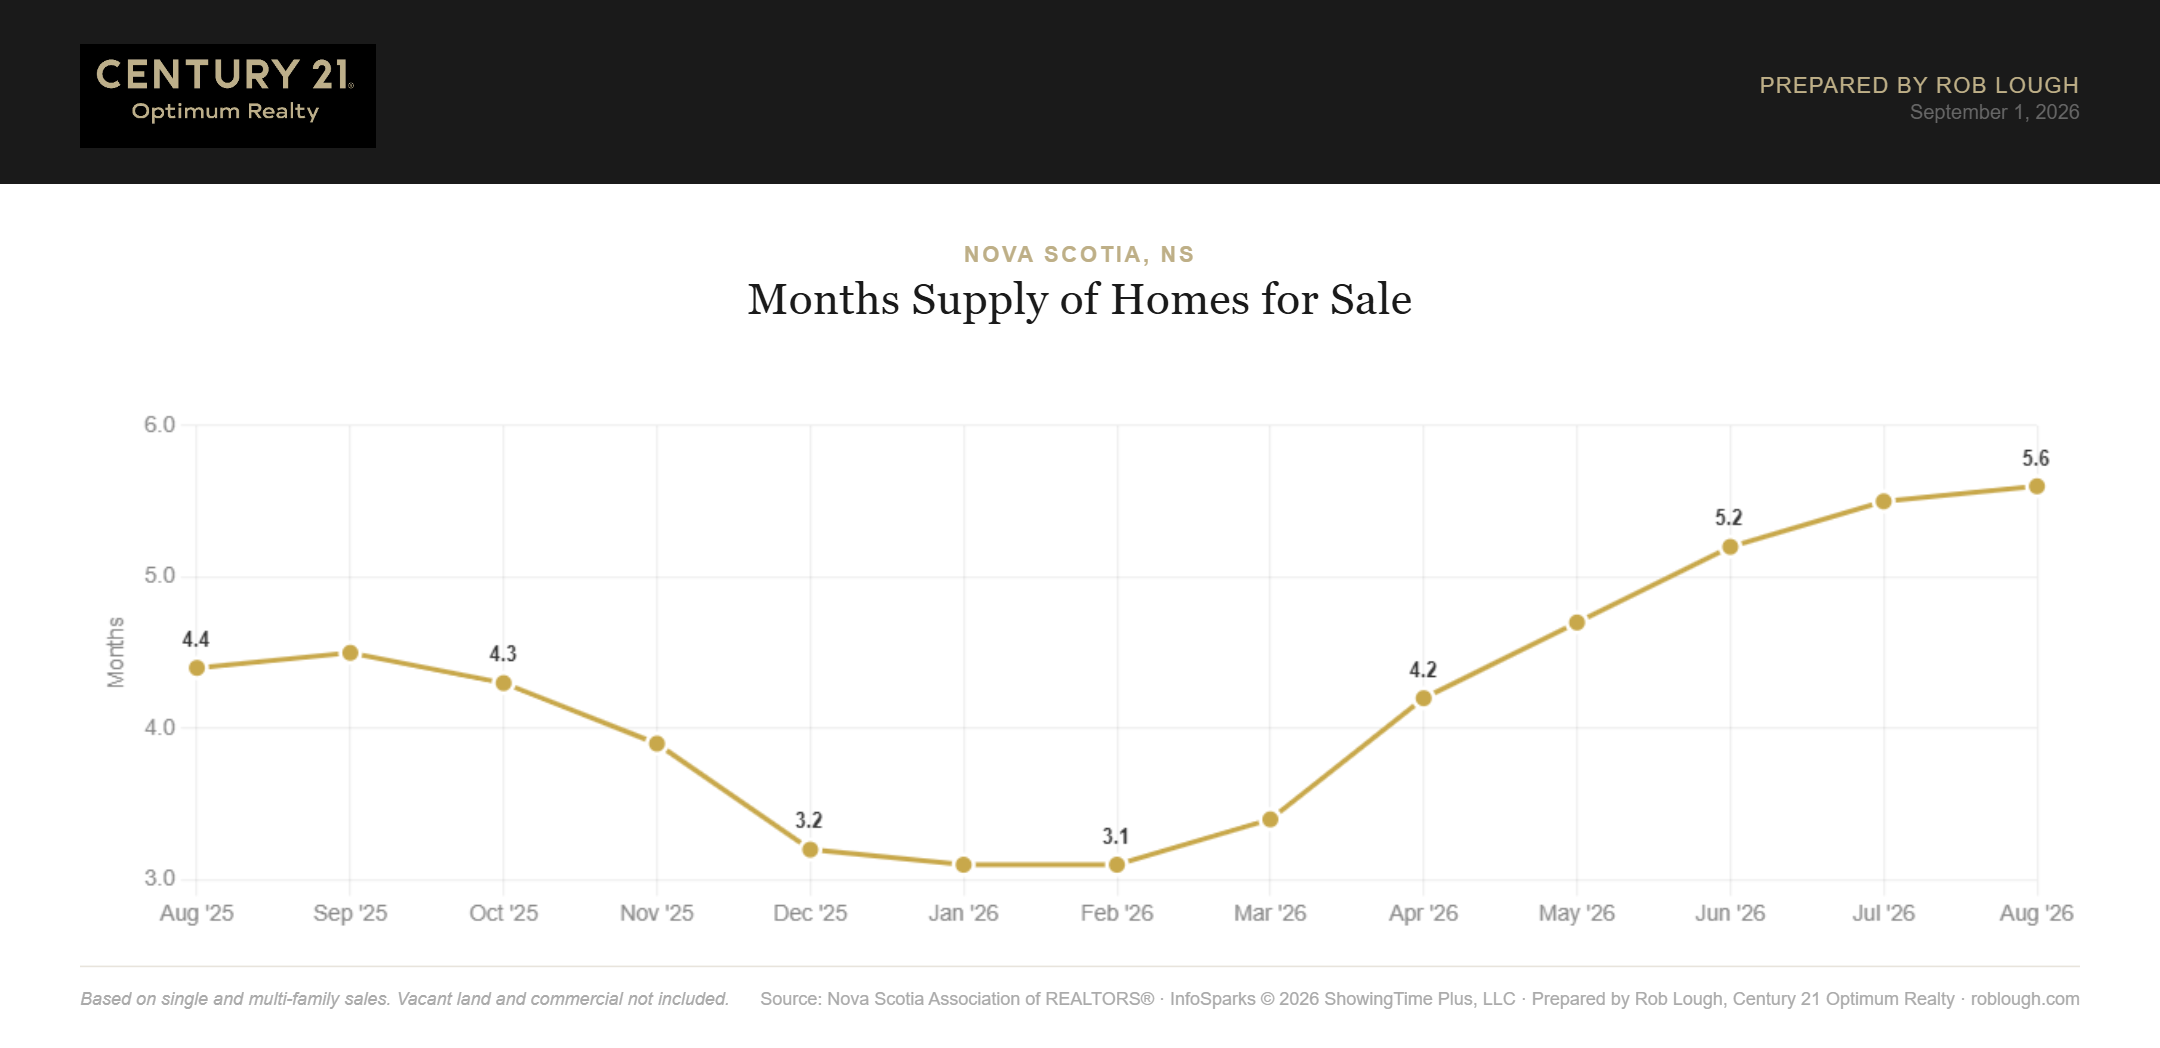
This is the fourth straight month of loosening conditions. Months supply climbed from a 3.1-month low in January and February 2026, through April’s steady price-per-square-foot climb and June’s 5.2-month reading, up to 5.5 months in July, closing in on the 6-month threshold that typically marks a balanced market. Homes are sitting longer, sellers are accepting a bit more off list price, and price growth has essentially flattened. Our Halifax price-per-square-foot analysis tells a similar story, values are holding on a per-foot basis even as headline averages soften, which is a useful reminder that this is a market shifting gears, not falling off a cliff. In short: this isn’t the red-hot, inventory-starved market of 2021โ€“2022 that originally justified this tax. It’s a market that’s been steadily rebalancing toward buyers all year.

The Case That the Timing Makes Sense

There’s a reasonable argument that easing the administrative burden now is a sensible, low-risk move:

  • It targets a genuinely common complaint, not the controversial part. Ever since the tax doubled from 5% to 10% on April 1, 2025, the Nova Scotia Association of REALTORSยฎ (NSAR) has argued the policy punishes people who fully intend to move here but get tripped up by circumstances outside their control, a delayed closing on their old house, a construction delay on their new one, a job start date that slips. NSAR incoming president Suzanne Gravel called the tax a “don’t come here” measure and said it “instantly gives a person the feeling they don’t want us to come there” (CBC News). Giving genuine movers a full year instead of six months and clearer criteria for extensions, directly answers that specific complaint without touching the 10% rate that raises the real political and fiscal stakes.

  • The inheritance exemption closes an obvious fairness gap. Taxing someone 10% on a home they didn’t choose to buy, they inherited it after a death in the family, was hard to defend on its face, regardless of where anyone stood on the broader tax.

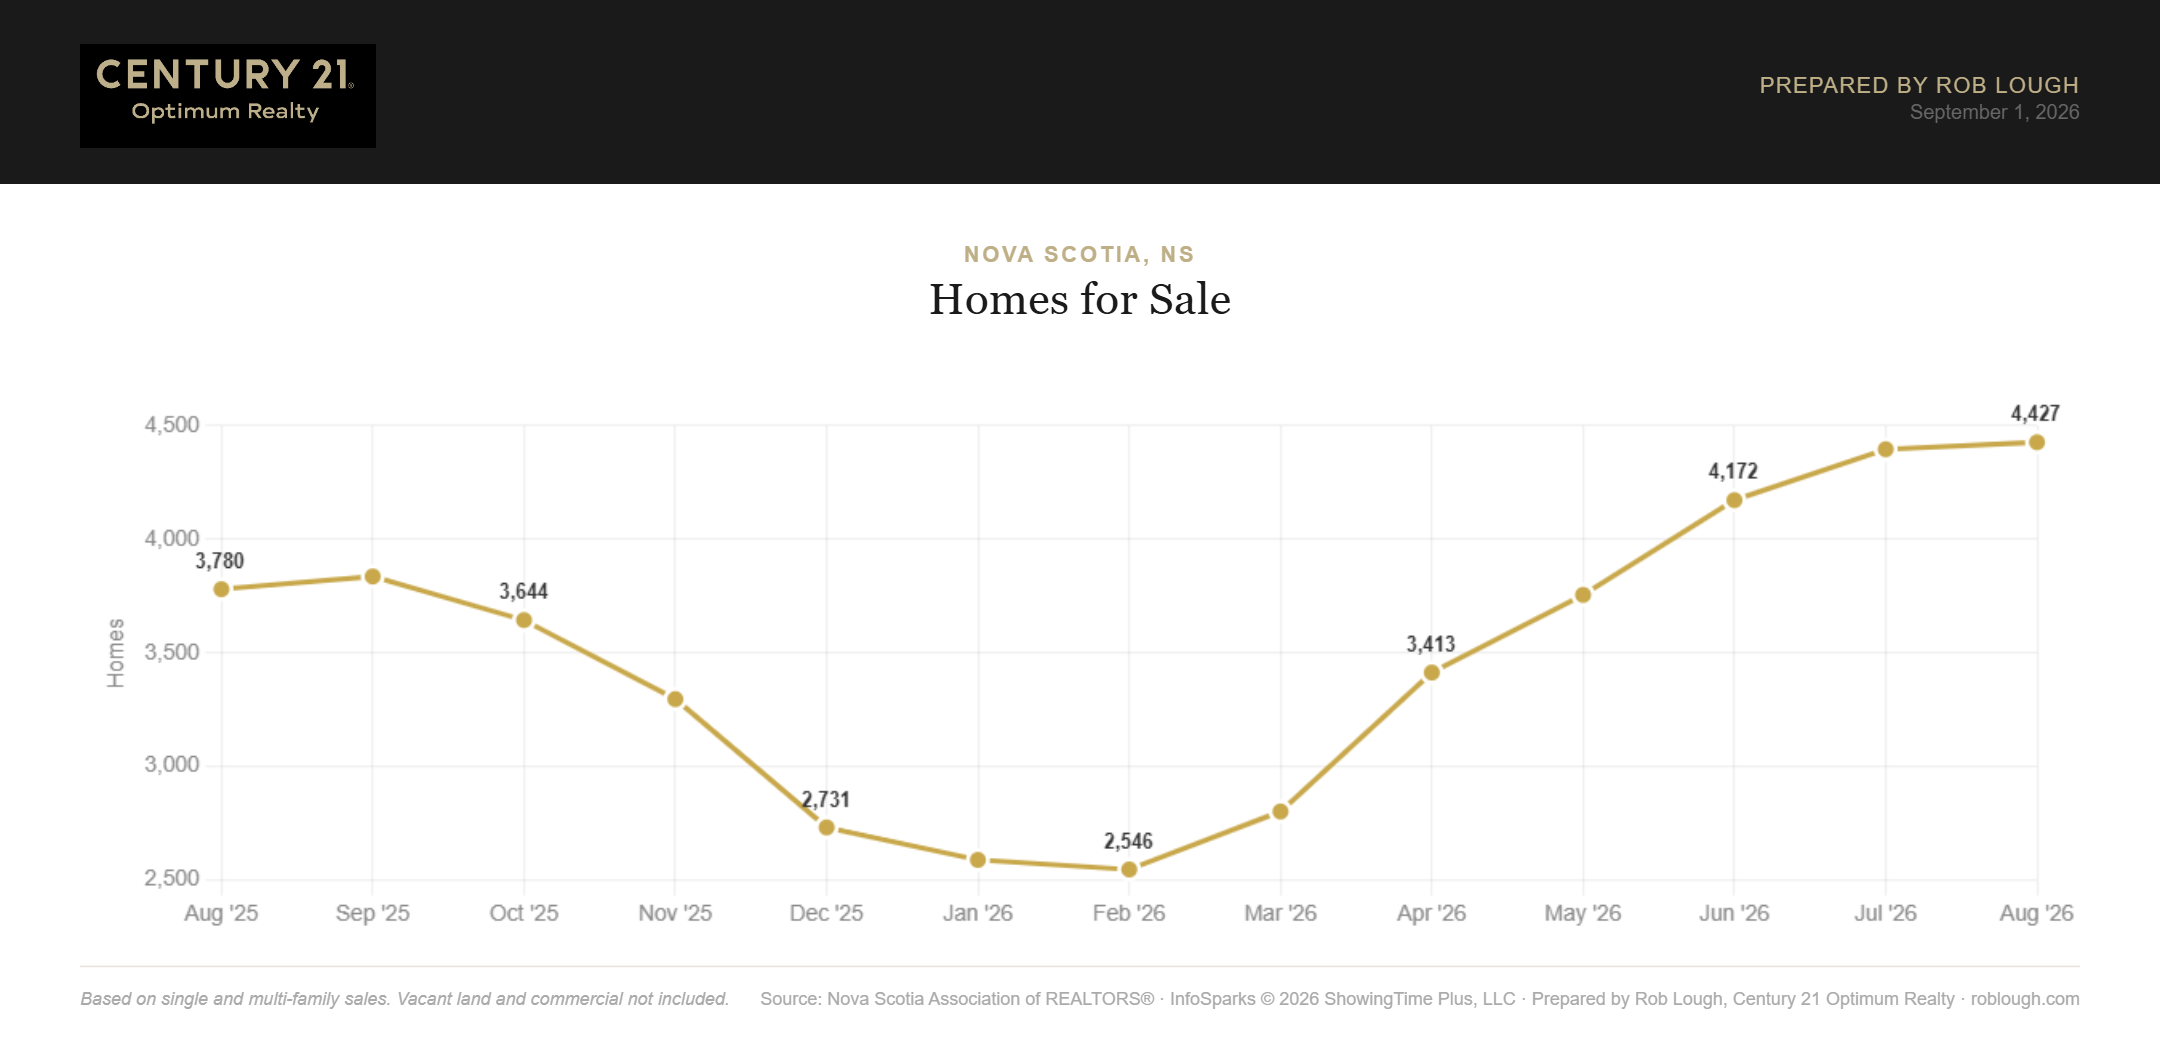
  • A softening market gives the Province more room to be flexible. Back in 2022, when the tax was introduced, Nova Scotia was in the middle of an inventory crisis with months-of-supply readings well under two months in many areas and home prices spiking. Today’s 5.5-month supply and cooling prices mean there’s comparatively little risk that giving relocating buyers more time will meaningfully squeeze out local buyers, the supply-demand pressure that motivated the original policy has eased considerably.

  • It doesn’t cost the anti-speculation intent anything. Because the 10% rate is untouched, anyone who isn’t a genuine relocating resident, pure investors, seasonal buyers, still pays the full tax. The changes only extend grace to people who ultimately do become residents.

The Case That It Doesn’t Go Far Enough or Misses the Point

There’s an equally reasonable argument that this is a fairly minor fix layered on top of a policy that critics say has bigger problems:

  • It leaves the actual point of contention untouched. NSAR’s core position has never been about the paperwork deadlines, it’s that the 10% rate itself is punitive. The association collected more than 450 letters from realtors, lawyers, builders and residents calling for the tax to be repealed outright, with NSAR president Andrew Gilroy arguing it sends “a contrary message” while Nova Scotia is trying to reduce interprovincial trade barriers elsewhere (The Laker News). Administrative easing doesn’t move that needle.

  • There’s direct evidence tying the tax itself, not its paperwork, to slower activity. In Royal LePage Atlantic’s Q1 2026 market report, broker/owner Matt Honsberger said Halifax’s unusually quiet activity reflected “the cooling effects of slowing immigration, and the added cost of Nova Scotia’s interprovincial transfer tax” (Royal LePage), and a Halifax-area broker told CBC the rate doubling had a “substantial impact” on sales (CBC News). If the tax’s cost, not the deadline, is what’s discouraging buyers, longer grace periods don’t address that.

  • Economists have questioned whether the tax’s design even targets the right problem. Dalhousie economist Lars Osberg described the deed transfer tax as fundamentally “a tax on a transaction” that pushes buyers to pay more and sellers to net less, calling it primarily “a rural phenomenon” that “doesn’t touch at all the people who own apartment buildings”, the larger-scale ownership he sees as the bigger driver of the housing shortage (CityNews Halifax). Cape Breton University’s Catherine Leviten-Reid, while more supportive of the tool in principle, noted Nova Scotia’s rate is still comparatively modest next to foreign-buyer taxes in B.C. and Ontario, and questioned how much of a dent a small non-resident-ownership share (roughly 3.6โ€“4%) can really make (CBC News).

  • Rural communities flagged concerns the administrative tweak doesn’t resolve. Richmond County council, in the Strait of Canso area, wrote to the Province and the Nova Scotia Federation of Municipalities warning the tax increase could hurt local housing markets and discourage former Nova Scotians from returning home (CBC News) a concern about the rate and reach of the tax, not its filing deadlines.

  • The tax’s own revenue has already underperformed estimates. Nova Scotia’s Public Accounts noted deed transfer tax revenue came in $1.3 million (10.5%) below estimate in a recent fiscal year, attributed to lower market values on properties bought by non-residents. Extending the refund window to two years adds more delay and uncertainty to an already unpredictable revenue line, without addressing why non-resident purchase activity, and the tax base itself, has been softer than forecast.

What This Means for Our Clients

For anyone we’re working with who’s buying here while still living elsewhere with a genuine plan to relocate: this is unambiguously good news. A full year (instead of six months) to establish residency, clearer rules on extensions for things like construction delays, and a two-year refund window all reduce the odds of getting caught by the tax on a technicality rather than genuine intent. The inheritance exemption is also a meaningful, welcome fix for families dealing with an estate.

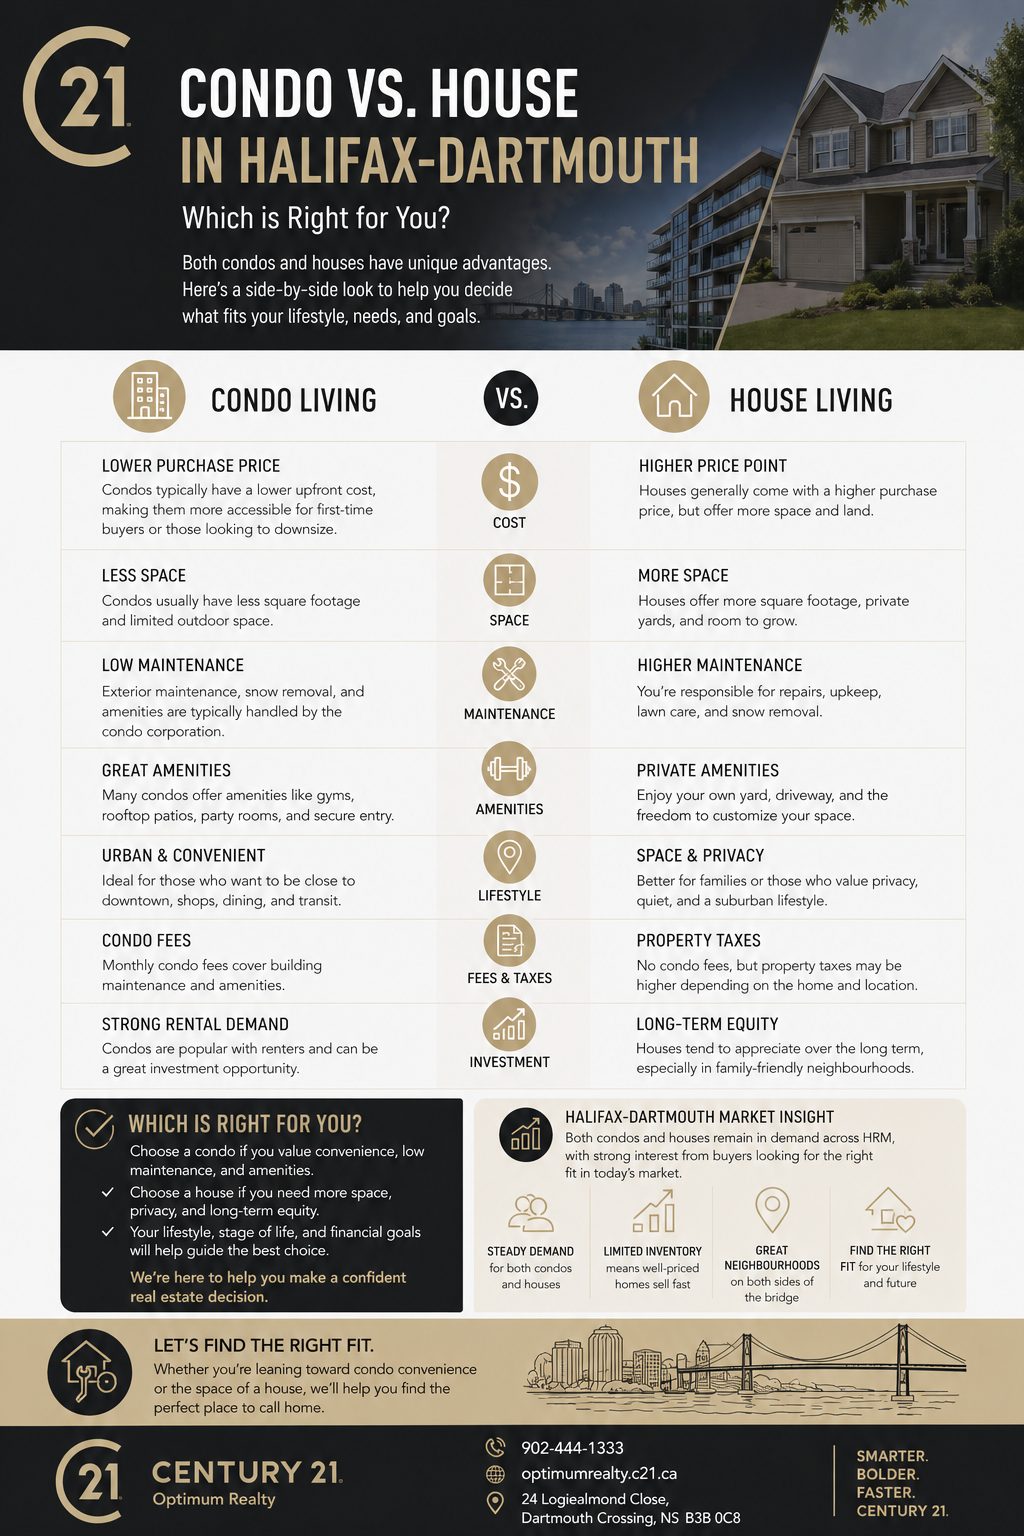
If you’re one of these relocating buyers, it’s worth pairing this extra breathing room with the rest of your financing homework. Our guide to understanding the 2026 mortgage stress test walks through what lenders will actually qualify you for, and if this is your first home in the province, our breakdown of how to stack federal and provincial first-time buyer programs and Nova Scotia’s 2% down payment program can meaningfully offset the extra costs of a move. And if you’re weighing a condo against a single-family home once you land here, our condo vs. house comparison for Halifax-Dartmouth is a good next read. You can also get a sense of what a comparable property might cost you by browsing our current listings, and if you’re selling a Nova Scotia property as part of your move, a free home valuation is a quick way to see where you stand.

For clients who were hoping this signalled a rollback of the 10% rate itself, it doesn’t. If cost, not paperwork, was the deciding factor for a non-resident buyer, this change won’t move them off the fence.

Bottom Line

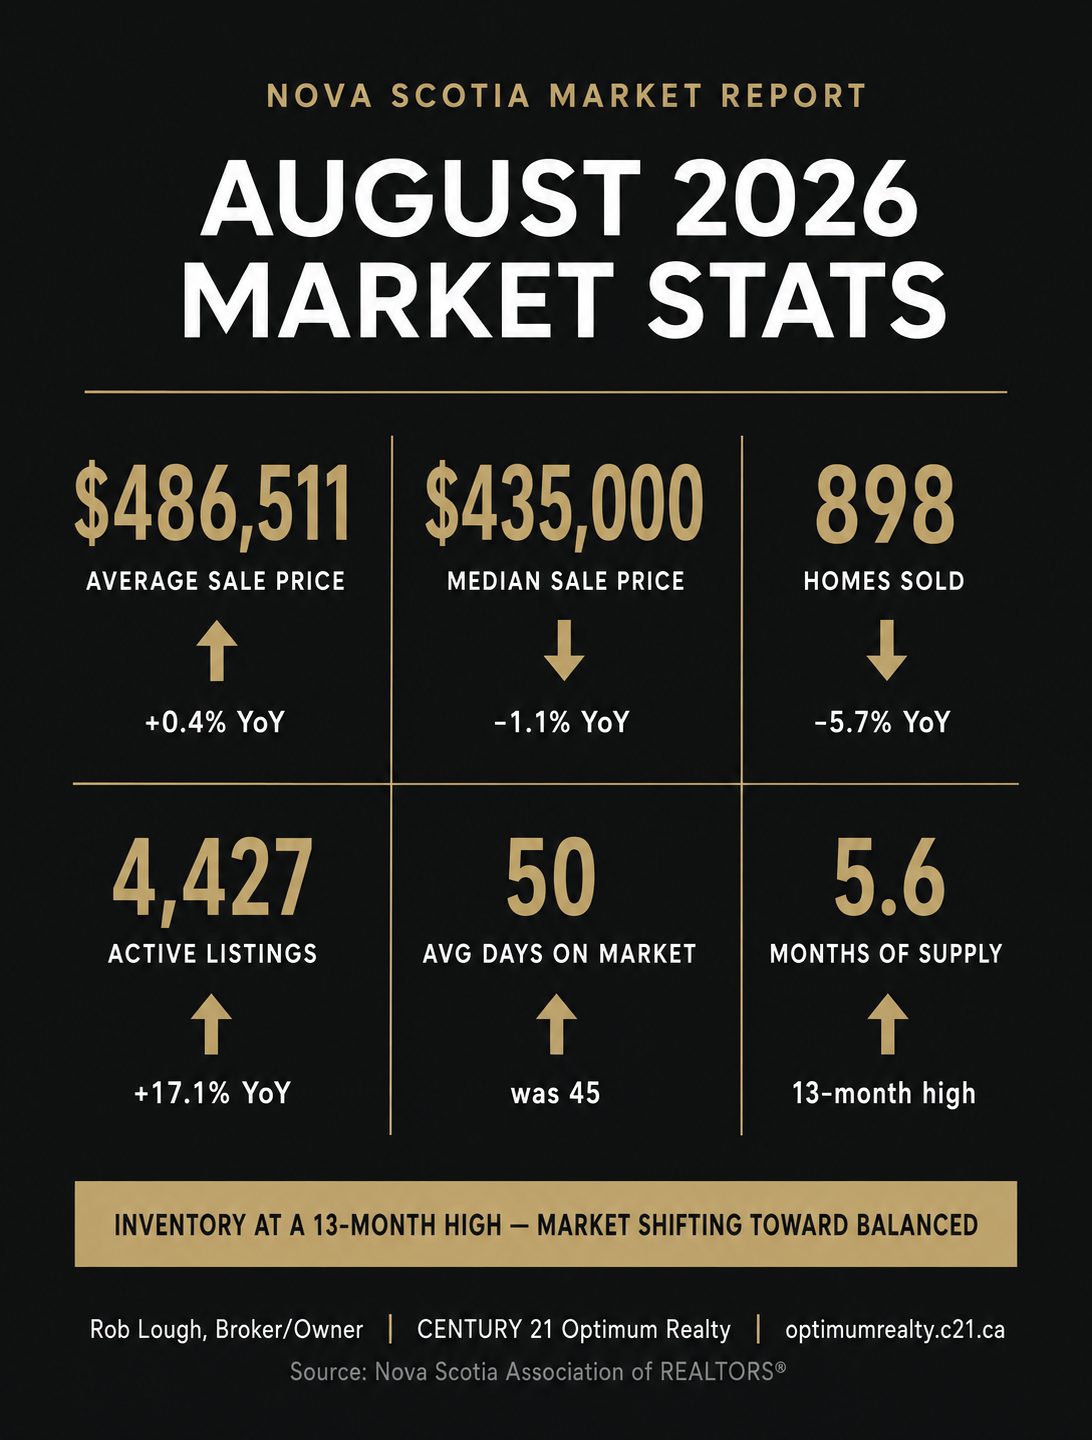
Judged against where our market sits today, months of supply at a 13-month high, prices easing, homes taking longer to sell, easing the administrative side of this tax is a reasonable, fairly low-risk move that responds to years of legitimate complaints about rigid deadlines, without reopening the much bigger fight over the rate itself. Whether it’s “the right call” really depends on what you think the tax is for: if the goal is fairness and reducing unnecessary friction for genuine movers, this is a clear improvement. If the goal is meaningfully helping affordability and supply for Nova Scotians, the evidence and expert commentary above suggest the administrative tweaks are unlikely to be the difference-maker, the rate and design of the tax, which several economists and industry voices say targets a small and possibly not-that-impactful slice of the market, remain exactly as they were.

Related reading from Century 21 Optimum Realty:

Sources:

Uncategorized โ€ข 1 August 2026

Nova Scotia Real Estate Market Statistics July 2026

Nova Scotia Real Estate Market Statistics July 2026

By Rob Lough, Broker/Owner | Century 21 Optimum Realty | August 1, 2026

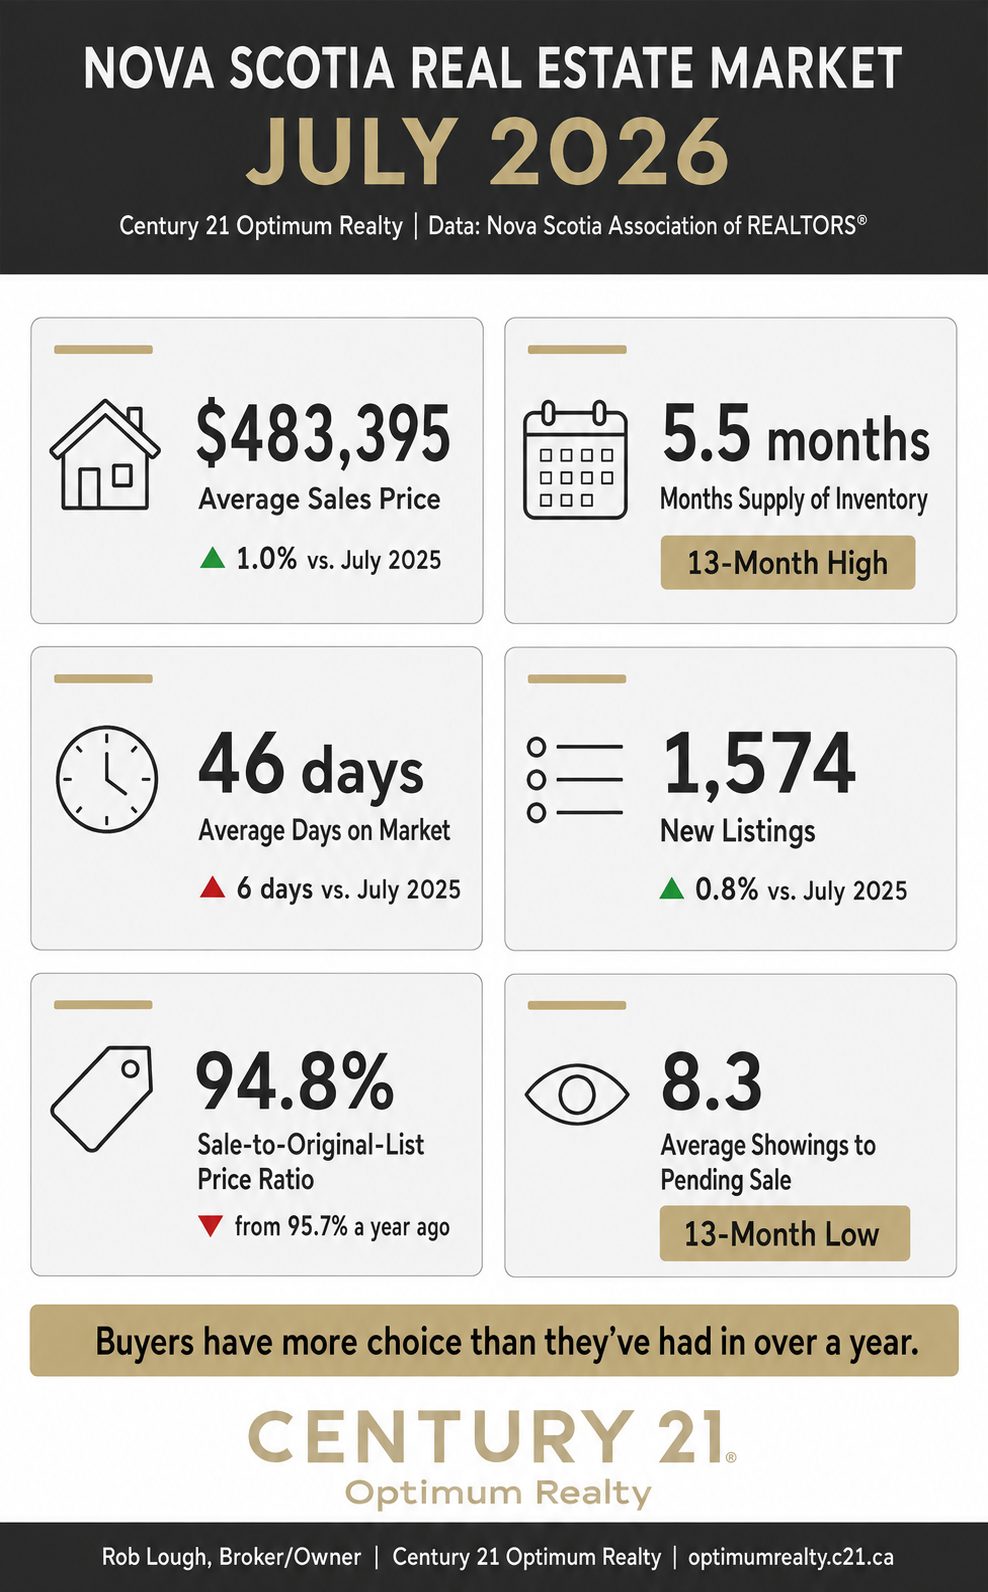
Nova Scotia’s housing market continued its gradual move toward balance in July 2026. Data from the Nova Scotia Association of REALTORSยฎ shows months supply of inventory at its highest level in over a year, prices easing back from the spring peak, and list-price ratios softening further in buyers’ favour. The market isn’t cooling sharply, it’s normalizing. Whether you’re buying or selling, understanding these trends matters. At Century 21 Optimum Realty, we track these numbers every month so you can make informed decisions.


Months Supply Hits a 13-Month High: 5.5 Months

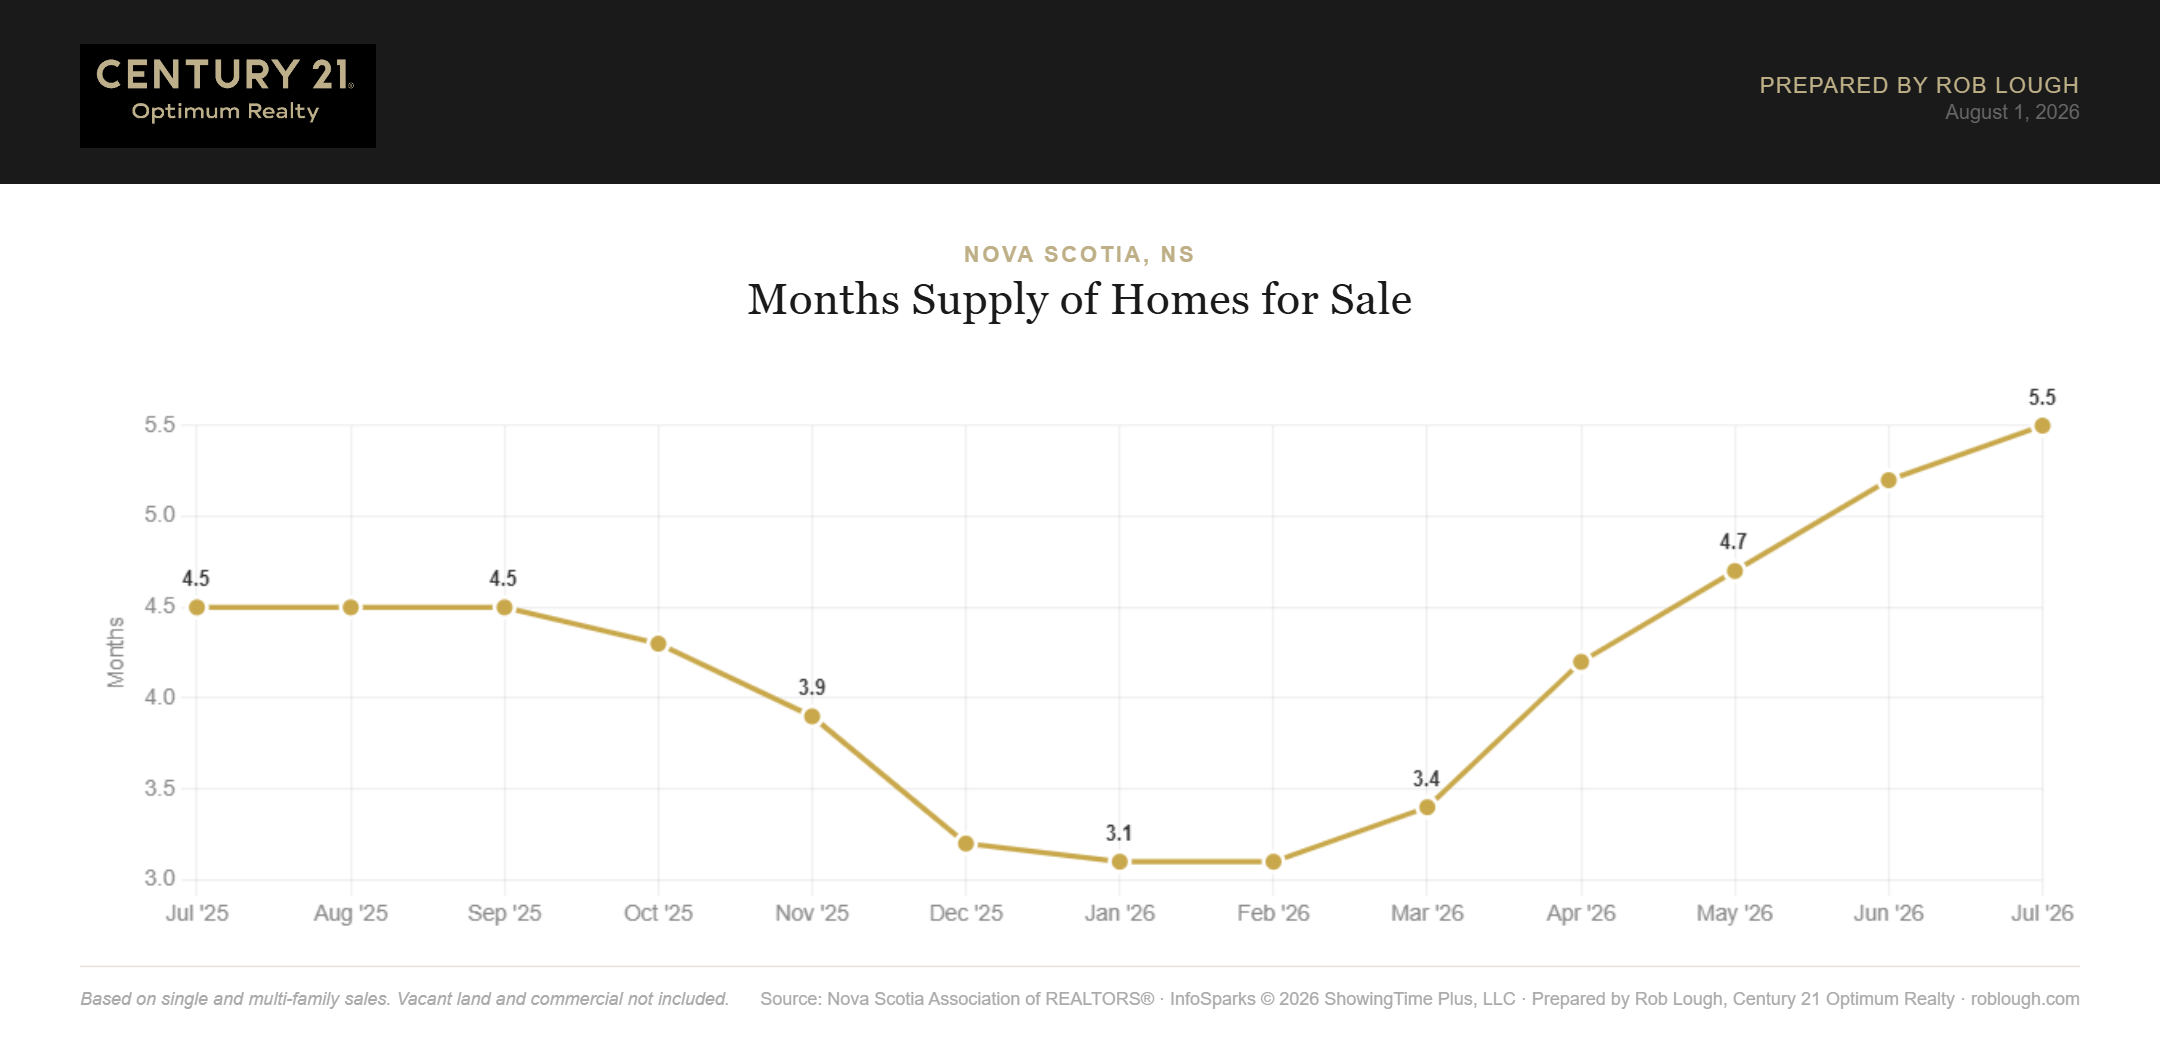
Months supply of homes for sale rose to 5.5 months in July 2026, up from 5.2 in June and well above July 2025’s 4.5 months. That’s the highest reading in the trailing 13 months and puts Nova Scotia right at the doorstep of the 6-month threshold that typically defines a balanced market.

For context, months supply bottomed at 3.1 back in January and February 2026. In six months, buyers have gone from picking through scraps to having genuinely more choice and more time to decide. If you’re considering a purchase, our team at Century 21 Optimum Realty can help you understand what this shift means for negotiating power in your target neighbourhood.

Nova Scotia Real Estate Market Statistics July 2026 Months Supply of Inventory

Nova Scotia Real Estate Market Statistics July 2026 Months Supply of Inventory


New Listings Ease From the Spring Pace

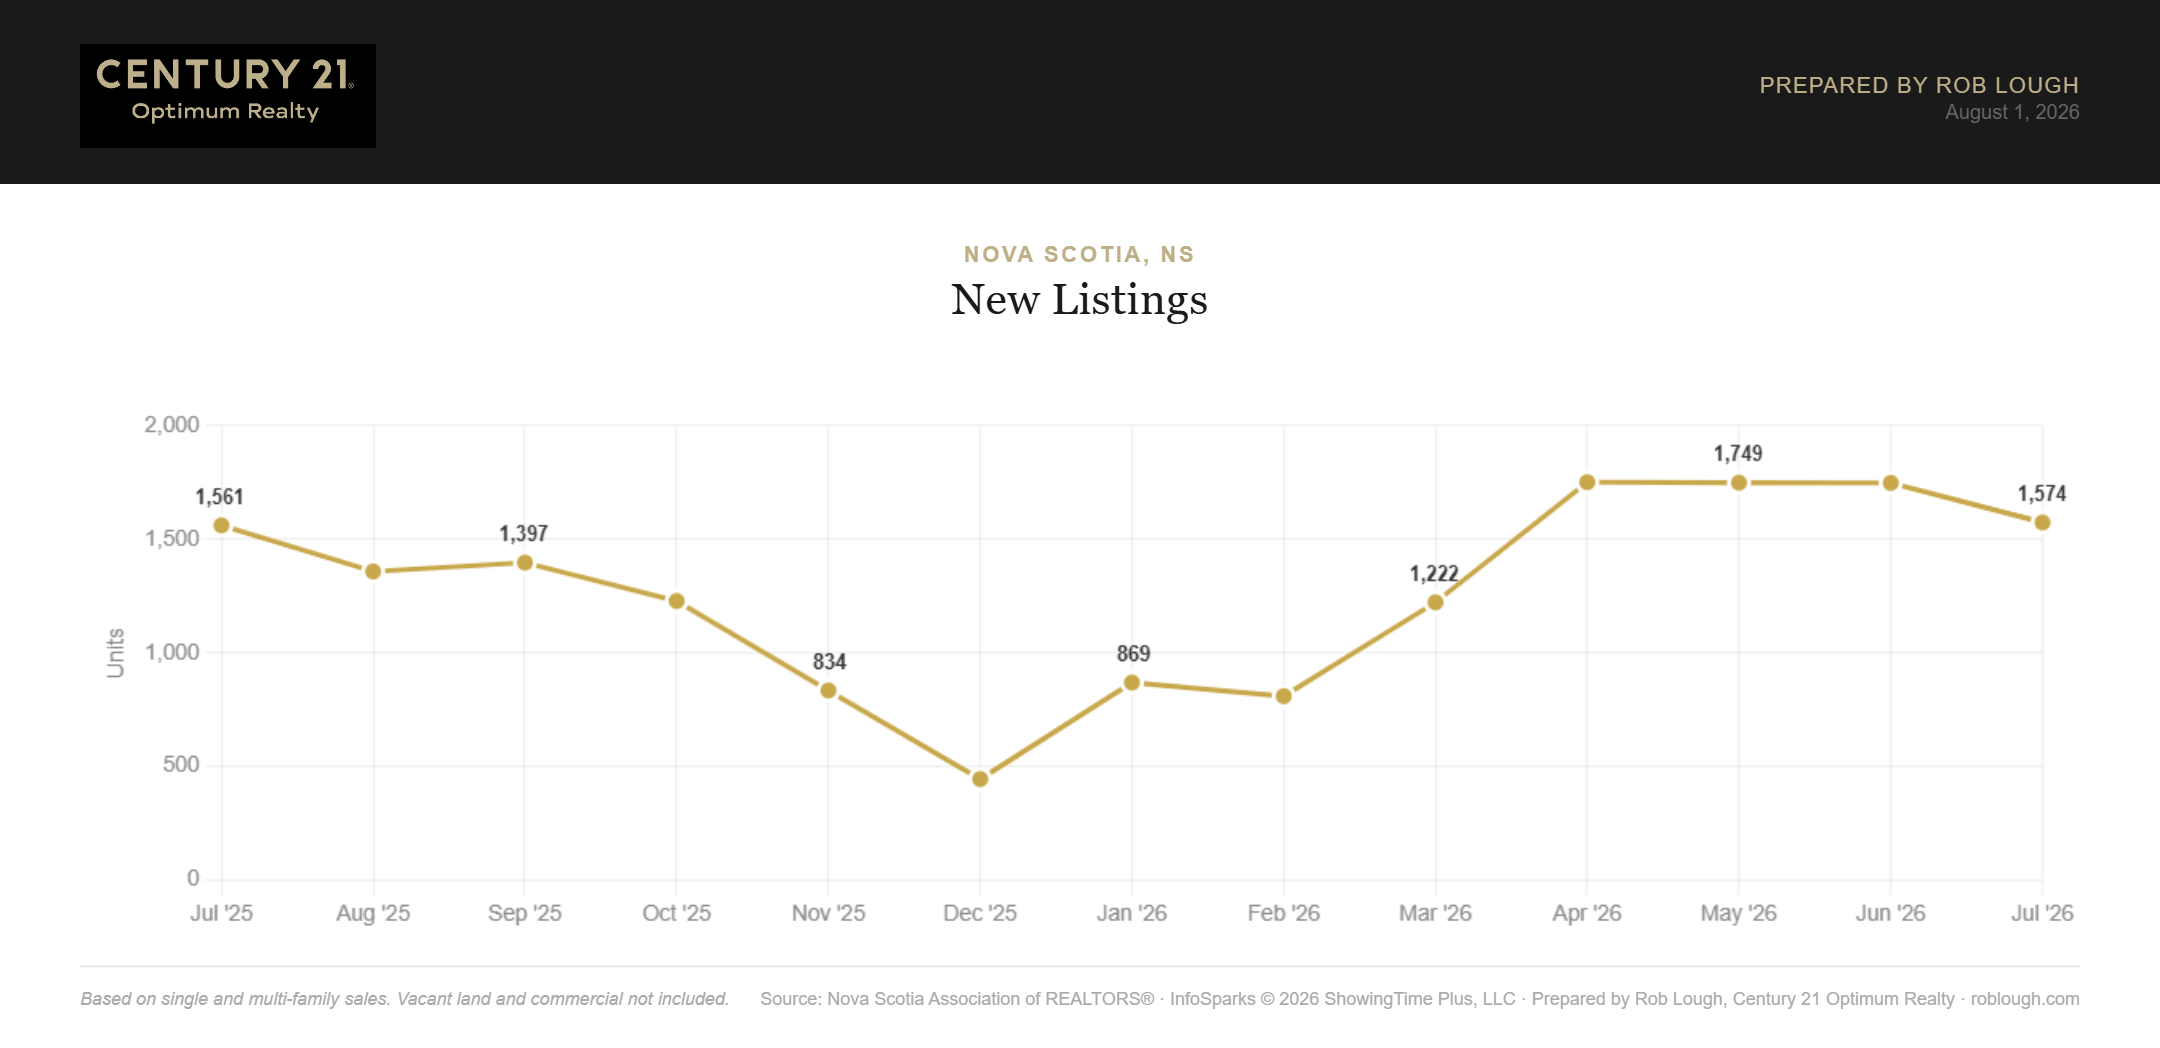
New listings came in at 1,574 in July, down 10.0% from June’s 1,748 but essentially flat against July 2025’s 1,561 (up 0.8%). Spring’s listing surge, April, May and June all landed near 1,750, has settled back to a normal summer rhythm.

That matters for supply: with new inventory tapering while months supply keeps climbing, the build-up in available homes is being driven more by slower absorption than by a flood of new listings. Browse current Nova Scotia listings with our team.

Nova Scotia Real Estate Market Statistics July 2026 Number of new listings

Nova Scotia Real Estate Market Statistics July 2026 Number of new listings


Prices Pull Back From June, Still Up Year-Over-Year

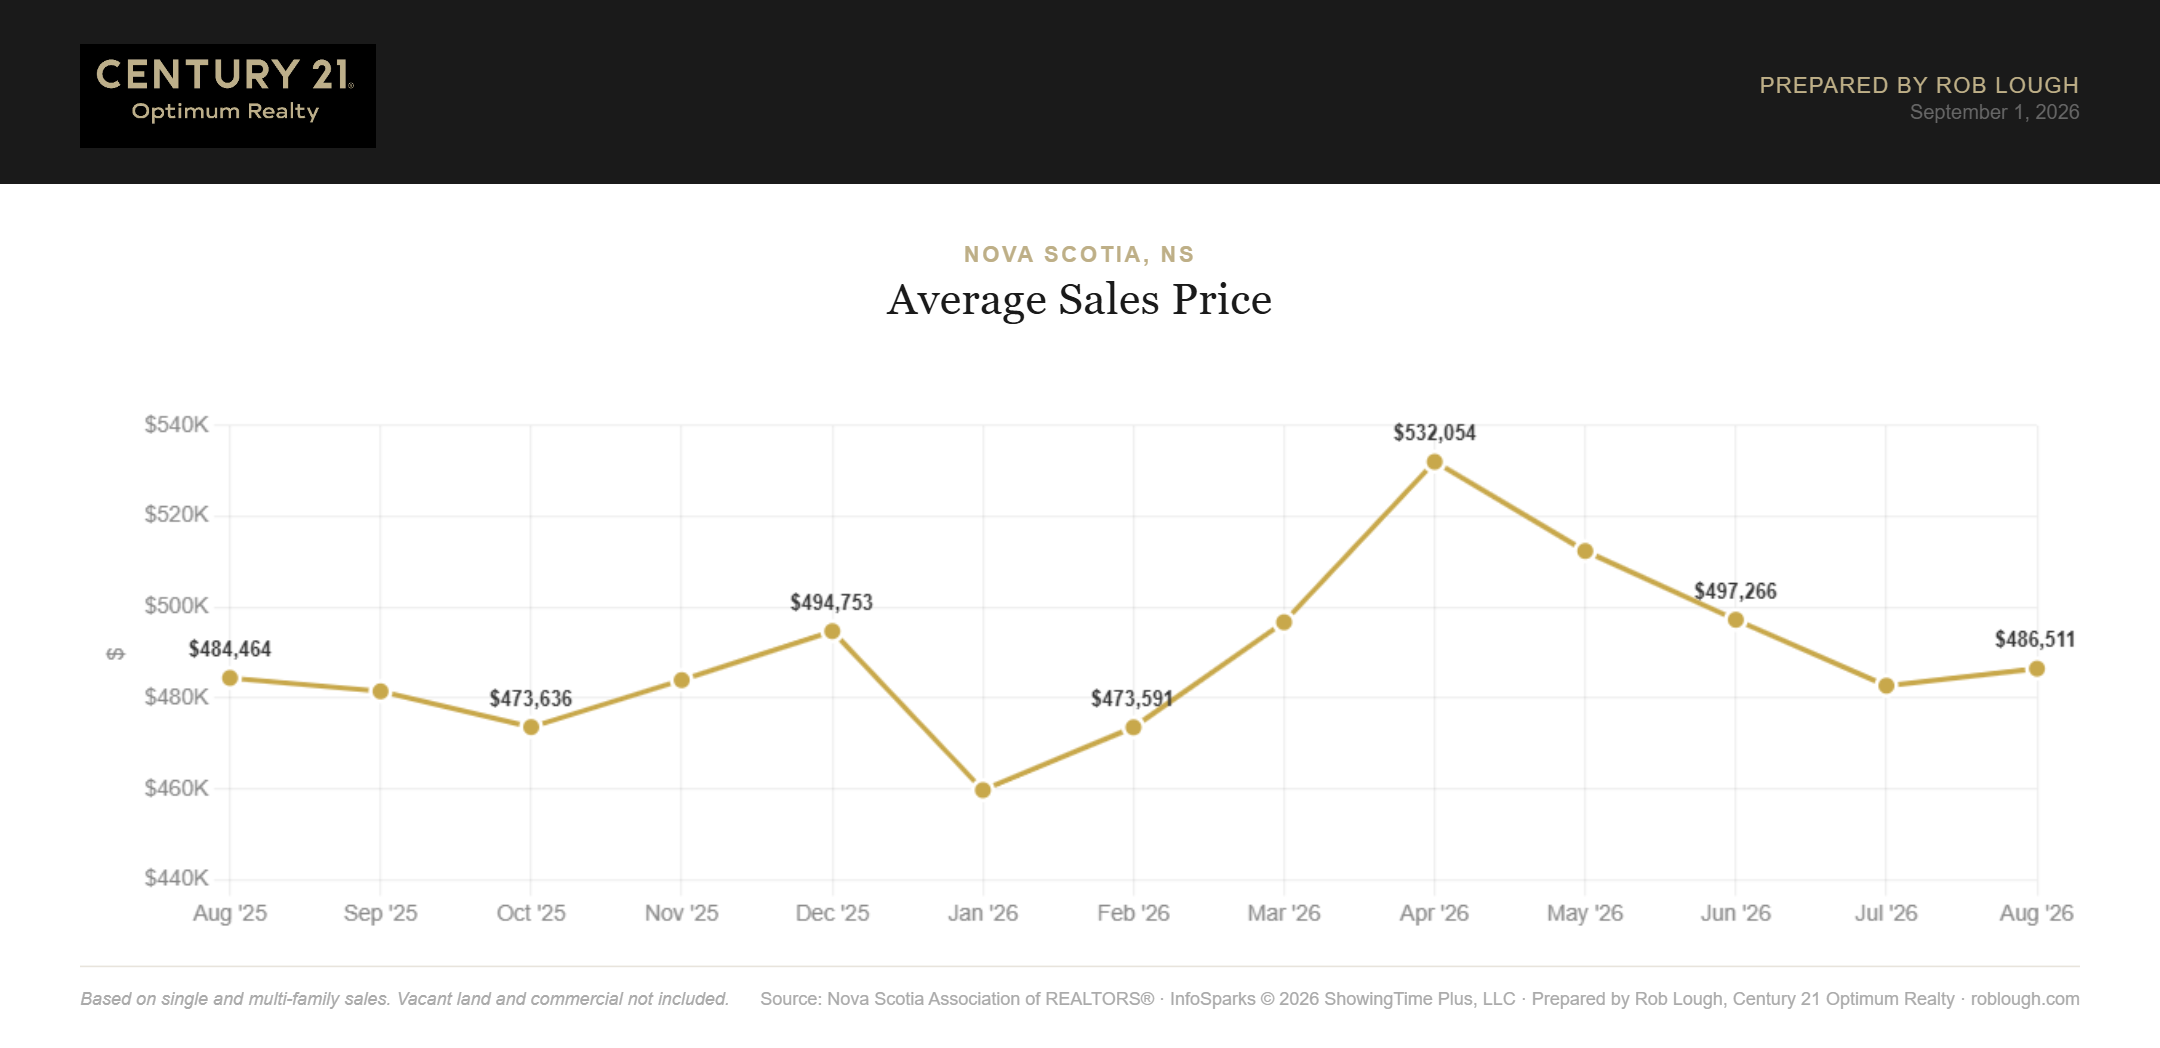
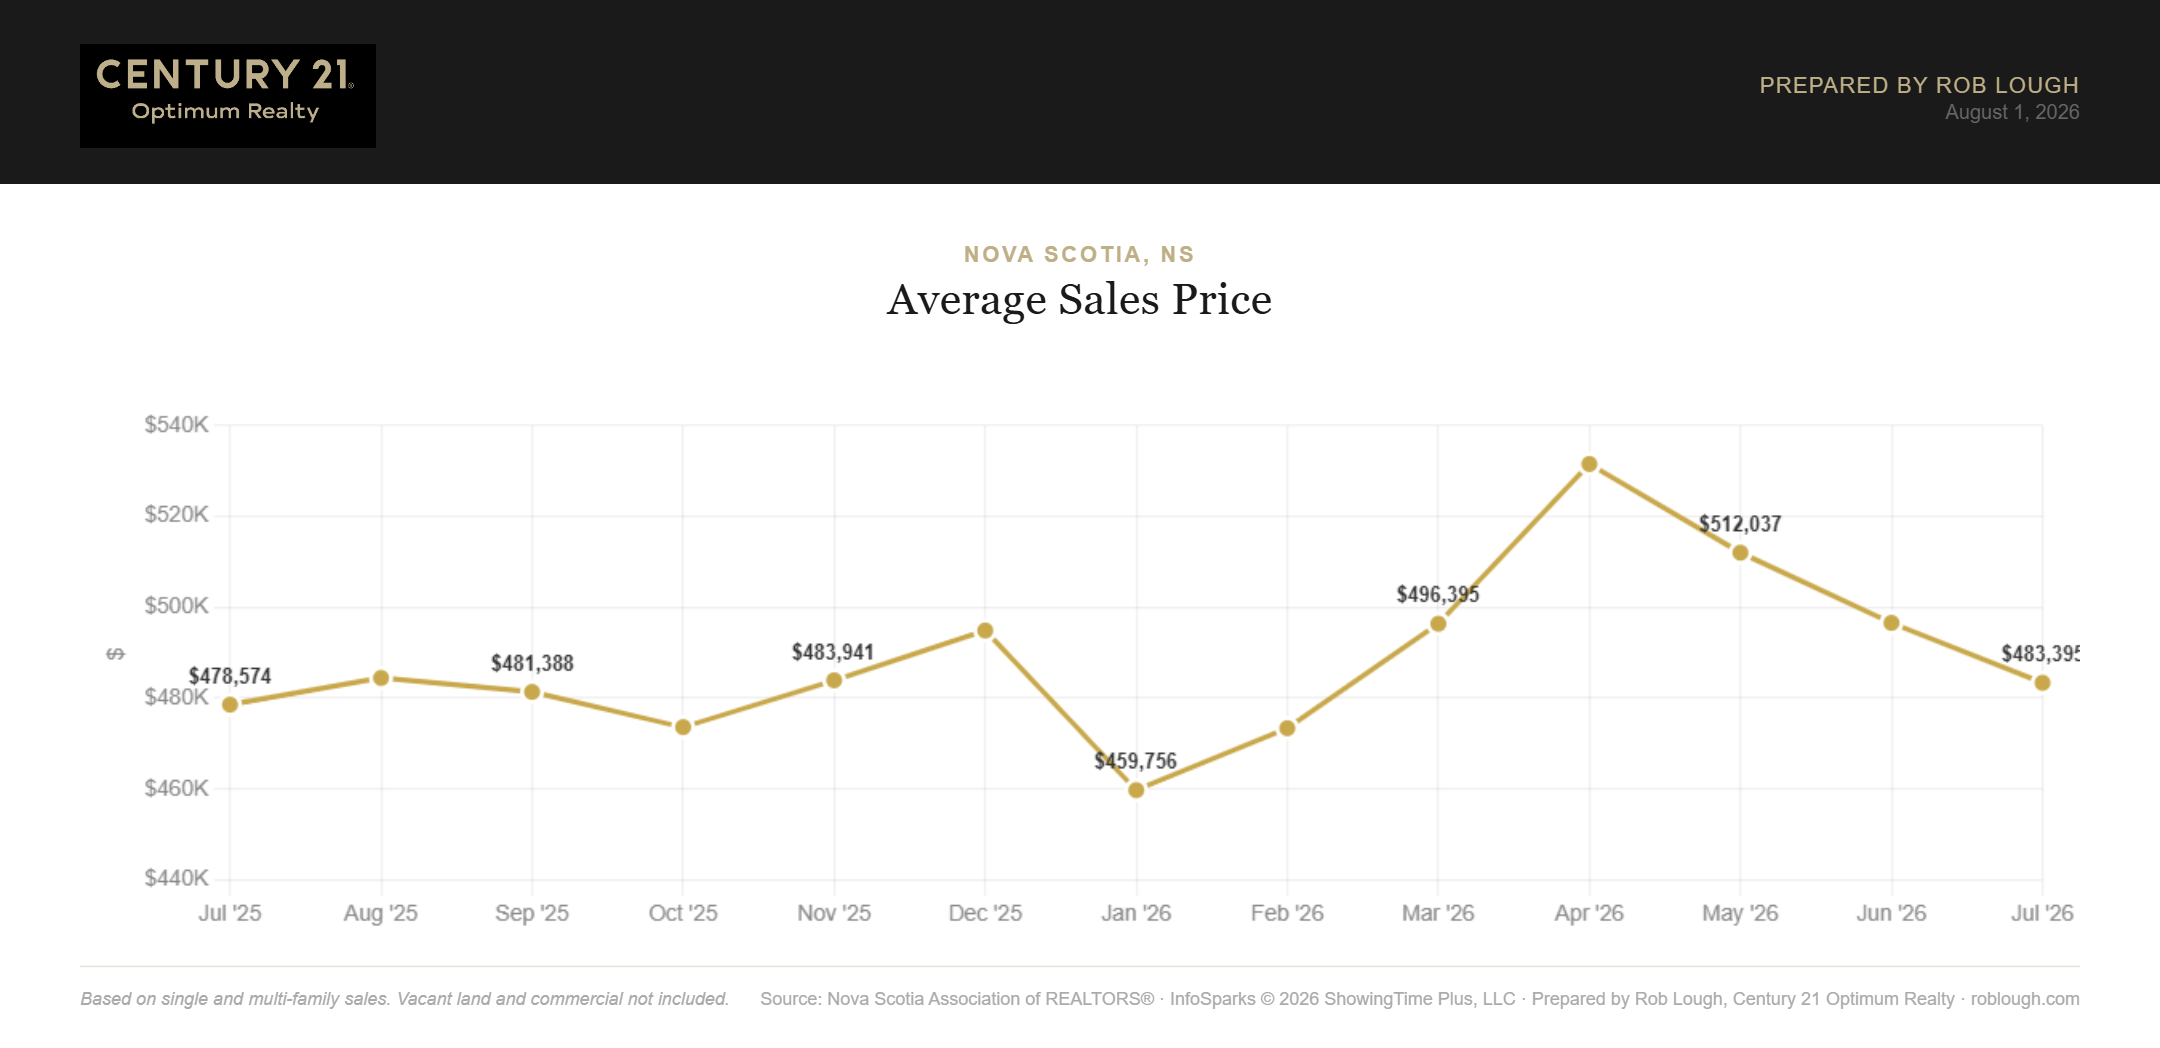
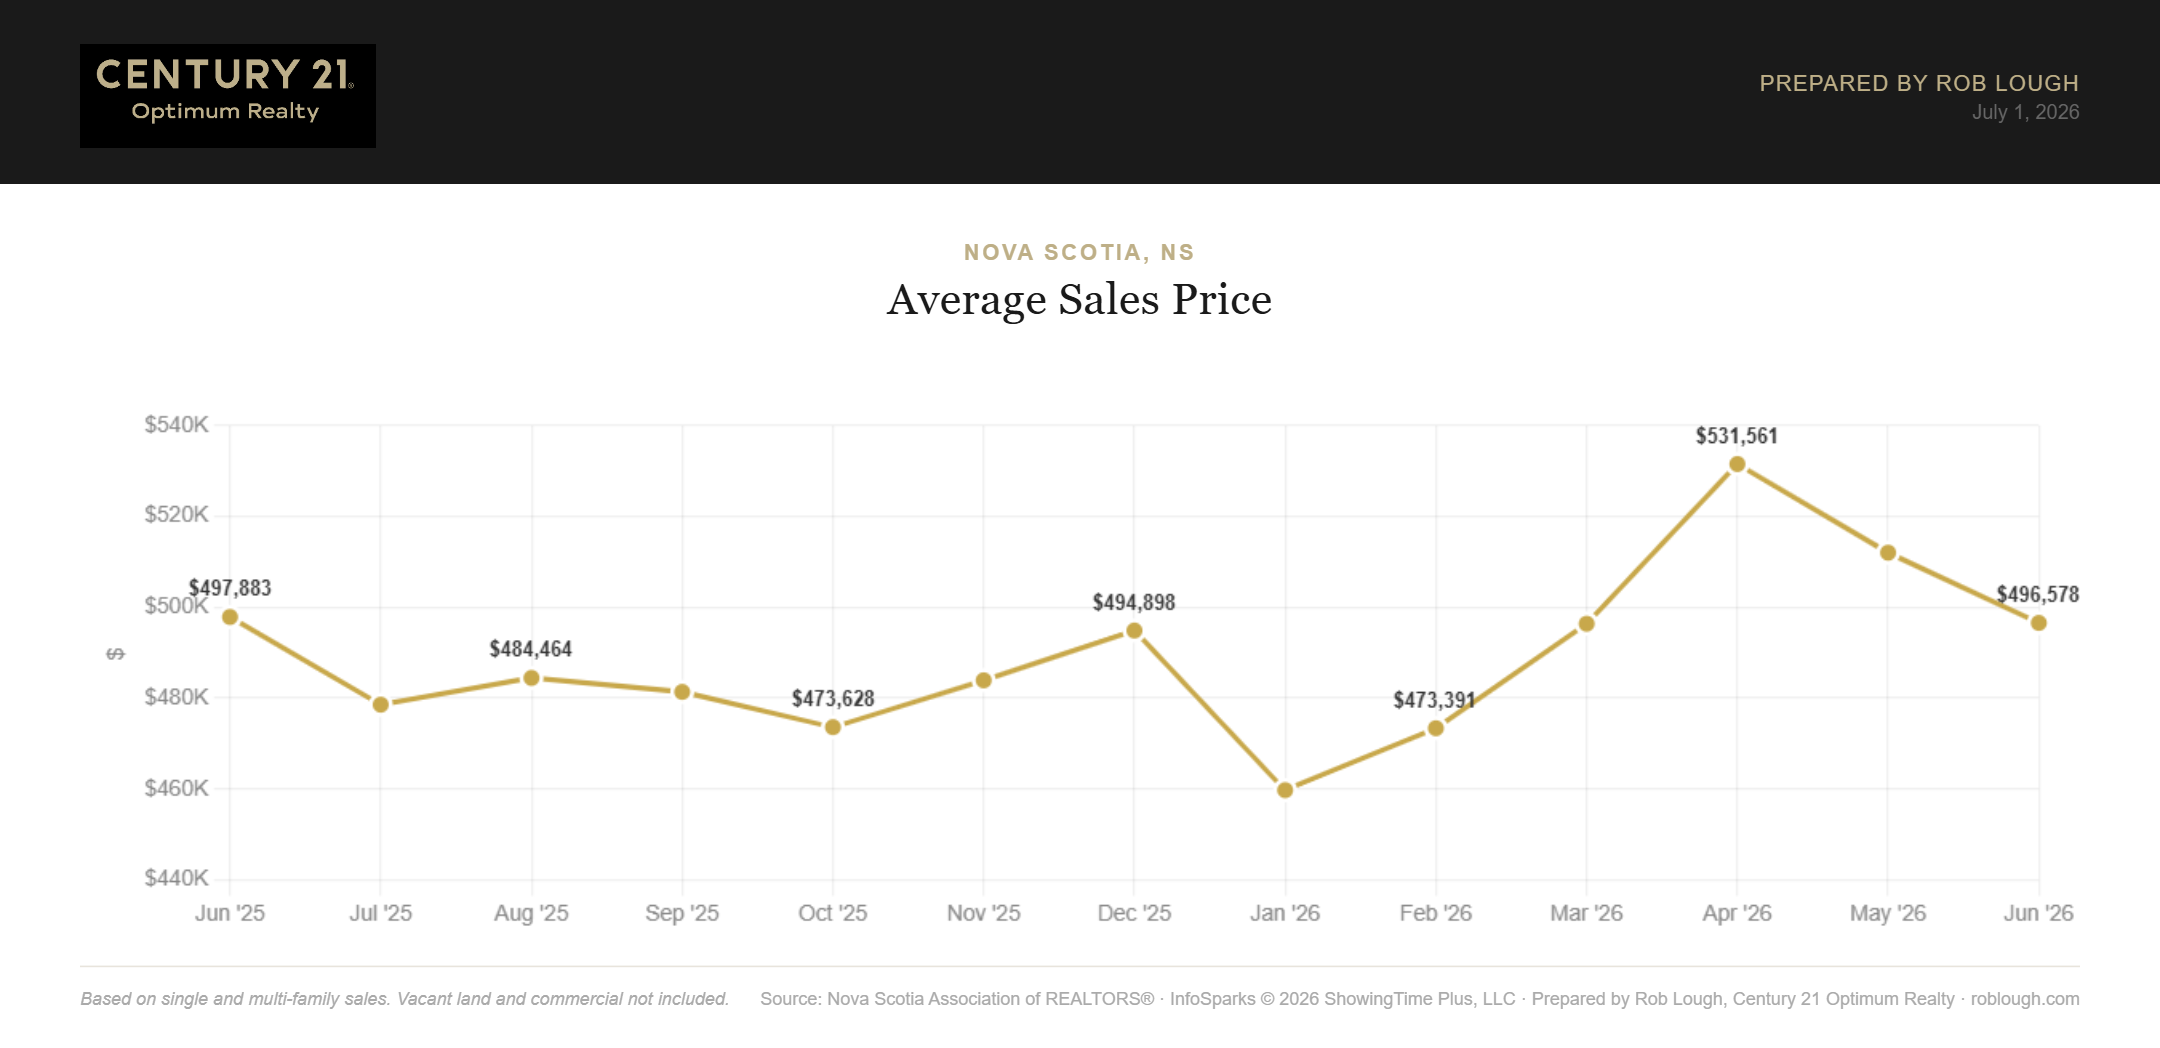
The average sales price was $483,395 in July 2026, down 2.7% from June’s $496,578 but up 1.0% from July 2025’s $478,574. Prices have now eased for two consecutive months from April’s 13-month peak of $531,561.

Nova Scotia Real Estate Market Statistics July 2026 Average Sales Price

Nova Scotia Real Estate Market Statistics July 2026 Average Sales Price

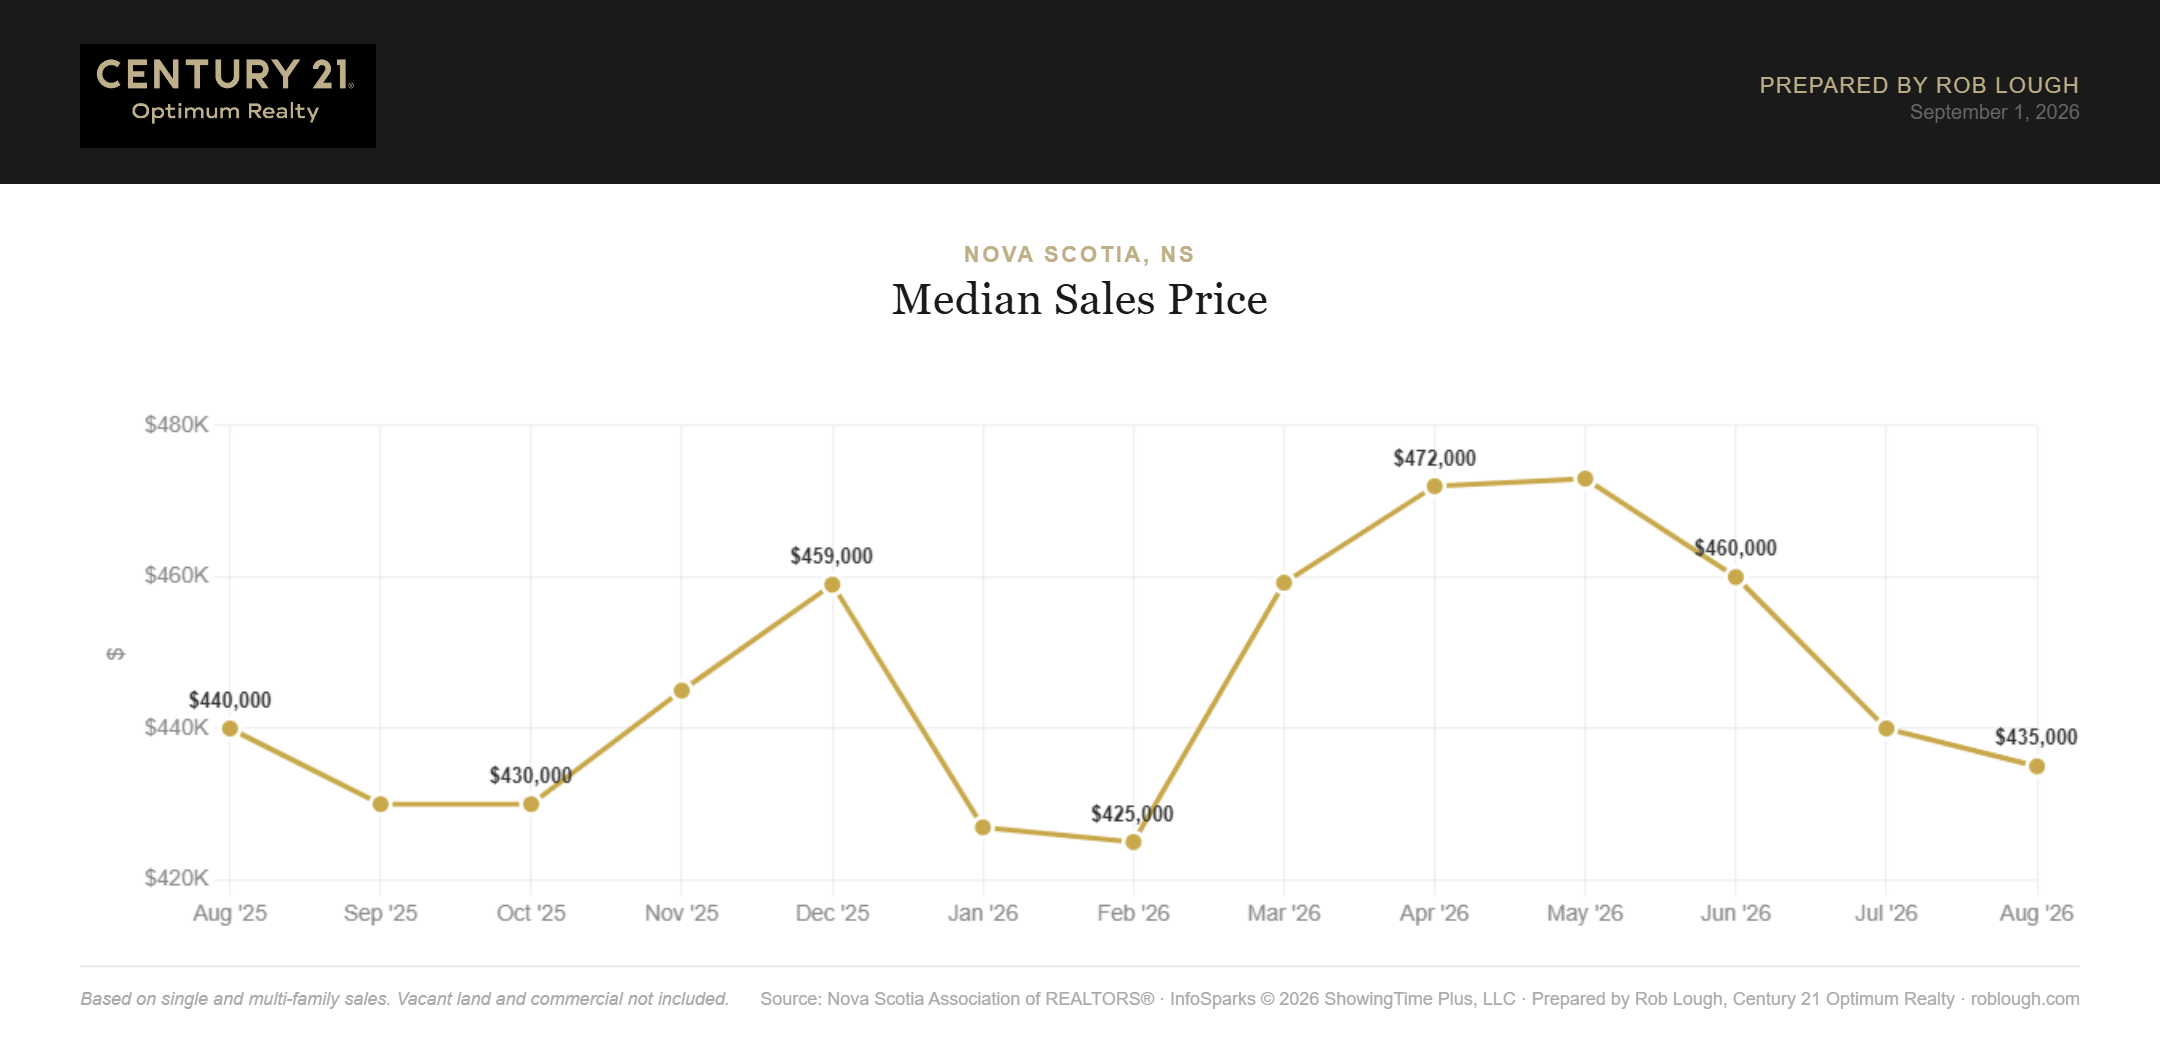
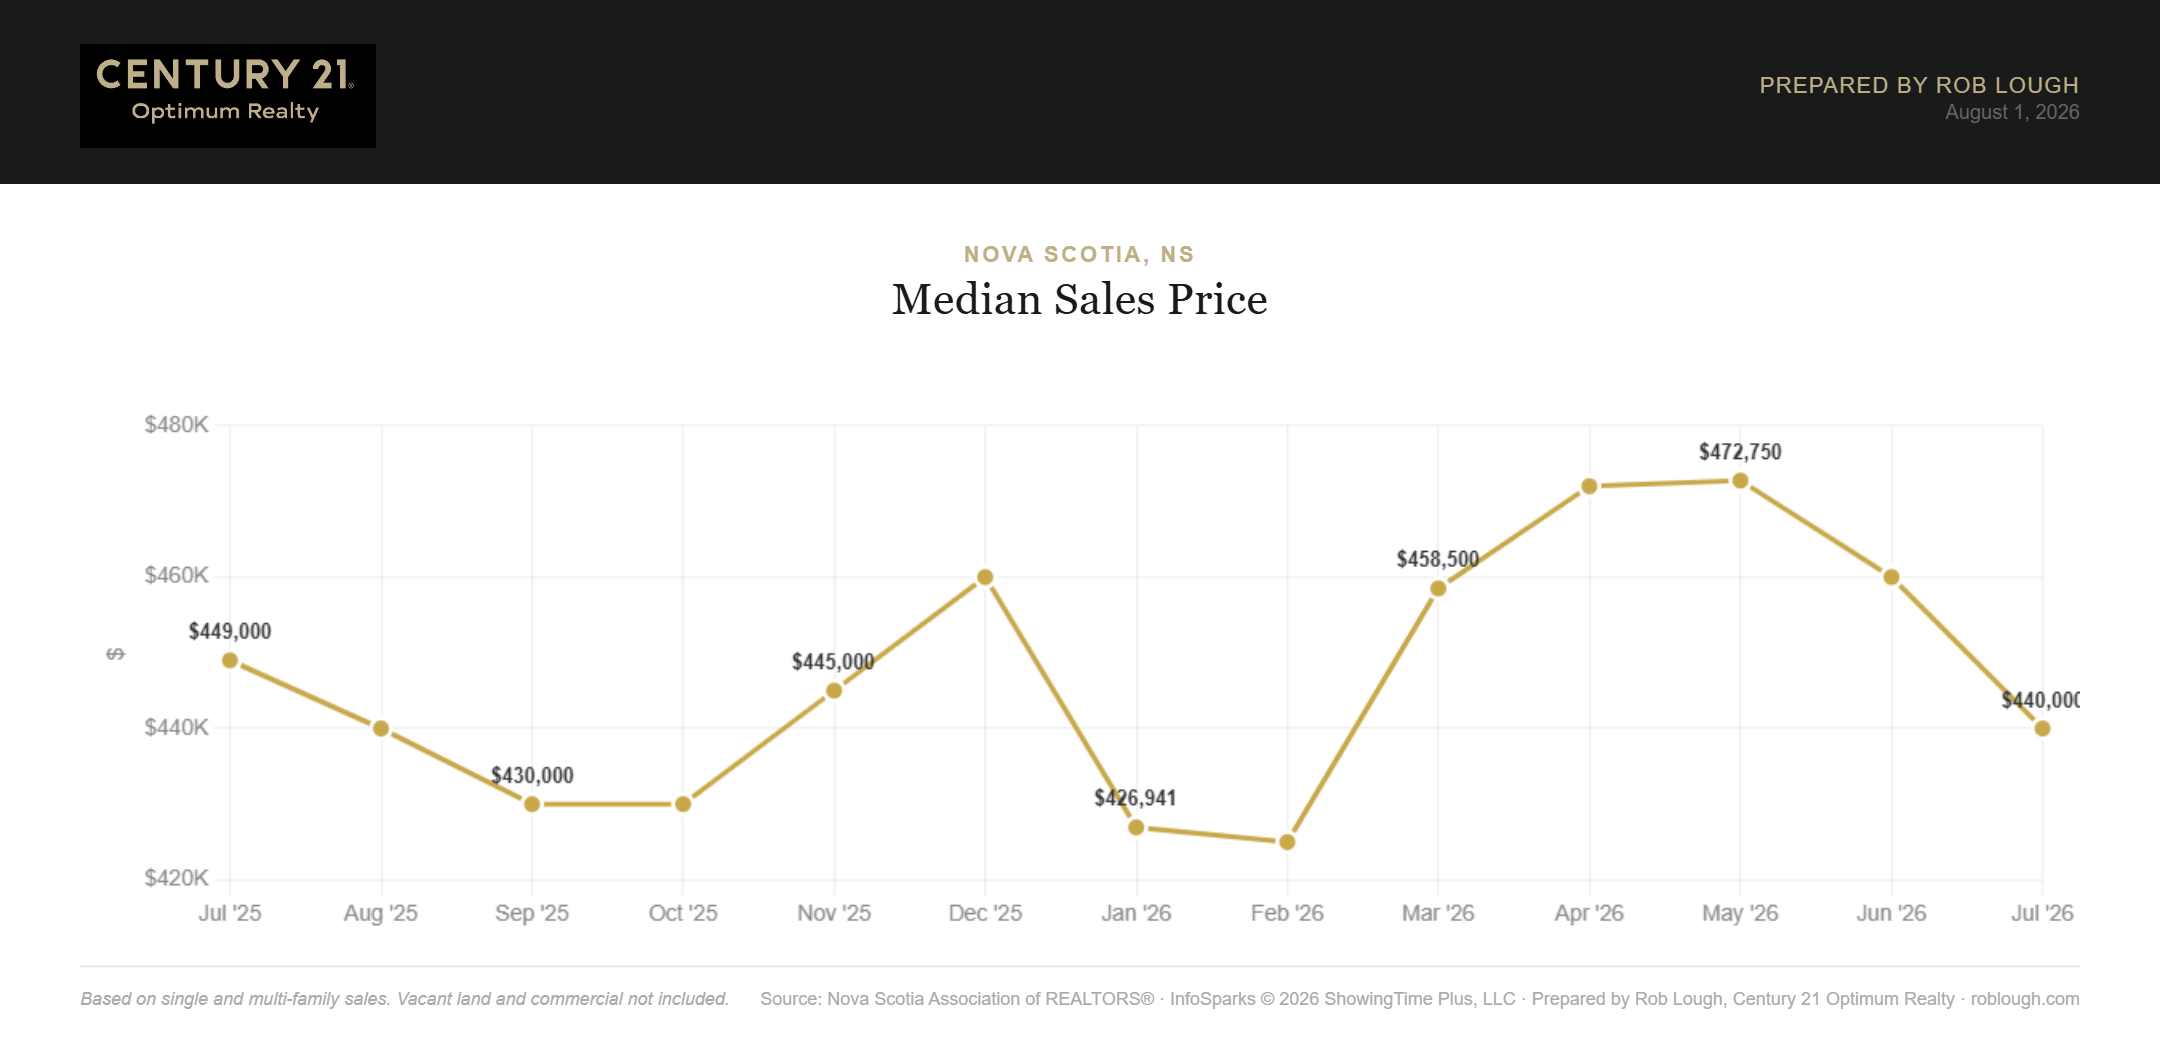
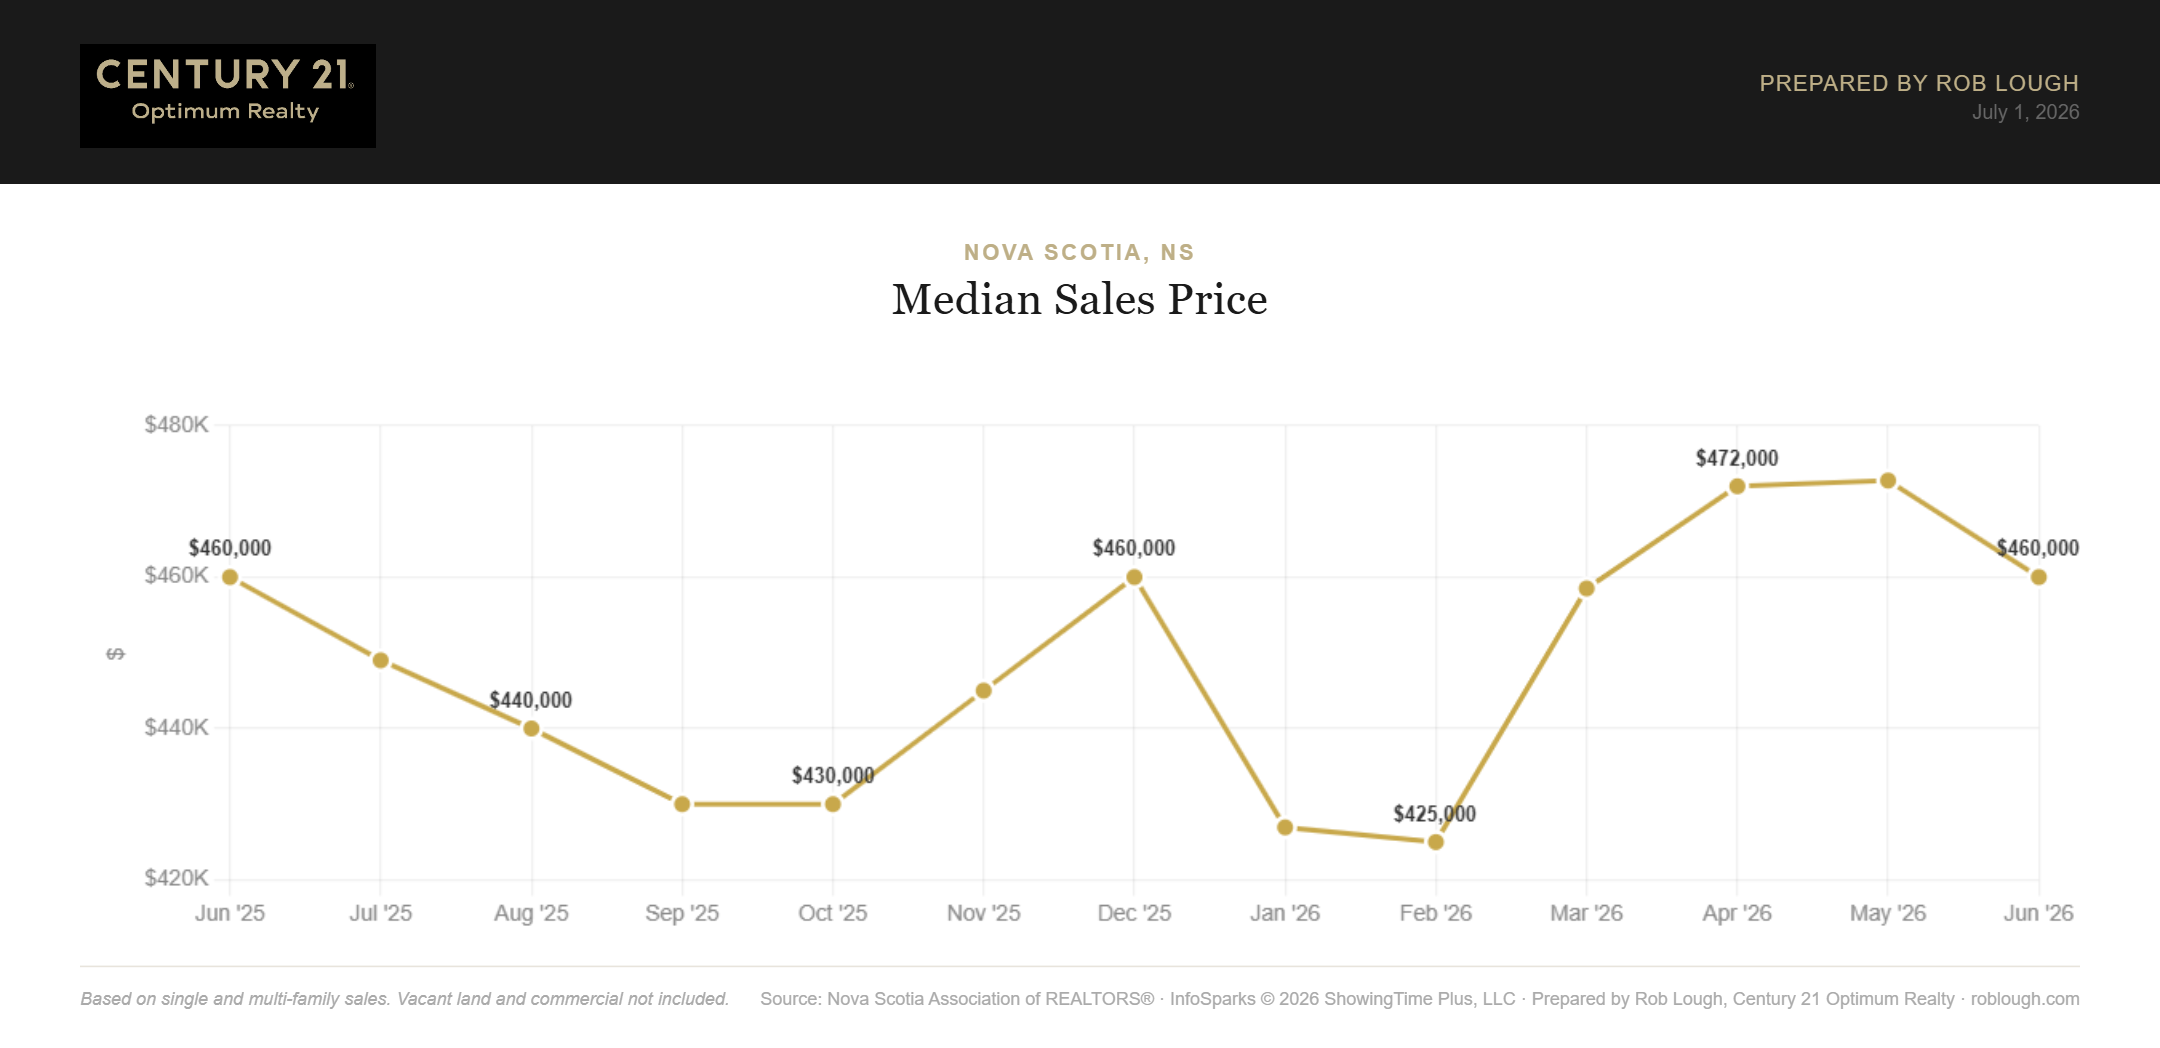
The median sales price came in at $440,000, down 4.3% from June’s $460,000 and down 2.0% from July 2025’s $449,000. The median falling faster than the average suggests the mix of homes selling has tilted somewhat toward the lower end of the market this summer. For sellers wondering what their home is worth today, connect with our team at Century 21 Optimum Realty for a current market evaluation.

Nova Scotia Real Estate Market Statistics July 2026 Median Sales Price

Nova Scotia Real Estate Market Statistics July 2026 Median Sales Price


Price Per Square Foot Holds Firm

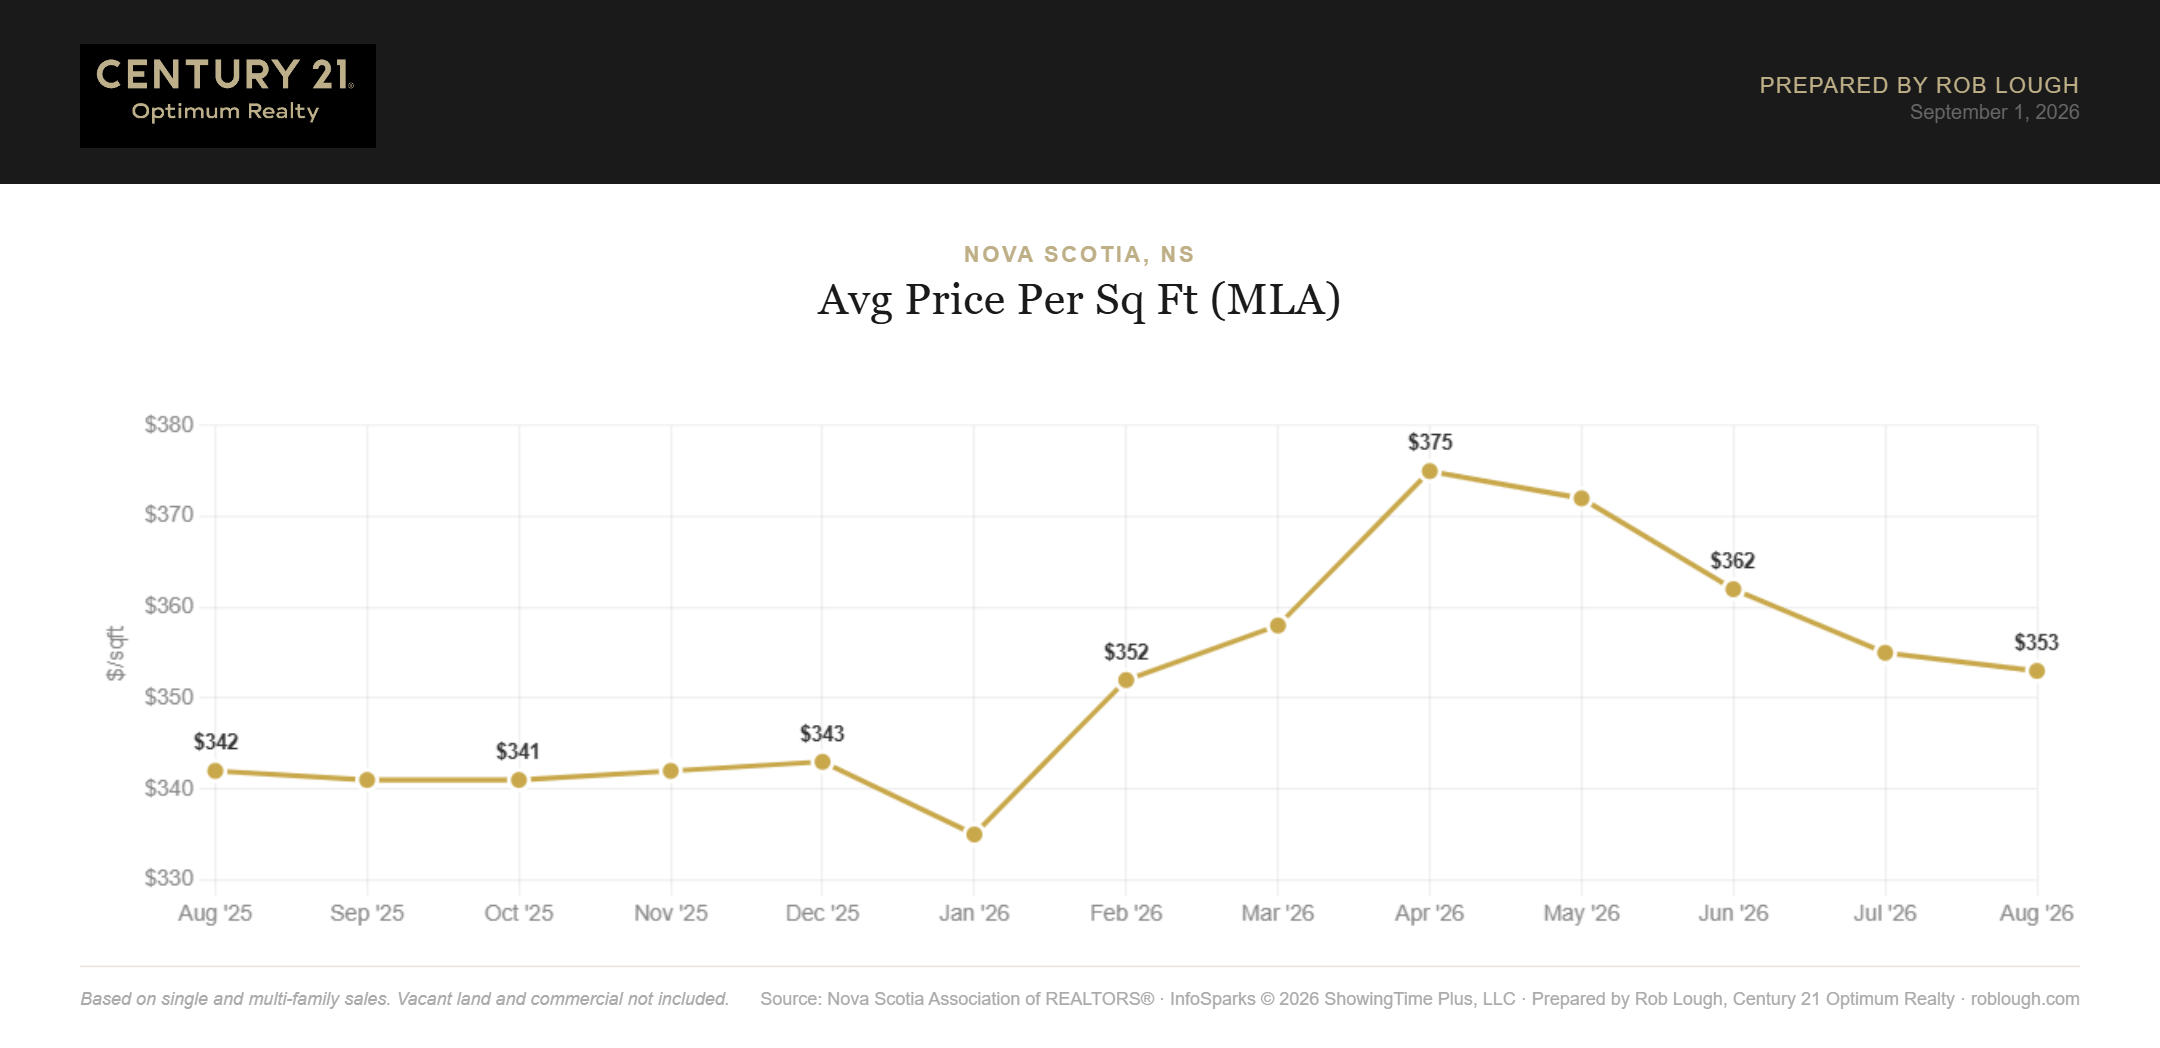
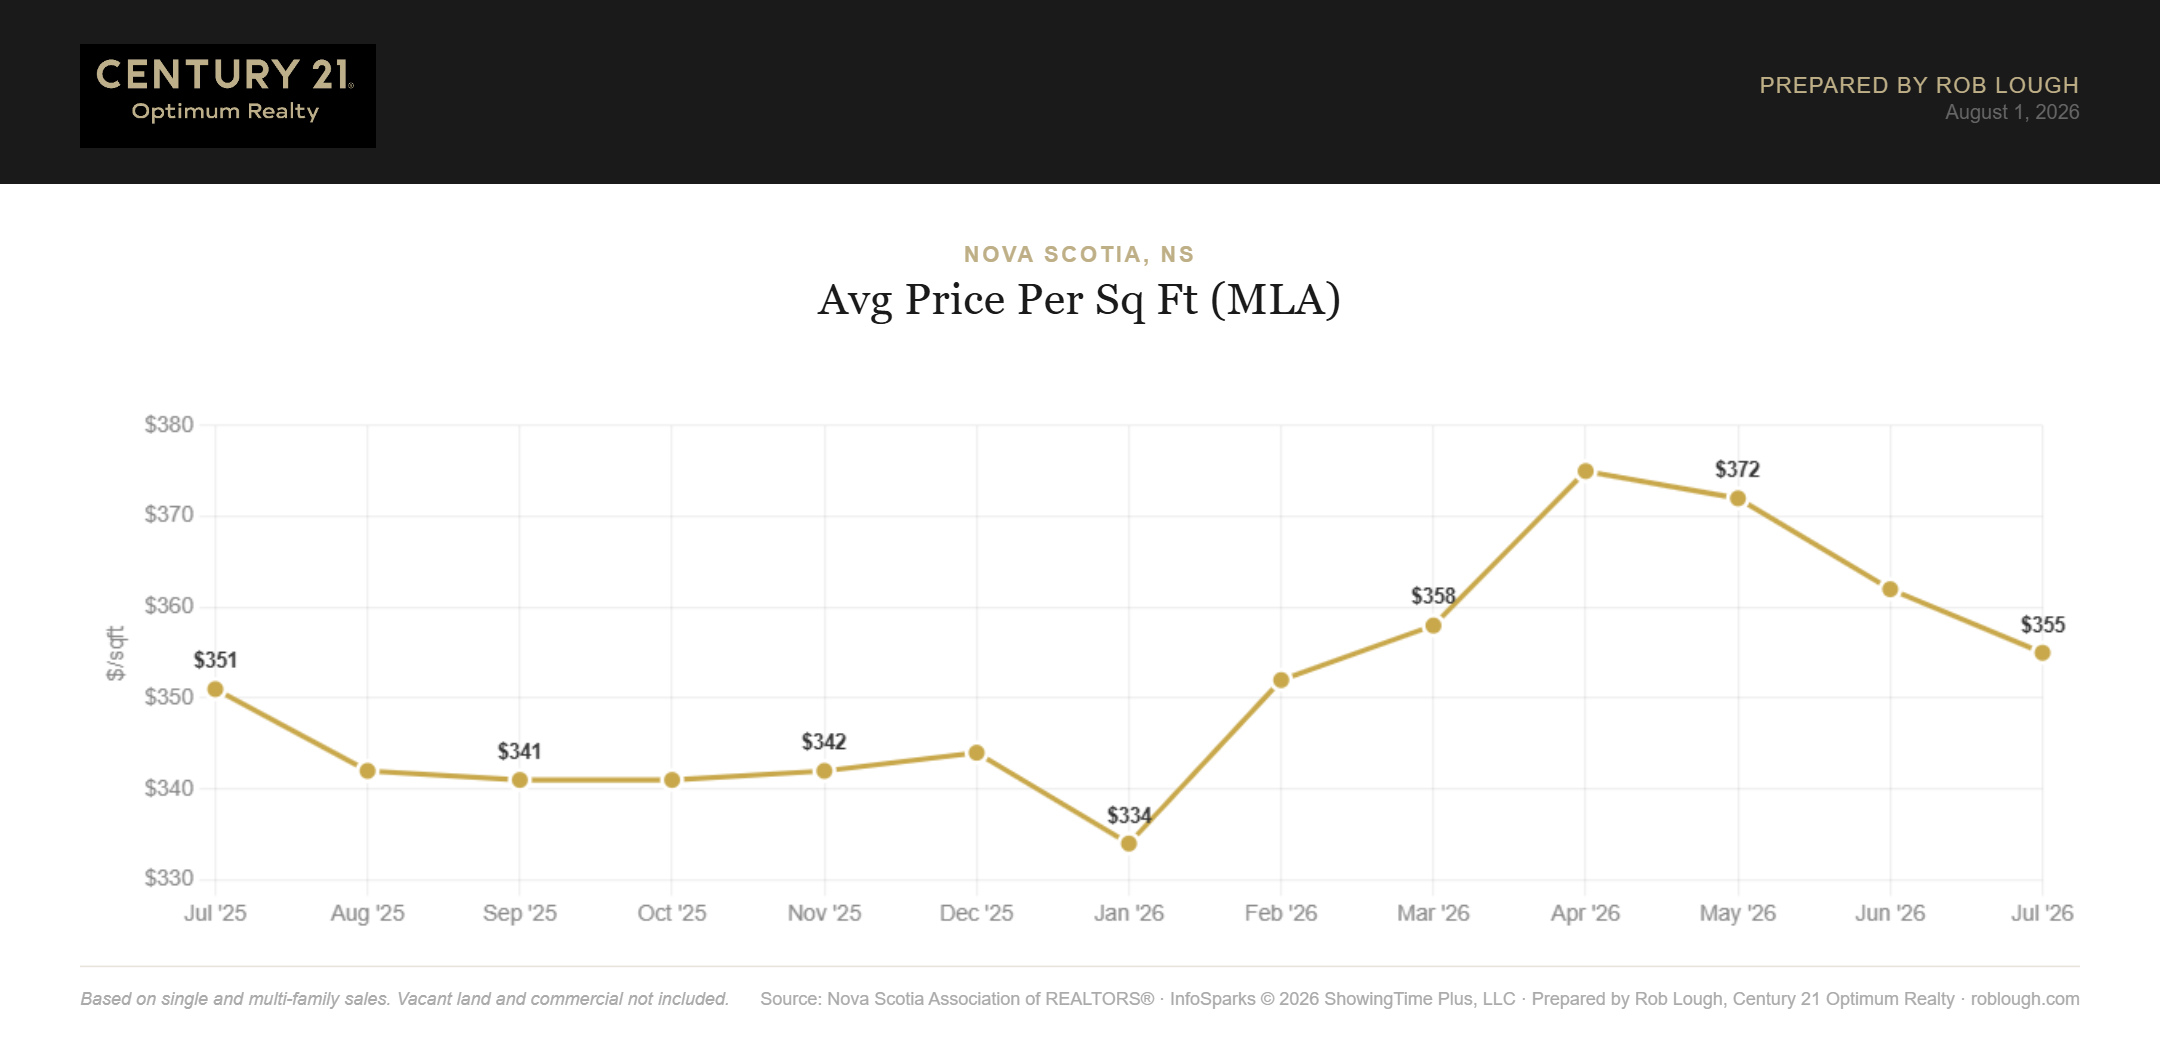
While headline prices softened, price per square foot held steady. Average price per square foot on total living area was $281 in July, essentially unchanged from June’s $280 and up 2.6% from July 2025’s $274. On main living area, it came in at $355, down from June’s $362 but still 1.1% above a year ago.

This is a useful signal: on a per-foot basis, Nova Scotia values are not declining. The softer average and median prices reflect what’s selling, not a broad drop in what homes are worth.

Nova Scotia Real Estate Market Statistics July 2026 Average Price per Square Foot

Nova Scotia Real Estate Market Statistics July 2026 Average Price per Square Foot


Dollar Volume of Closed Sales Reaches $470.8M

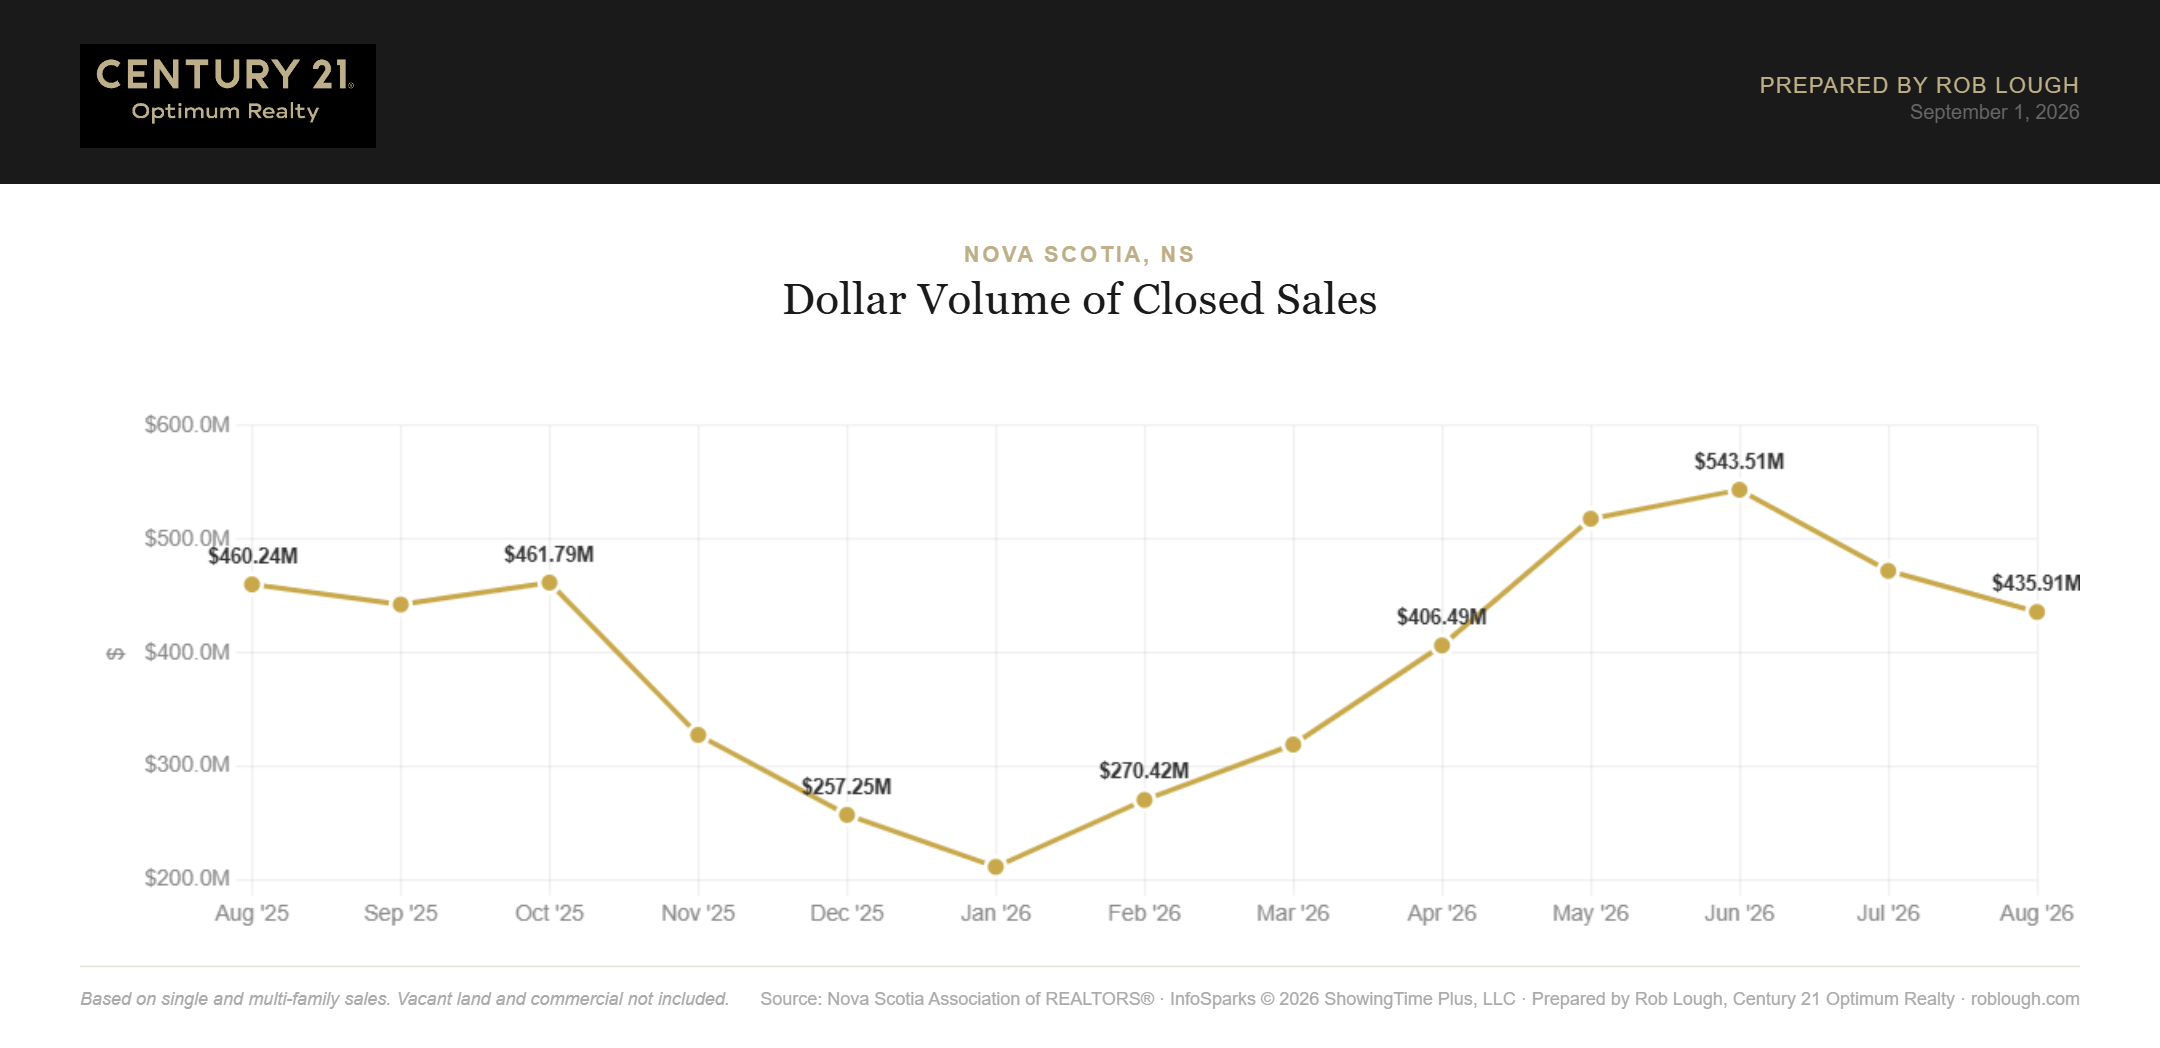
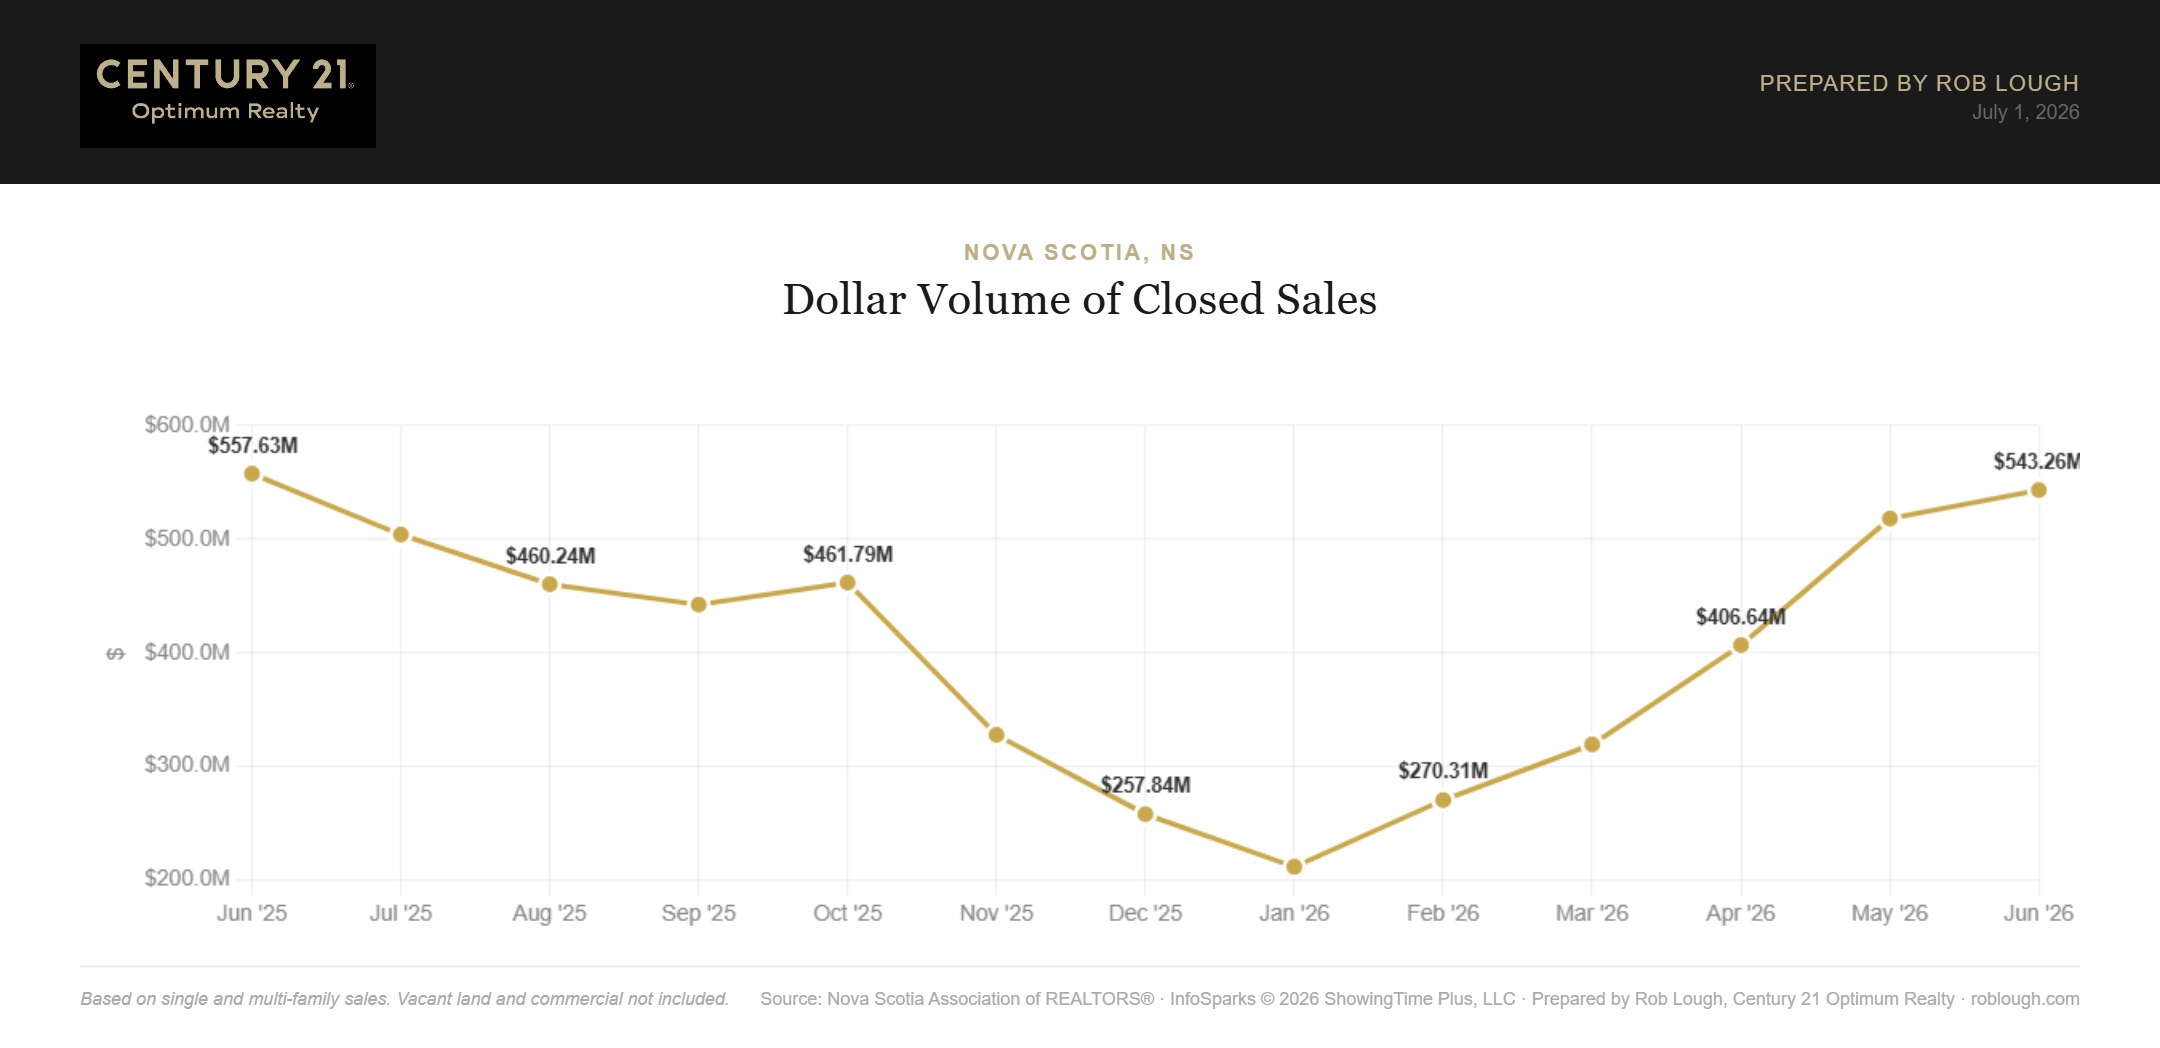
Total dollar volume of closed sales came in at $470.83 million in July 2026, down 13.3% from June’s $543.26 million and 6.6% below July 2025’s $503.94 million. June’s total was the strongest month in the trailing 13, so some pullback was expected โ€” but the year-over-year gap points to a genuinely quieter summer than 2025.

Nova Scotia Real Estate Market Statistics July 2026 Dollar Volume of Closed Sales

Nova Scotia Real Estate Market Statistics July 2026 Dollar Volume of Closed Sales


Homes Taking Slightly Longer to Sell: 46 Days

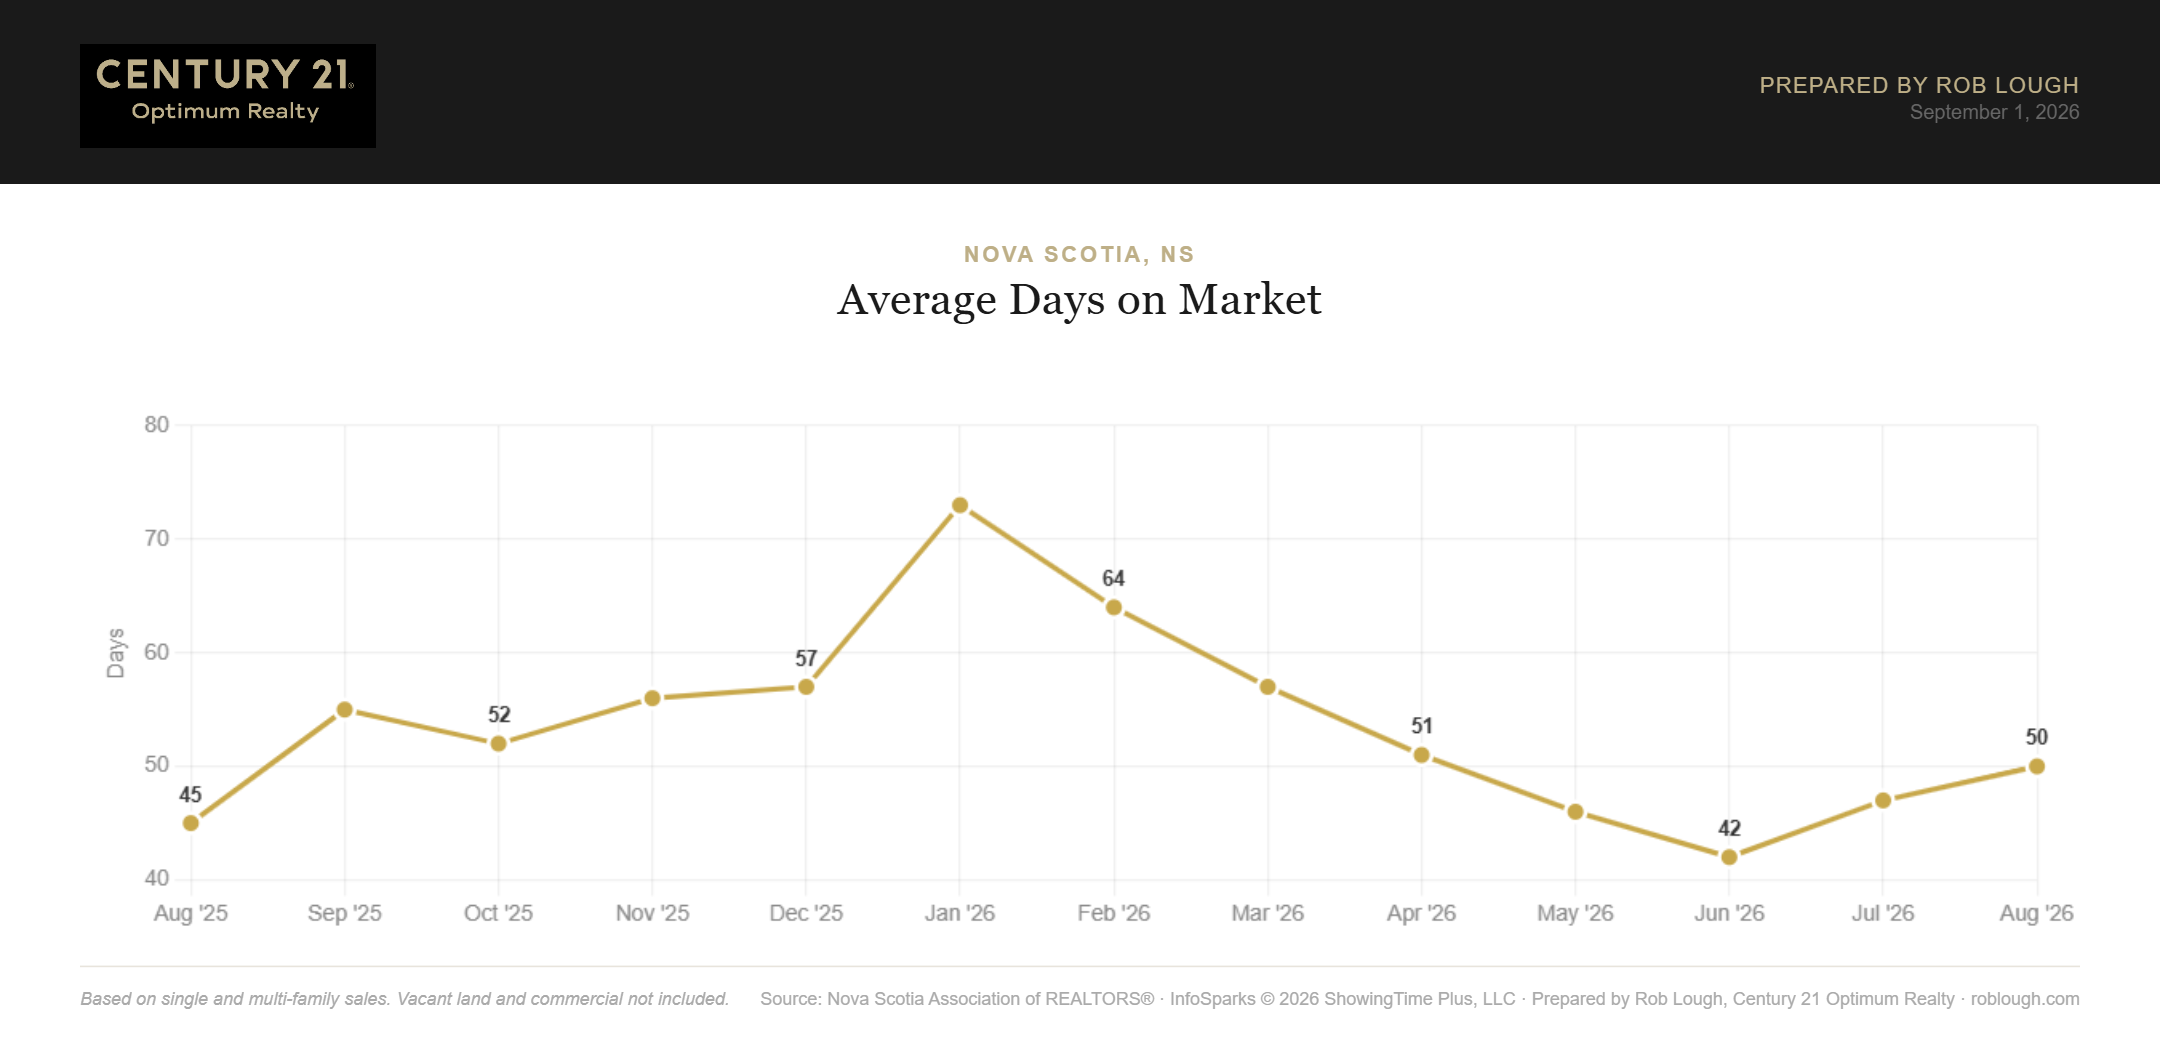
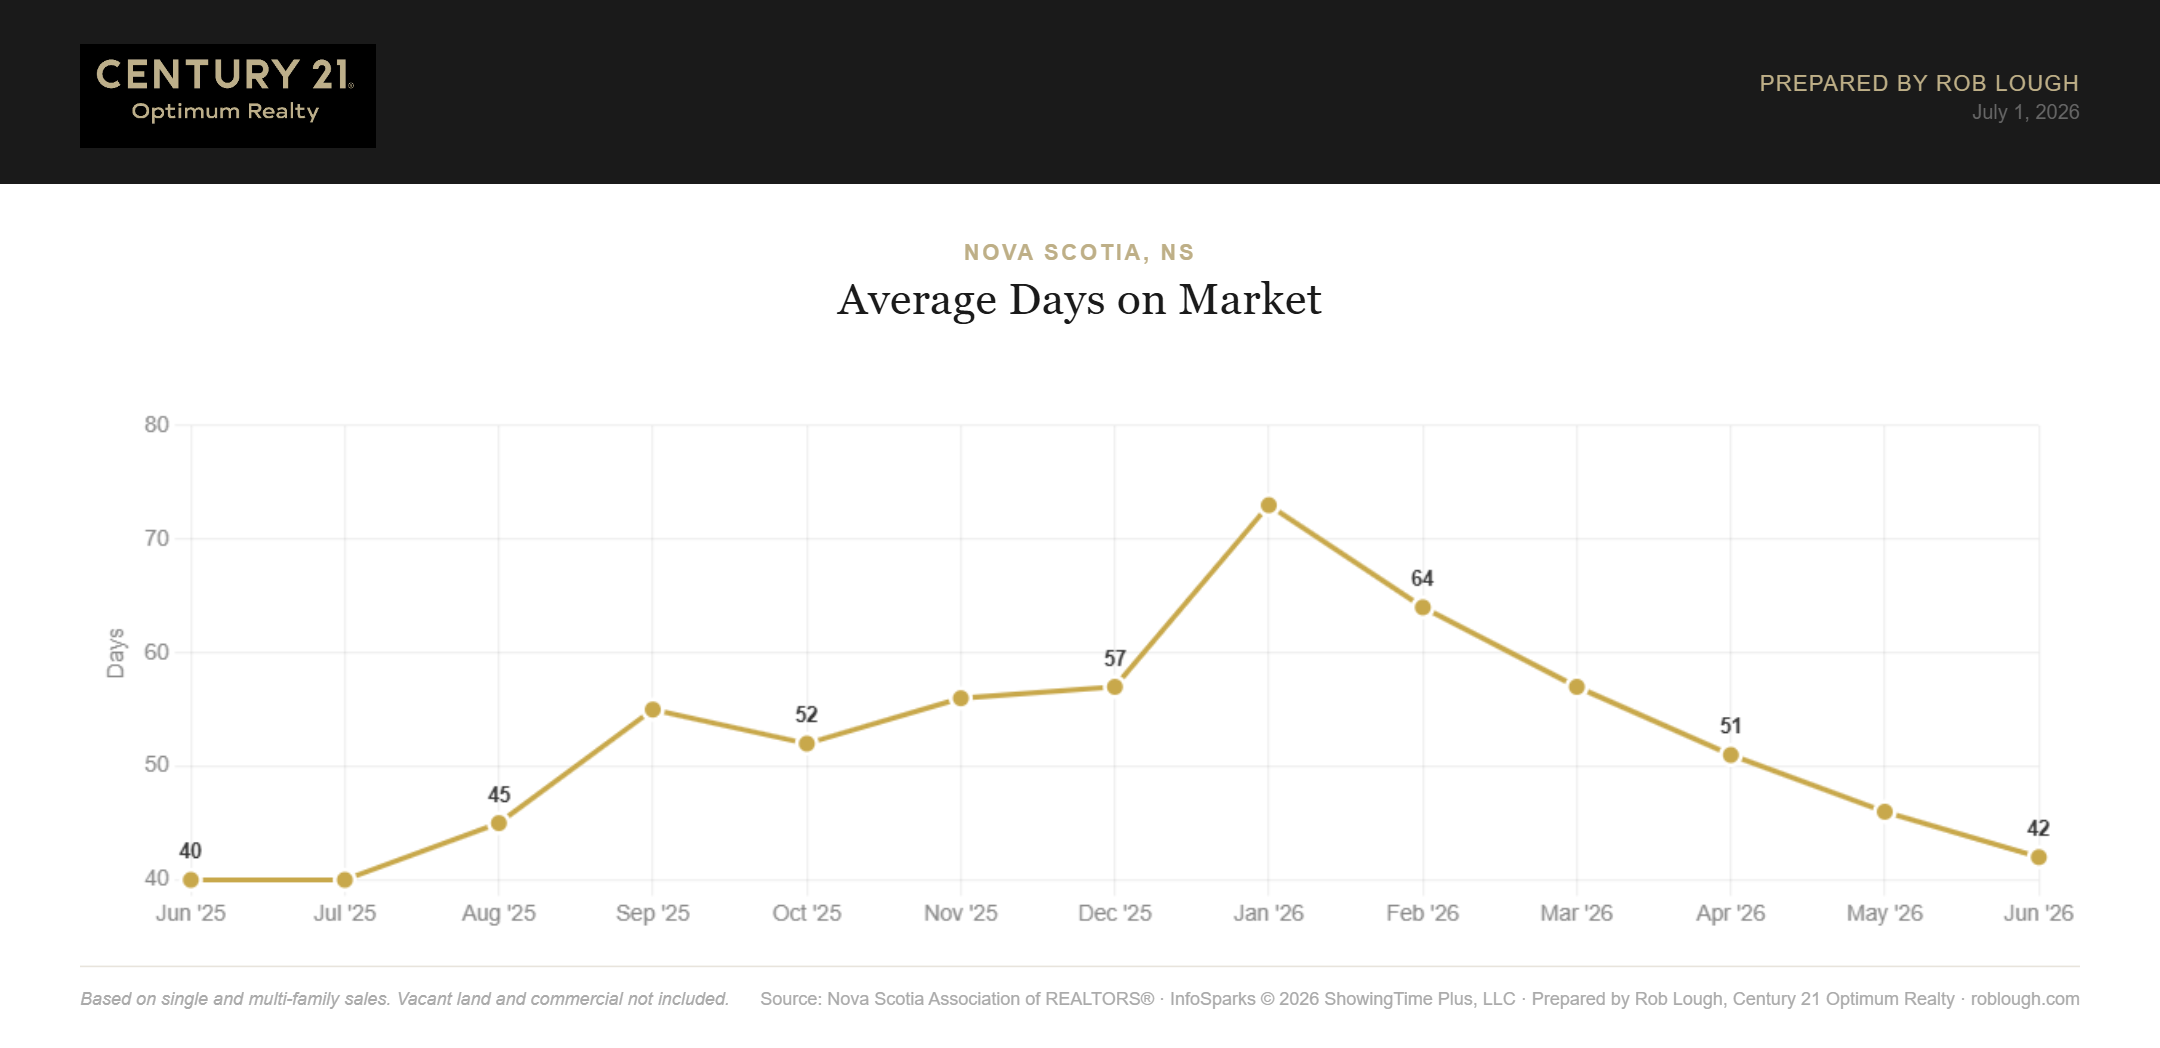
Average days on market rose to 46 in July 2026, up from 42 in June and six days slower than July 2025’s 40-day pace. Even so, 46 days remains among the faster readings of the past year โ€” well ahead of the winter stretch when homes sat 57 to 73 days.

If your home has been sitting on the market, or you’re weighing when to list this summer, our agents at Century 21 Optimum Realty can review your pricing strategy to make sure you’re positioned to sell efficiently.

Nova Scotia Real Estate Market Statistics July 2026 Average number of days on market

Nova Scotia Real Estate Market Statistics July 2026 Average number of days on market


Sale Price Ratios Keep Softening

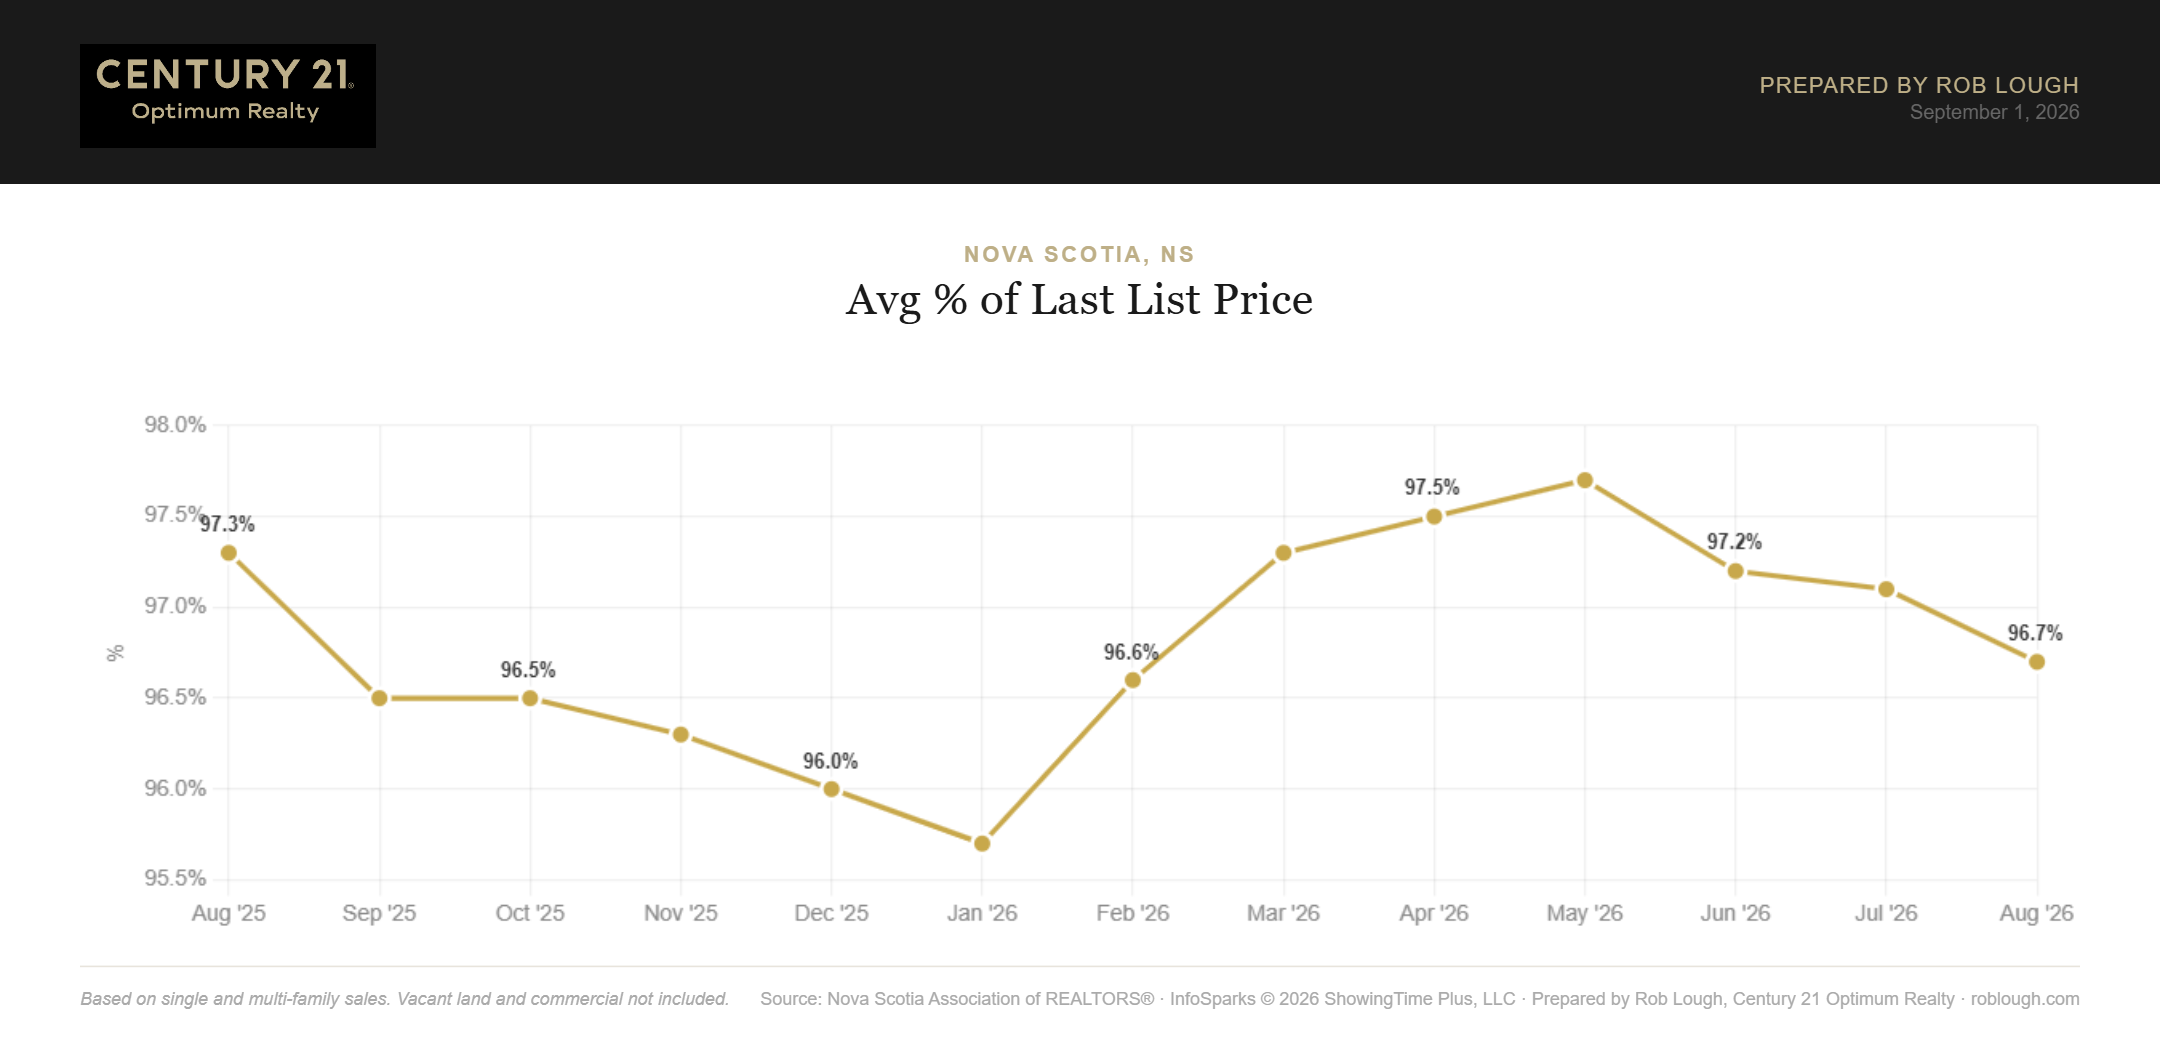
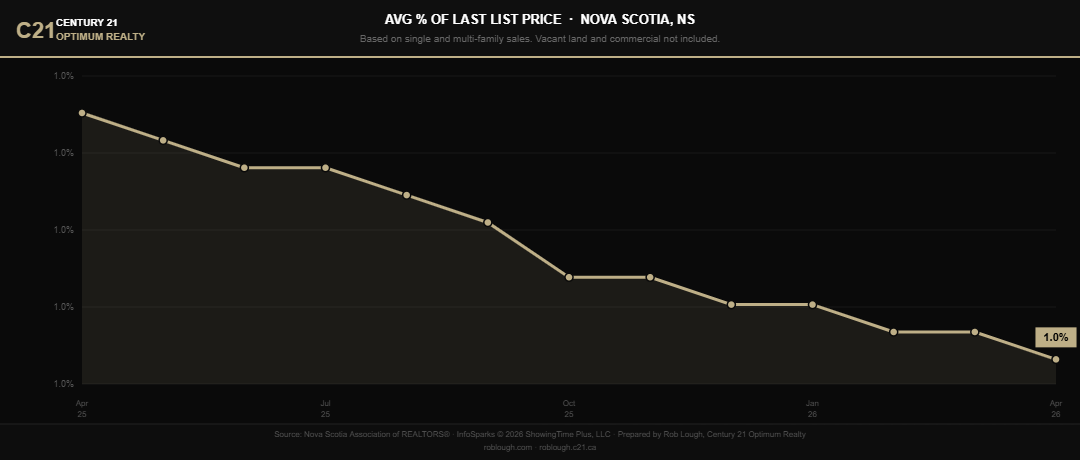
The average sale-to-list price ratio eased to 97.1% in July, down from 97.2% in June and 97.7% a year ago โ€” the lowest reading since February 2026.

Nova Scotia Real Estate Market Statistics July 2026 Average % of last list price

Nova Scotia Real Estate Market Statistics July 2026 Average % of last list price

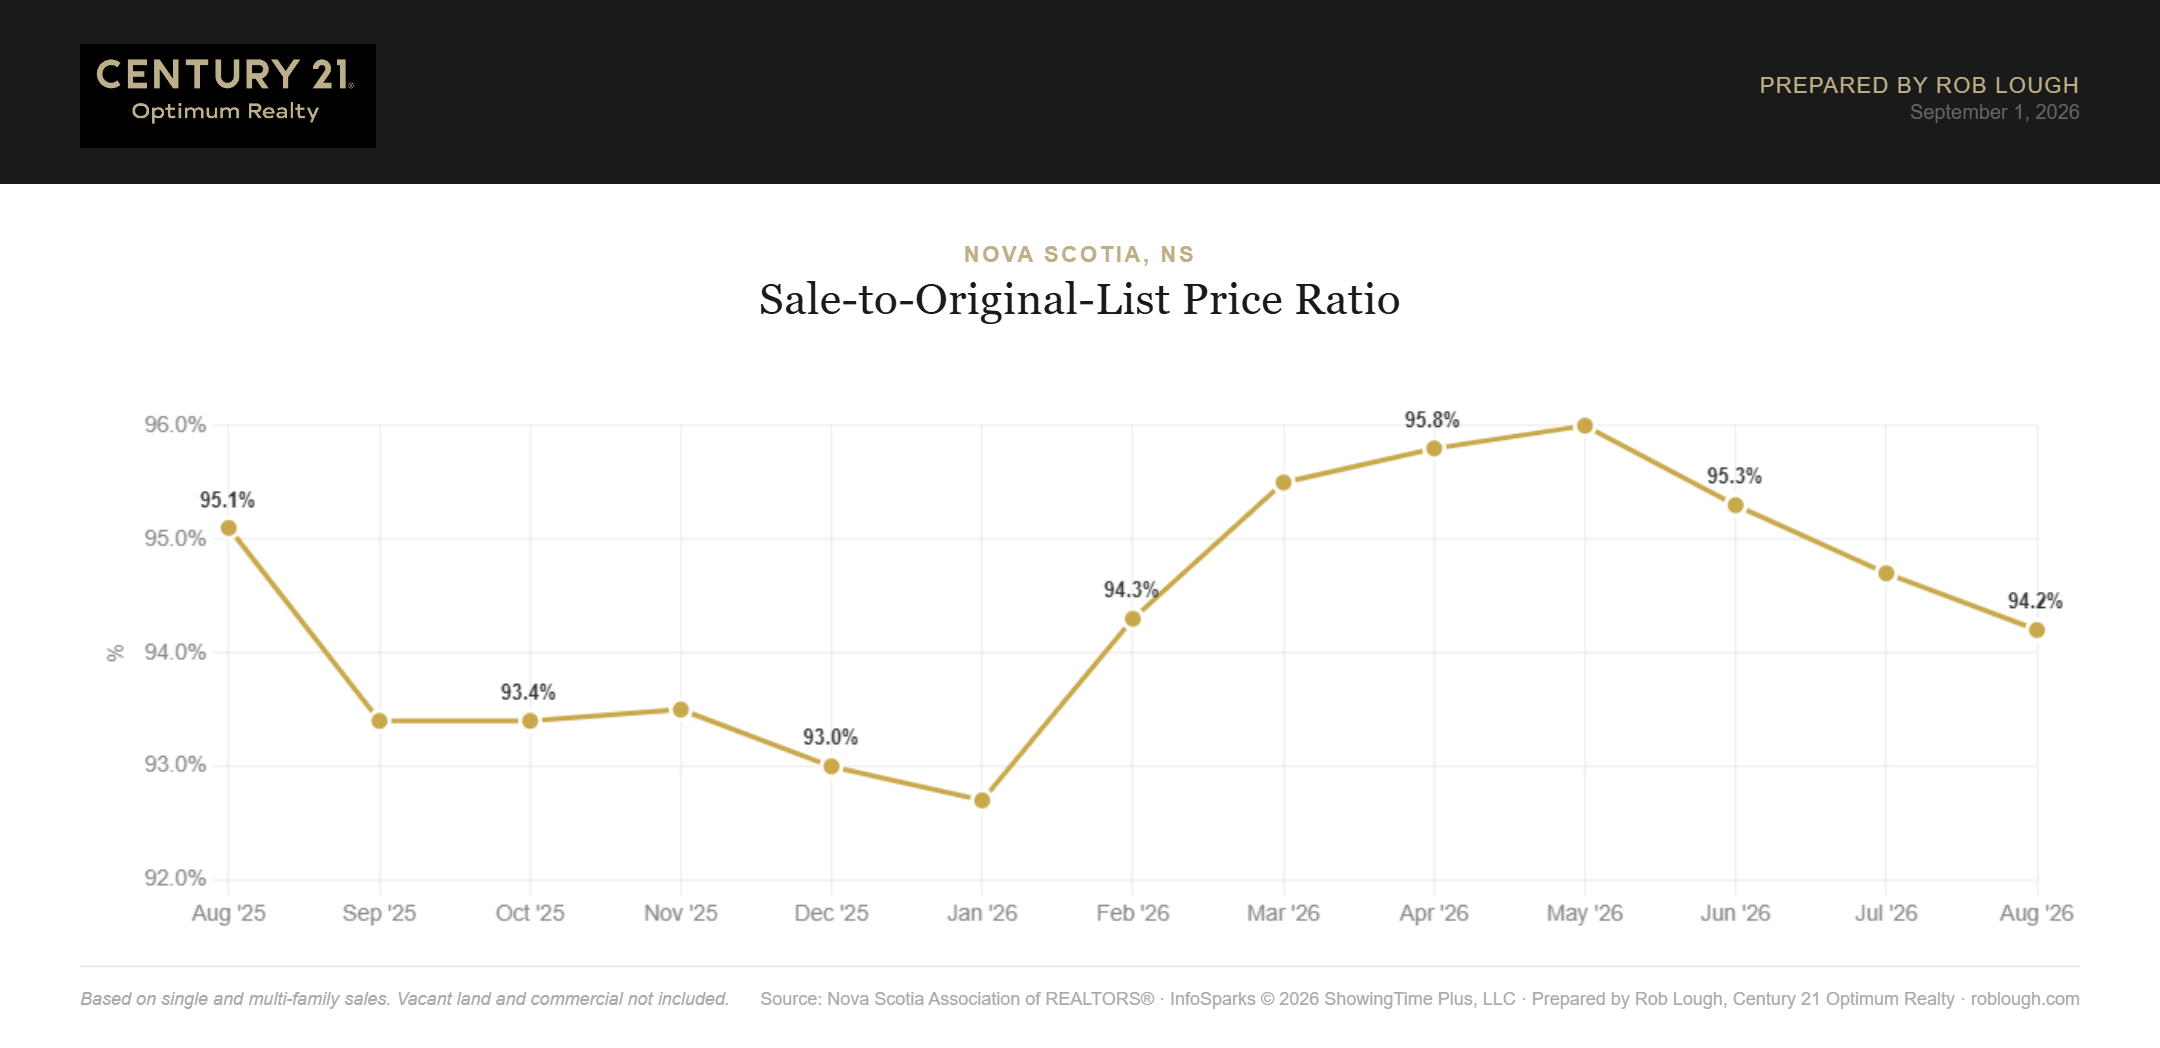
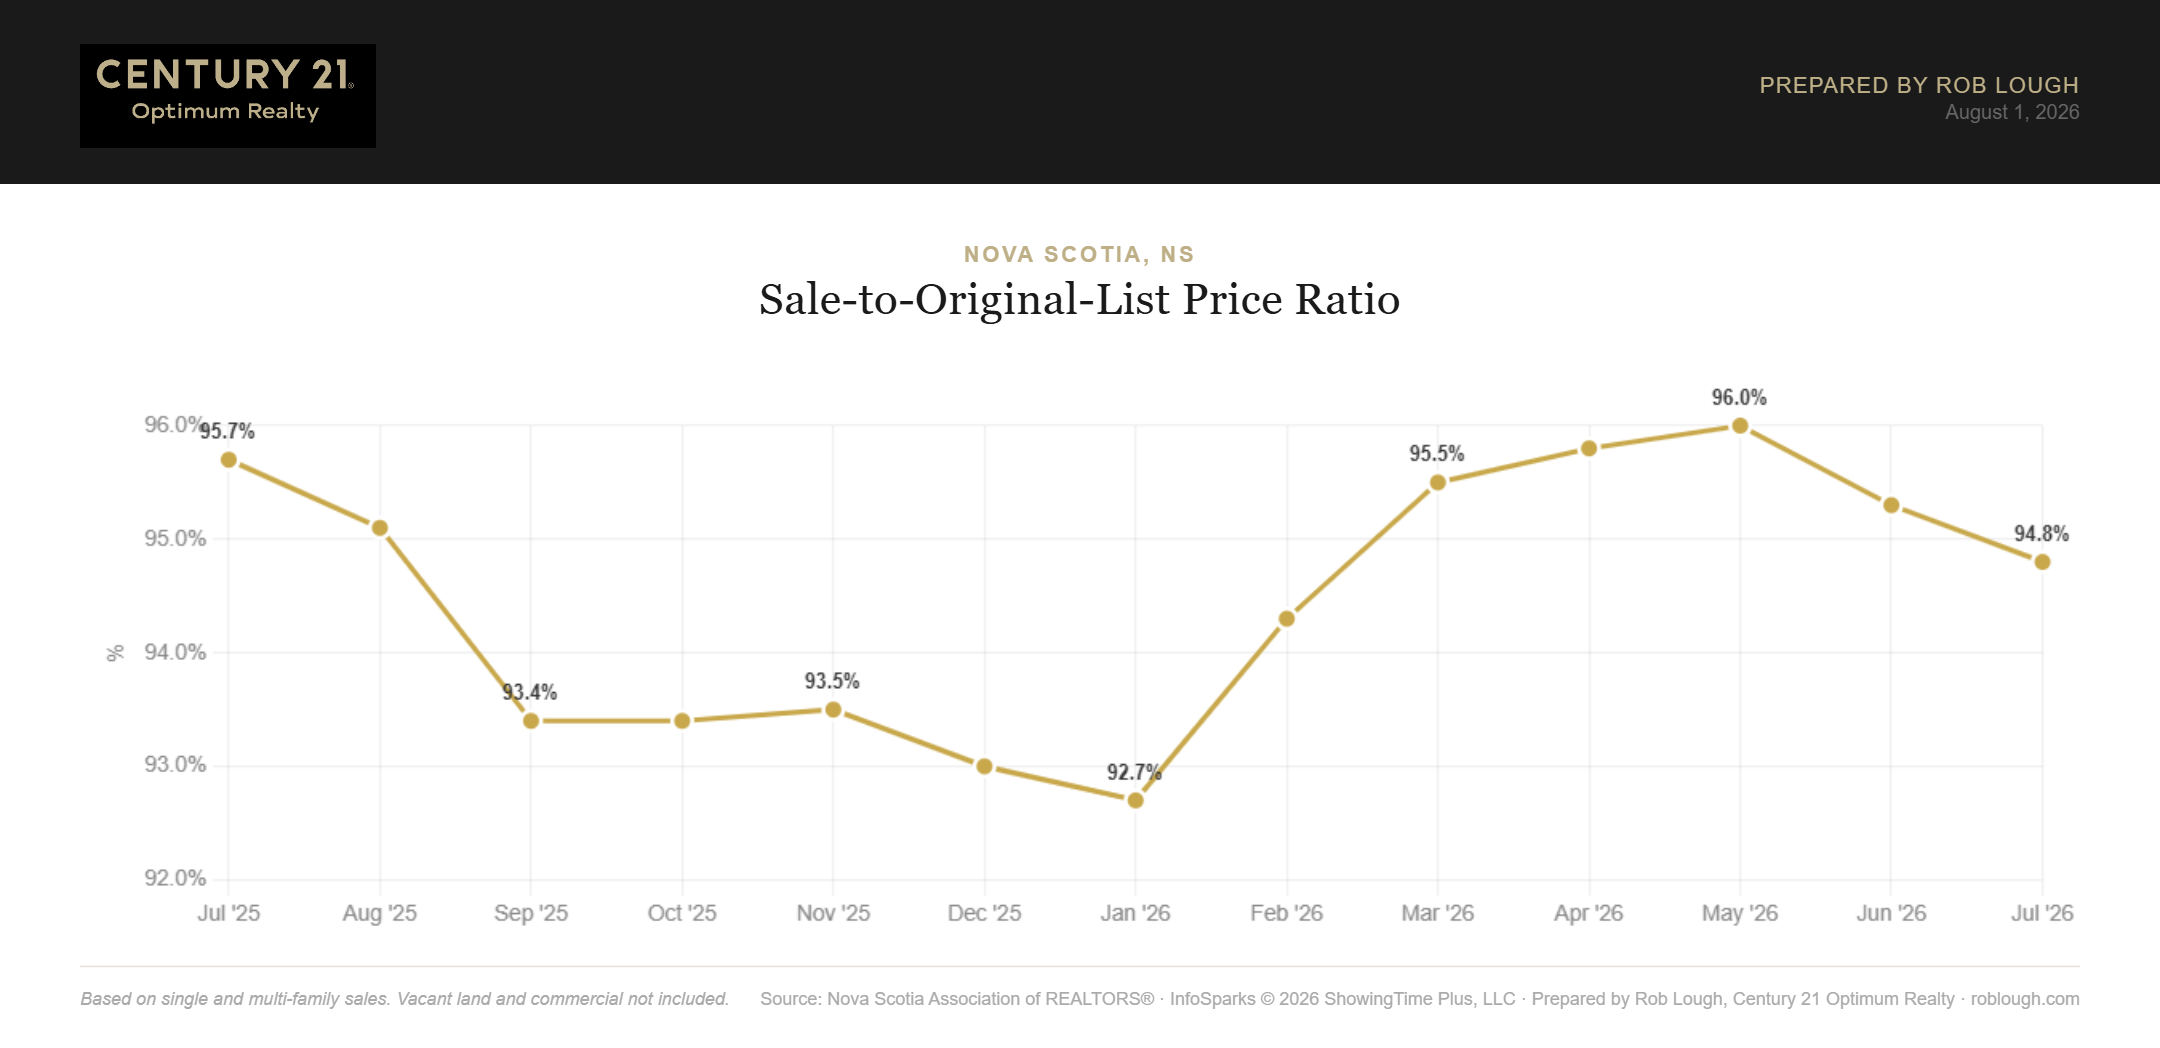
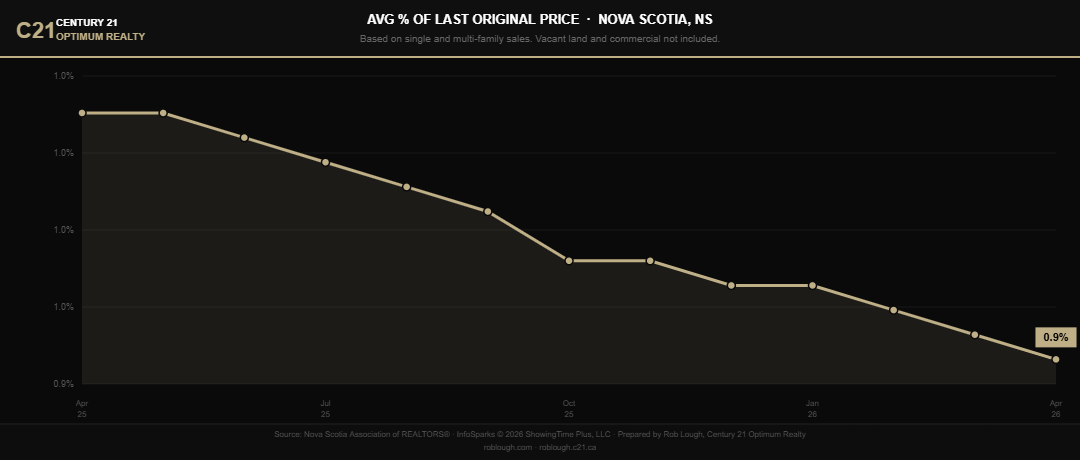
The sale-to-original-list-price ratio fell further, to 94.8%, down from 95.3% in June and 95.7% in July 2025. The 2.3-point spread between the two ratios means more homes are seeing a price reduction before they sell, a clear indicator that initial pricing expectations are running ahead of what buyers will pay.

Nova Scotia Real Estate Market Statistics July 2026 Average % of original list price

Nova Scotia Real Estate Market Statistics July 2026 Average % of original list price


Buyer Activity Cools, But Converts Efficiently

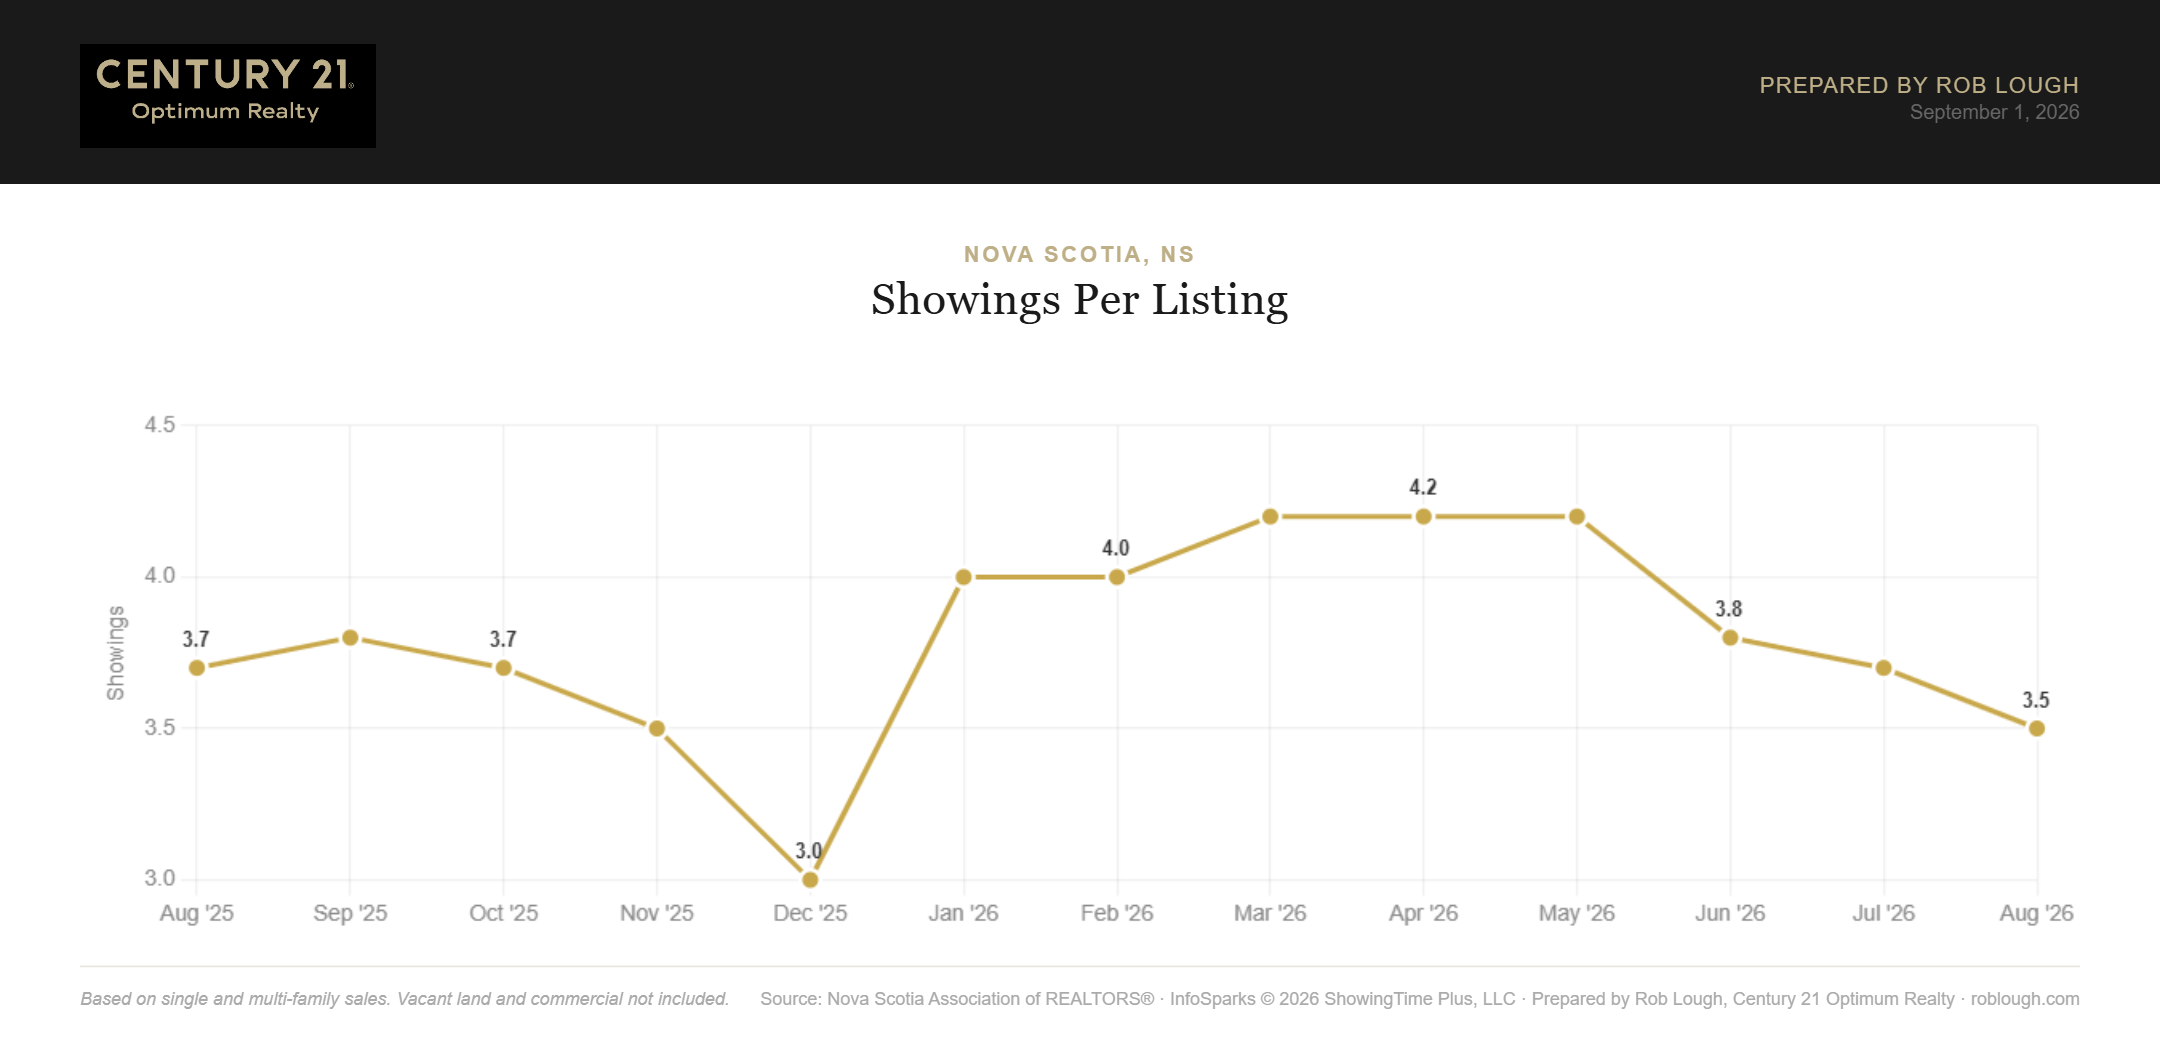
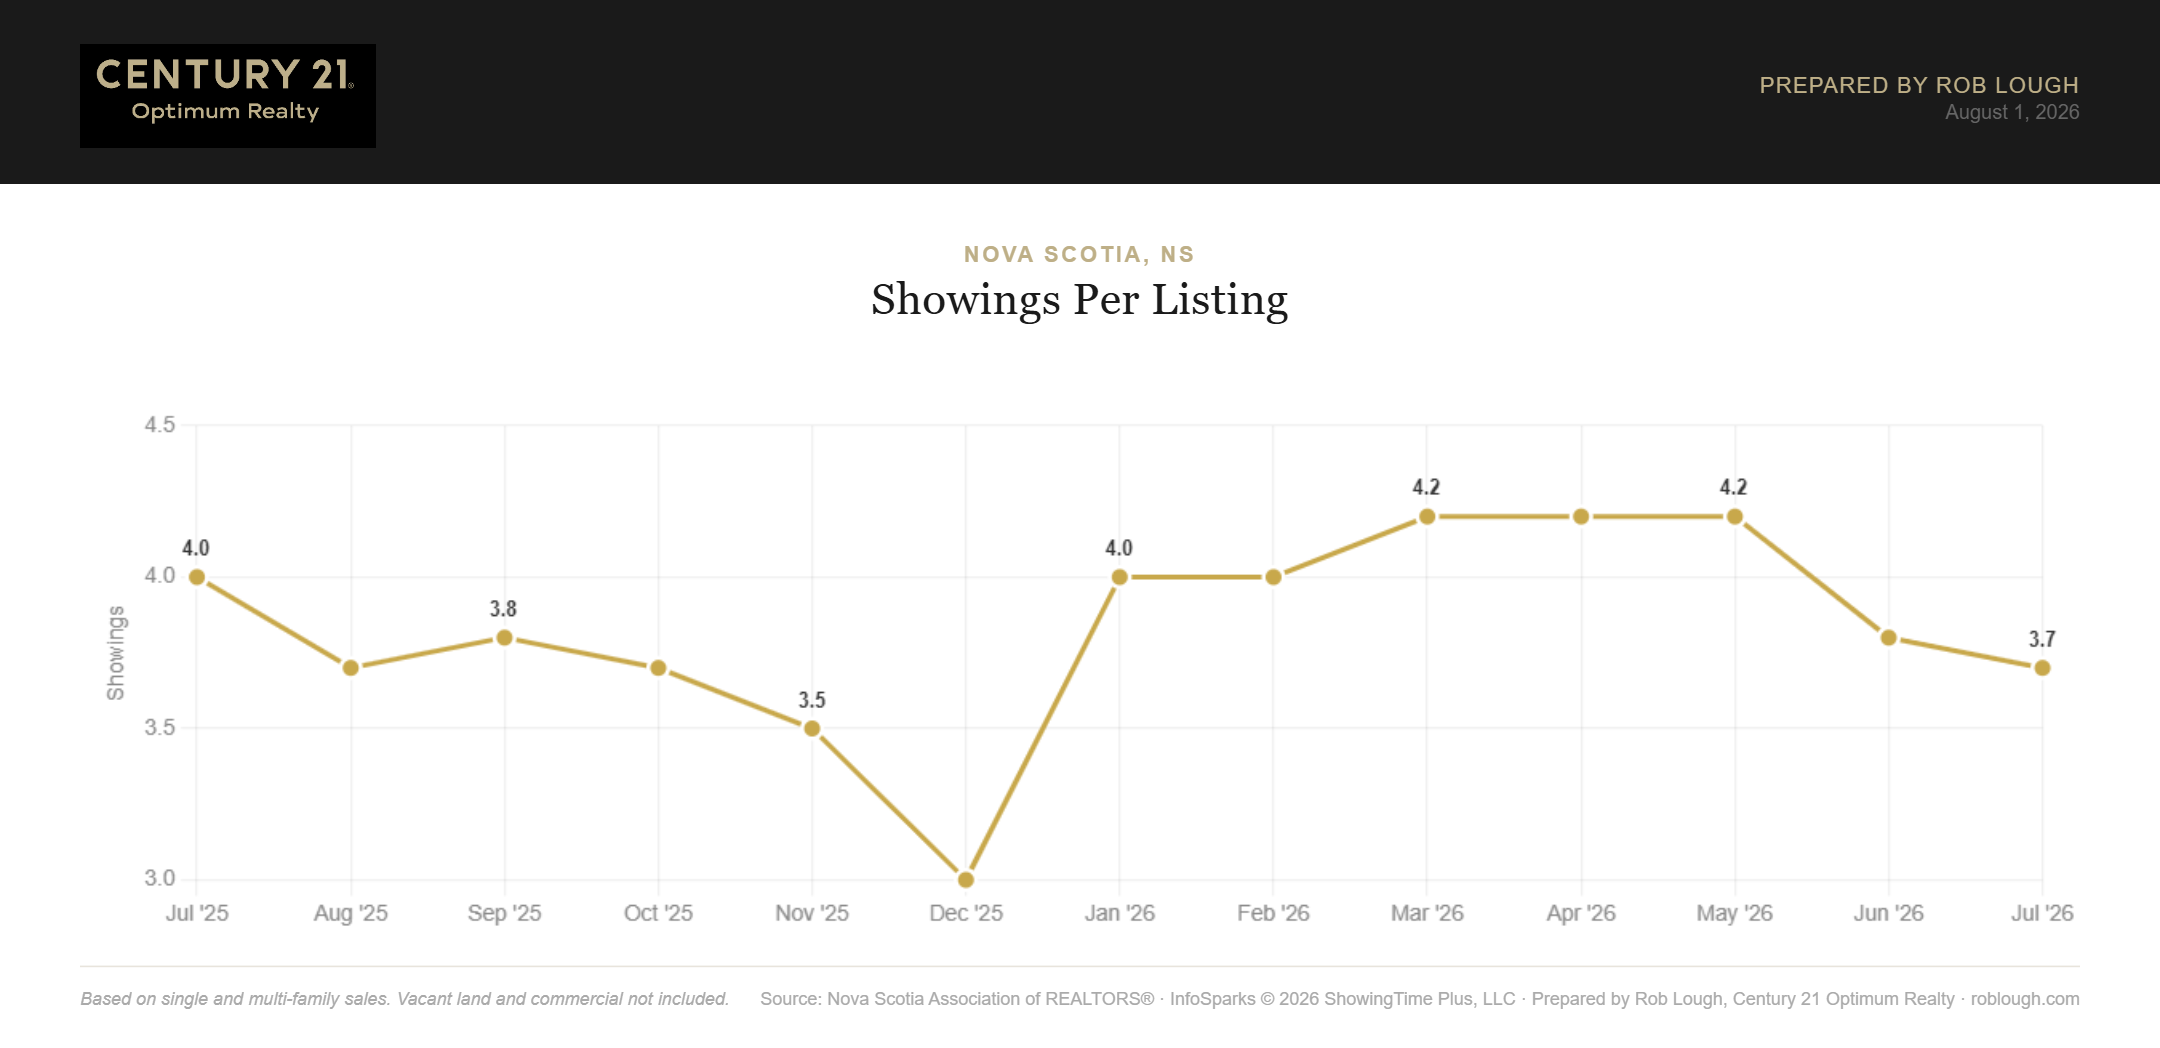
Showings per listing slipped to 3.7 in July, down from 3.8 in June and 4.0 in July 2025, a 7.5% year-over-year decline. With more listings competing for a similar pool of buyers, showing traffic per home is naturally thinner.

Nova Scotia Real Estate Market Statistics July 2026 number of showings per listing

Nova Scotia Real Estate Market Statistics July 2026 number of showings per listing

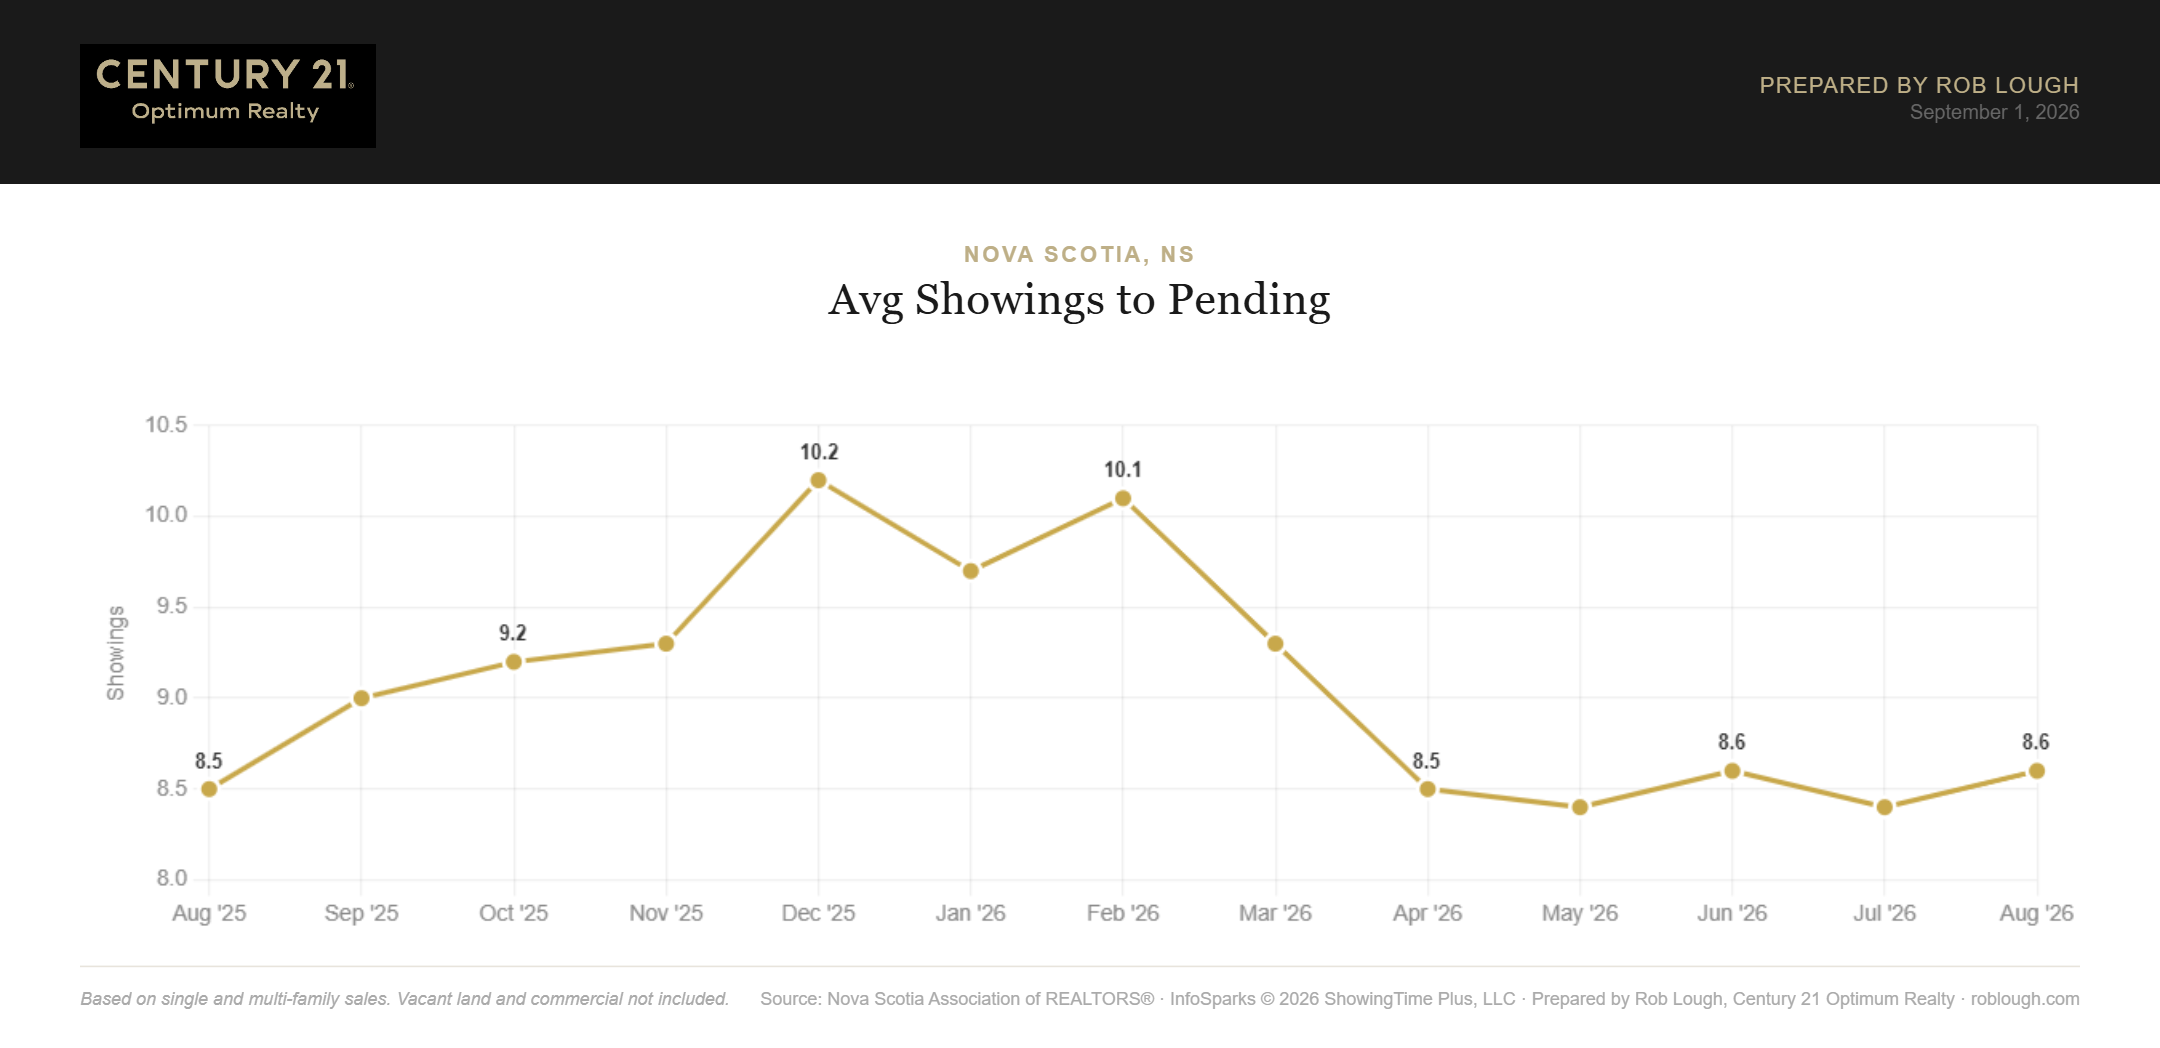
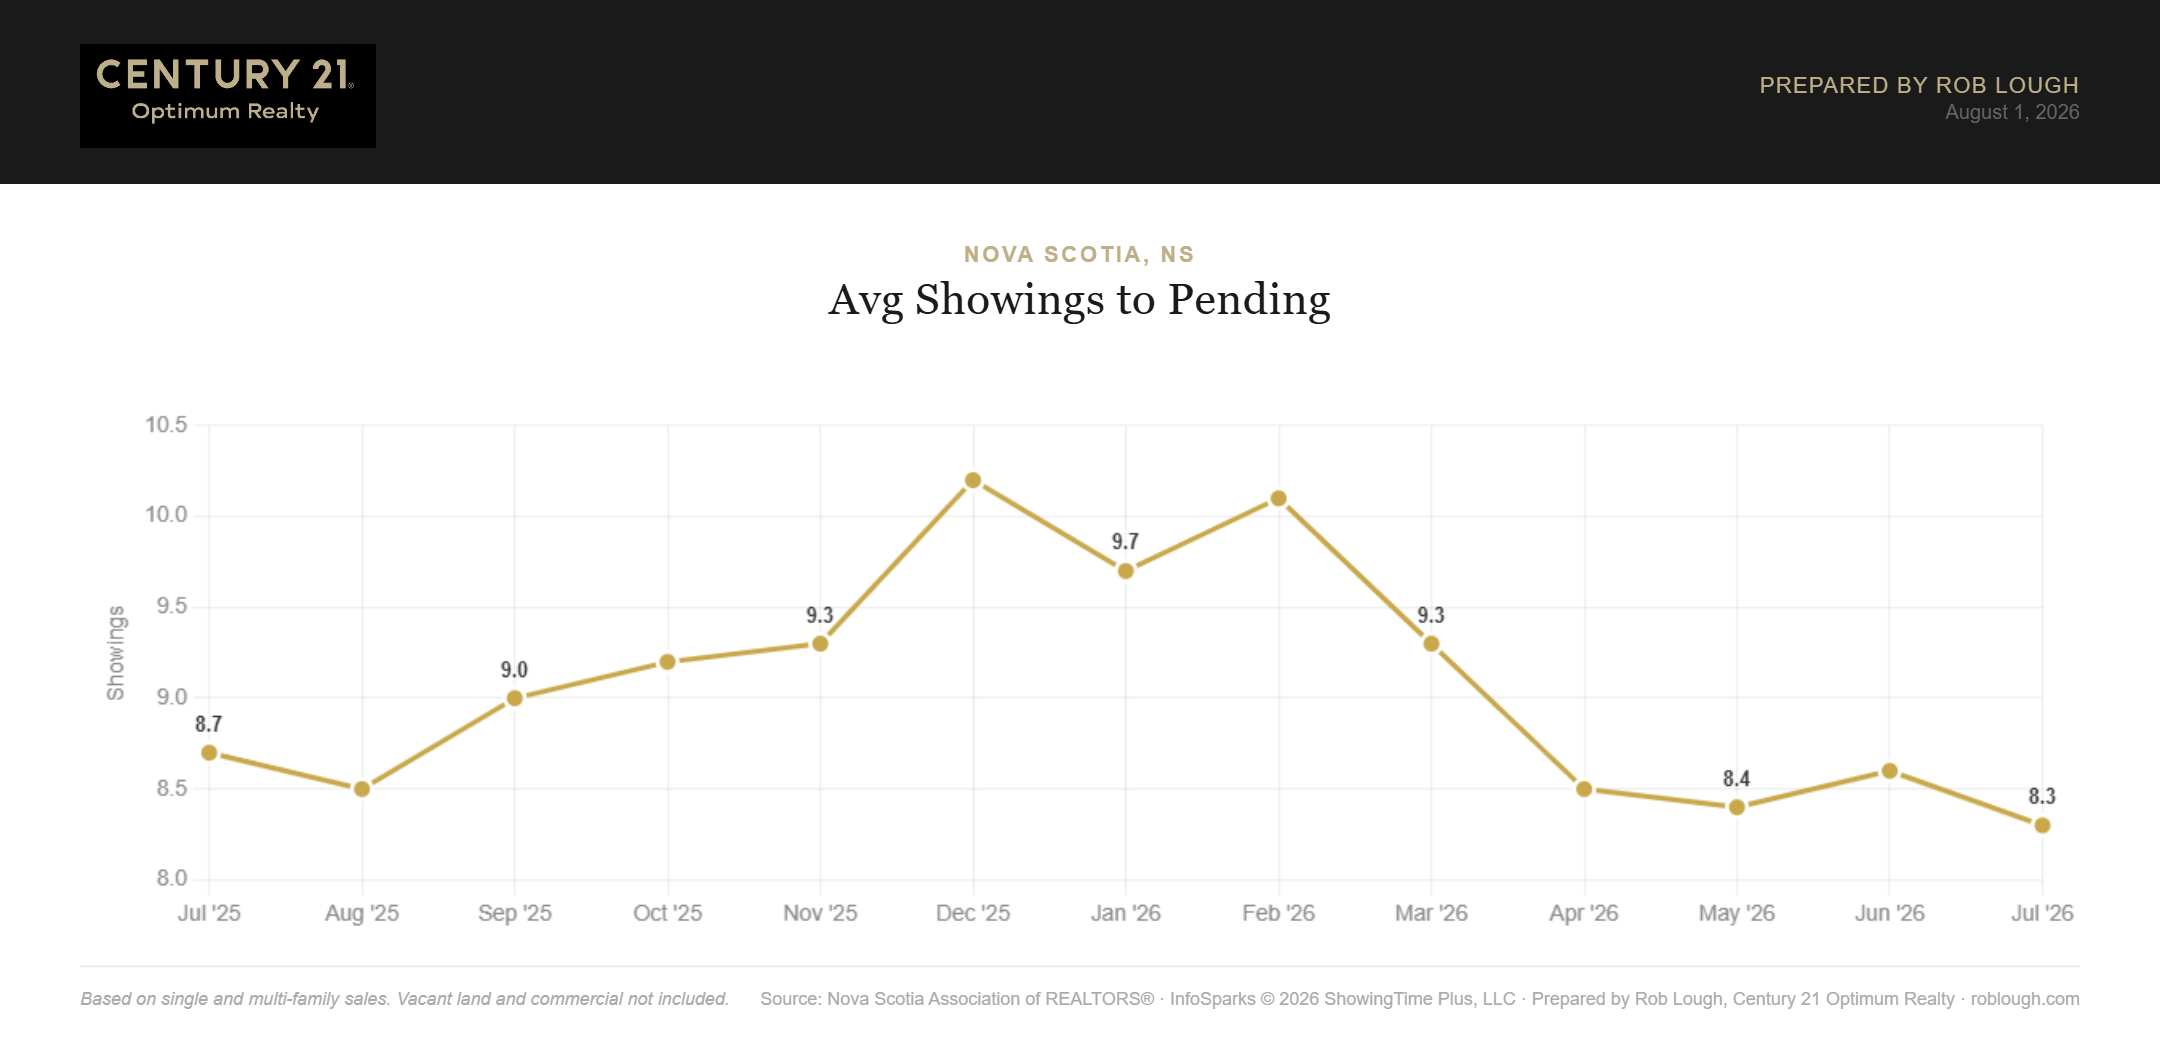
The encouraging counterpoint: average showings to pending dropped to 8.3, down from 8.6 in June and 8.7 a year ago, the lowest reading in the trailing 13 months. Fewer showings are needed to produce a sale than at any point in the past year. Buyers who are out looking are serious and decisive.

Nova Scotia Real Estate Market Statistics July 2026 average number of showings to pending

Nova Scotia Real Estate Market Statistics July 2026 average number of showings to pending


What This Means for Buyers and Sellers

For Buyers: This is the most buyer-friendly market Nova Scotia has seen in over a year. Months supply is at a 13-month high, sellers are accepting nearly 5% off original asking price on average, and you have time to look without the pressure of a bidding war. Browse current Nova Scotia listings with our team.

For Sellers: Per-square-foot values are still up year-over-year, and homes that show well are selling in under seven weeks with just 8.3 showings. But the widening gap between list and original-list ratios is the story of this market: overpriced homes are getting cut, and cut homes sell for less. Pricing correctly on day one is now the single biggest lever you control. Get a free market evaluation from Century 21 Optimum Realty.


Frequently Asked Questions

Is Nova Scotia a buyer’s or seller’s market in July 2026? With 5.5 months of supply, a 13-month high, up from 4.5 a year ago, Nova Scotia is approaching the 6-month threshold that typically defines a balanced market. Conditions are the most buyer-friendly they’ve been in over a year, though the province hasn’t fully crossed into buyer’s-market territory.

How much do homes sell for in Nova Scotia? The average sales price was $483,395 in July 2026, down 2.7% from June but up 1.0% from July 2025’s $478,574. The median sales price was $440,000, down 2.0% year-over-year.

How long does it take to sell a home in Nova Scotia? Homes averaged 46 days on market in July 2026, up from 42 days in June and six days slower than July 2025’s 40 days, still among the faster readings of the past 13 months.

Are Nova Scotia home prices falling? Not on a per-square-foot basis. Average price per square foot (total living area) was $281 in July 2026, up 2.6% from $274 a year ago. The softer average and median prices reflect a shift in the mix of homes selling rather than a broad decline in value.

Are buyers gaining negotiating power in Nova Scotia? Yes. The average sale-to-list price ratio slipped to 97.1% in July 2026 from 97.7% a year ago, and the sale-to-original-list ratio fell to 94.8% from 95.7%, meaning sellers are accepting more than 5% below their original asking price on average.

How many showings does it take to sell a home in Nova Scotia? An average of 8.3 showings per pending sale in July 2026, the lowest figure in the trailing 13 months and down from 8.7 a year ago. Buyer traffic is lighter but converts more efficiently.


About This Report

Data sourced from the Nova Scotia Association of REALTORSยฎ. Based on single and multi-family residential sales. Vacant land and commercial properties are not included. Prepared by Rob Lough, Broker/Owner, Century 21 Optimum Realty, Halifax-Dartmouth, Nova Scotia. Curious about the Halifax/Dartmouth Market Stats? Are you a condo owner and want to know about the Halifax Dartmouth Condo Market Report?


Related Resources

Uncategorized โ€ข 29 July 2026

Halifax Price Per Square Foot 2026

Halifax Price Per Square Foot 2026: What Nova Scotia Homes Really Cost Compared to the Rest of Canada

By Rob Lough, Broker/Owner | Century 21 Optimum Realty | July 2026


CENTURY 21 Canada released its ninth annual Price Per Square Foot Survey this week, comparing sold-property data across 50 Canadian communities from January 1 to June 30, 2026. The national headline was softness. The Halifax headline was something different: stability.

While Vancouver condo prices fell nearly 15 per cent and Ottawa townhouses dropped 18 per cent, Halifax detached homes edged up to $438 per square foot,ย a 0.46 per cent gain over 2025. In a year when most of the country moved backwards, holding flat is a genuine result.

Here’s what the numbers say about the Halifax-Dartmouth market, and what buyers and sellers should do about it.


Halifax Price Per Square Foot 2026: The Numbers

Property Typeย  ย  ย  ย  ย  ย  ย  ย  ย  ย 2025ย  vsย  ย 2026 = Change

Halifax Detached houseย  ย  ย  ย  ย $436ย  ย  ย  ย  ย  $438ย  ย  ย +0.46%

Halifax Condoย  ย  ย  ย  ย  ย  ย  ย  ย  ย  ย  ย  ย  $461ย  ย  ย  ย  ย  ย $448ย  ย  ย -2.82%

Two things stand out.

First, Halifax condos still cost more per square foot than Halifax houses,ย $448 versus $438. That surprises people, but it’s the same pattern you see in most cities: condos are smaller, and small spaces carry a higher per-foot price because the kitchen, bathroom and mechanical systems get spread over fewer square feet.

Second, the eight-year trend is remarkable. In 2018, a Halifax detached home sold for $155 per square foot. Today it’s $438. That’s a 182 per cent increase in eight years,ย one of the steepest sustained climbs of any market in the national survey.


How Halifax Compares Across Atlantic Canada

Halifax is now, by a wide margin, the most expensive market in Atlantic Canada on a per-square-foot basis:

Market Detached PPSF 2026 Change from 2025
Halifax $438 +0.46%
St. John’s, NL $333 -2.06%
Charlottetown, PEI $256 +2.40%
Moncton, NB $236 -3.28%
Fredericton, NB $230 -7.26%
Saint John, NB $229 -6.91%

Halifax commands roughly 86 per cent more per square foot than Moncton and nearly double Charlottetown. That premium reflects what the region’s largest urban centre offers, jobs, healthcare, universities, an international airport, and a port economy that keeps drawing people east.

Notably, Halifax and Charlottetown were the only two Atlantic markets to post gains this year. Every decline across the region stayed under 10 per cent, modest by national standards.


Halifax vs. the Big Three: The Value Story

This is where the local spin gets interesting for anyone considering a move to Nova Scotia:

Market 2026 PPSF vs. Halifax detached
Vancouver downtown condo $1,026 2.3ร—
Vancouver detached $933 2.1ร—
Toronto downtown condo $650 1.5ร—
Mississauga detached $760 1.7ร—
Montreal detached $553 1.3ร—
Halifax detached $438 โ€”

Put plainly: a 2,000 sq ft detached home in Halifax runs about $876,000 at survey pricing. The same square footage in Vancouver runs roughly $1.87 million. A Vancouver buyer selling a modest downtown condo can buy considerably more house here, with a yard.

That arbitrage is exactly the migration pattern CENTURY 21 Canada flagged nationally: people leaving expensive urban cores for markets where a dollar buys more home.


What Price Per Square Foot Actually Tells You (And What It Doesn’t)

PPSF is a useful comparison tool, not a valuation. It strips out home size so you can compare a 1,200 sq ft bungalow in Dartmouth against a 2,400 sq ft two-storey in Bedford on equal footing.

What it doesn’t capture:

  • Lot size and location – waterfront and view lots carry premiums no per-foot figure reflects
  • Condition and age – a renovated 1950s home and an untouched one can differ 20 per cent per foot
  • Neighbourhood variance – the South End, Clayton Park, Dartmouth’s Woodside and the Eastern Shore are separate markets inside one average
  • Finished basements – often excluded or discounted in square footage calculations

Use PPSF to sanity-check a price range. Use a comparative market analysis to set one.


What This Means for Halifax Buyers

Halifax price stability arrives alongside conditions that favour you. Our June 2026 Nova Scotia market report showed active listings at a 13-month high of 4,142, months of supply at 5.2, close to balanced territory and the sale-to-original-list ratio softening to 95.3 per cent.

Translation: more choice, more time to decide, and more room to negotiate than you’ve had in years. Prices aren’t collapsing, so waiting for a Vancouver-style correction in Halifax is probably a losing strategy. But you’re negotiating from a stronger position than 2024 or 2025 buyers were.

Browse current Halifax and Dartmouth listings with our team.


What This Means for Halifax Sellers

Your equity is intact. Eight years of price growth held through a national downturn, and Halifax remains one of the few Canadian markets in positive territory this year.

But the pricing power of 2021โ€“2022 is gone. With supply climbing and buyers accepting roughly 4.7 per cent off original list, the homes that sell efficiently are the ones priced correctly from day one. Overpricing now costs you far more than it did two years ago, you burn your best two weeks of exposure and end up negotiating from a stale listing.

Condo owners should note the -2.8 per cent shift and price accordingly. Get a current market evaluation of your Nova Scotia home.


Frequently Asked Questions

What is the price per square foot in Halifax in 2026? Halifax detached homes averaged $438 per square foot in the first half of 2026, up 0.46 per cent from $436 in 2025. Halifax condos averaged $448 per square foot, down 2.82 per cent from $461.

Is Halifax more expensive than other Atlantic Canadian cities? Yes. At $438 per square foot, Halifax is the most expensive market in Atlantic Canada, about 86 per cent more than Moncton ($236), 71 per cent more than Charlottetown ($256), and 32 per cent more than St. John’s ($333).

How does Halifax compare to Vancouver and Toronto per square foot? Halifax detached homes cost roughly 47 per cent of Vancouver detached ($933/sq ft) and 67 per cent of a downtown Toronto condo ($650/sq ft). A 2,000 sq ft Halifax home prices near $876,000 versus roughly $1.87 million in Vancouver.

Are Halifax home prices going up or down in 2026? Halifax detached prices are essentially flat, up 0.46 per cent per square foot year over year, while condos eased 2.82 per cent. Provincially, the average Nova Scotia sale price was $496,578 in June 2026, down just 0.3 per cent from a year earlier.

Why do Halifax condos cost more per square foot than houses? Condos are smaller on average, so fixed-cost areas like kitchens, bathrooms and mechanical systems are spread across fewer square feet. Downtown condo locations also carry a land-value premium.

Is now a good time to buy in Halifax? Conditions are more buyer-friendly than they’ve been in several years: inventory hit a 13-month high in June 2026, months of supply reached 5.2, and sellers are accepting more off list price. Prices remain stable, so the advantage is in negotiating terms rather than waiting for declines.


About This Article

Price per square foot data from CENTURY 21 Canada’s 2026 Price Per Square Foot Survey, comparing sold properties across 50 Canadian communities from January 1 to June 30, 2026. Nova Scotia market data from the Nova Scotia Association of REALTORSยฎ. Prepared by Rob Lough, Broker/Owner, Century 21 Optimum Realty, 24 Logiealmond Close, Unit 24, Dartmouth, NS โ€” (902) 444-1333.

Related Resources

Uncategorized โ€ข 1 July 2026

Nova Scotia Real Estate Market Statistics June 2026

Nova Scotia Real Estate Market Statistics June 2026

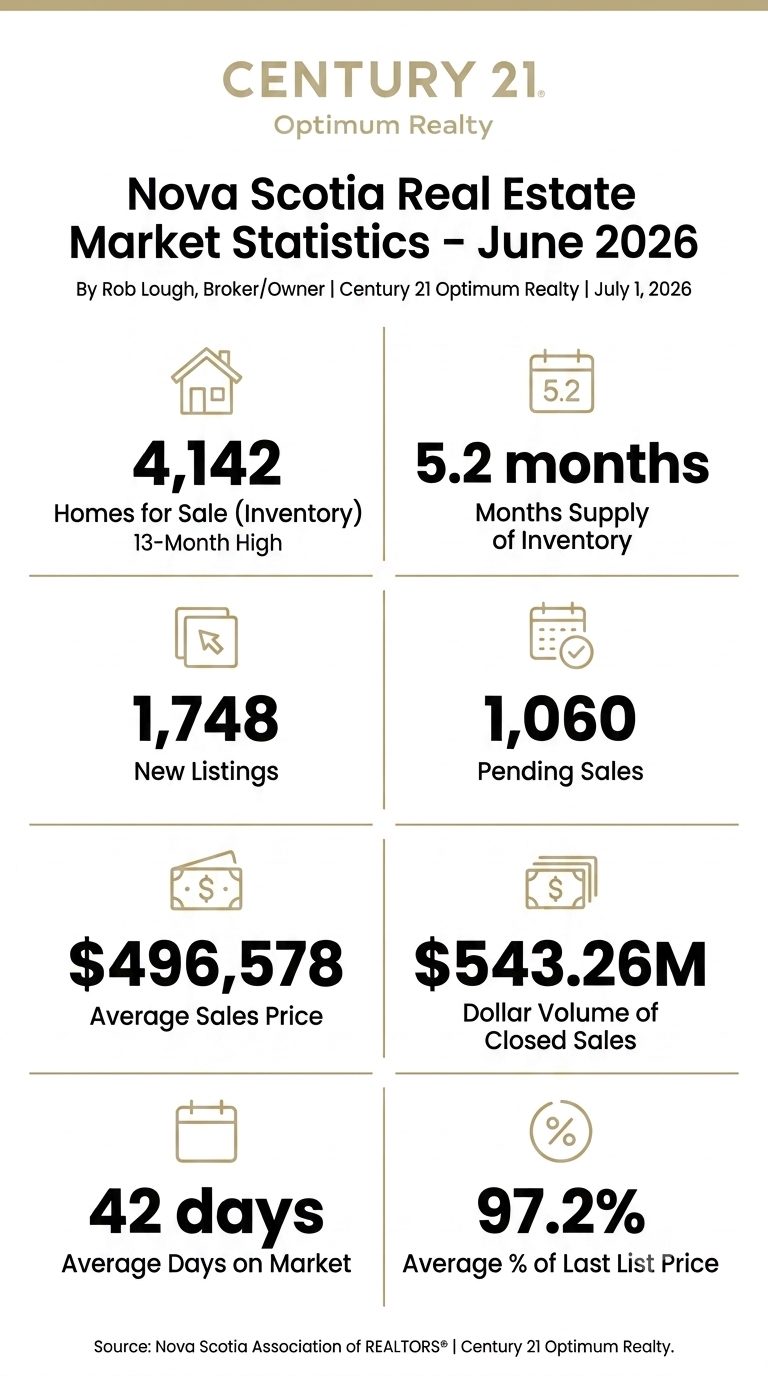
By Rob Lough, Broker/Owner | Century 21 Optimum Realty | July 1, 2026 Nova Scotia’s housing market carried its spring momentum into early summer. June 2026 data from the Nova Scotia Association of REALTORSยฎ shows inventory at its highest level in over a year, sales activity back to a healthy summer pace, and price ratios beginning to soften in buyers’ favour, a market moving toward better balance. Whether you’re buying or selling, understanding these trends matters. At Century 21 Optimum Realty, we track these numbers every month so you can make informed decisions.


Inventory Hits a 13-Month High: 4,142 Homes for Sale

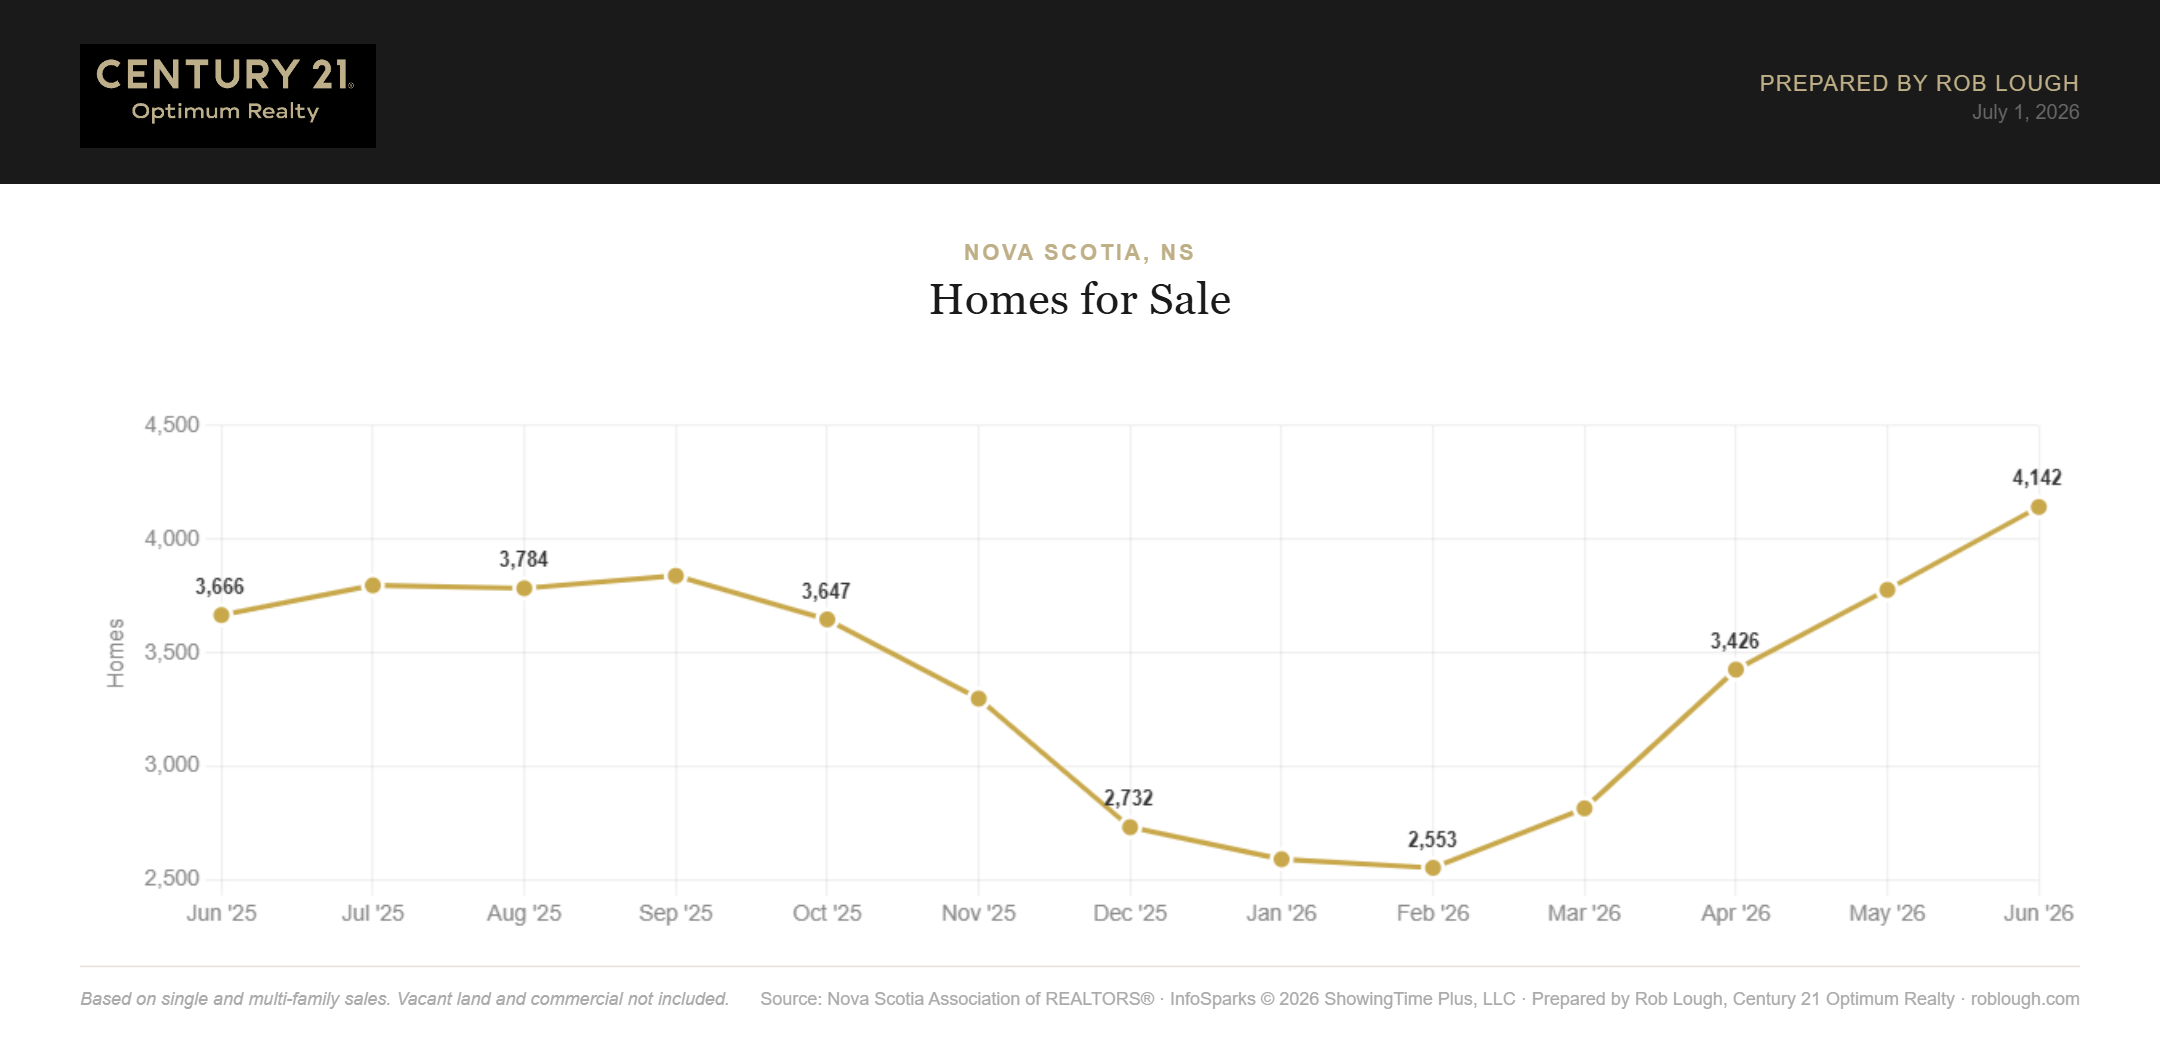
Active listings continued their spring climb, reaching 4,142 in June 2026, the highest level in the trailing 13 months, up 9.7% from May’s 3,777 and up 13.0% from June 2025’s 3,666. Buyers now have meaningfully more choice than they did a year ago.

Nova Scotia Real Estate Market Statistics June 2026 number of homes for sale

Nova Scotia Real Estate Market Statistics June 2026 number of homes for sale

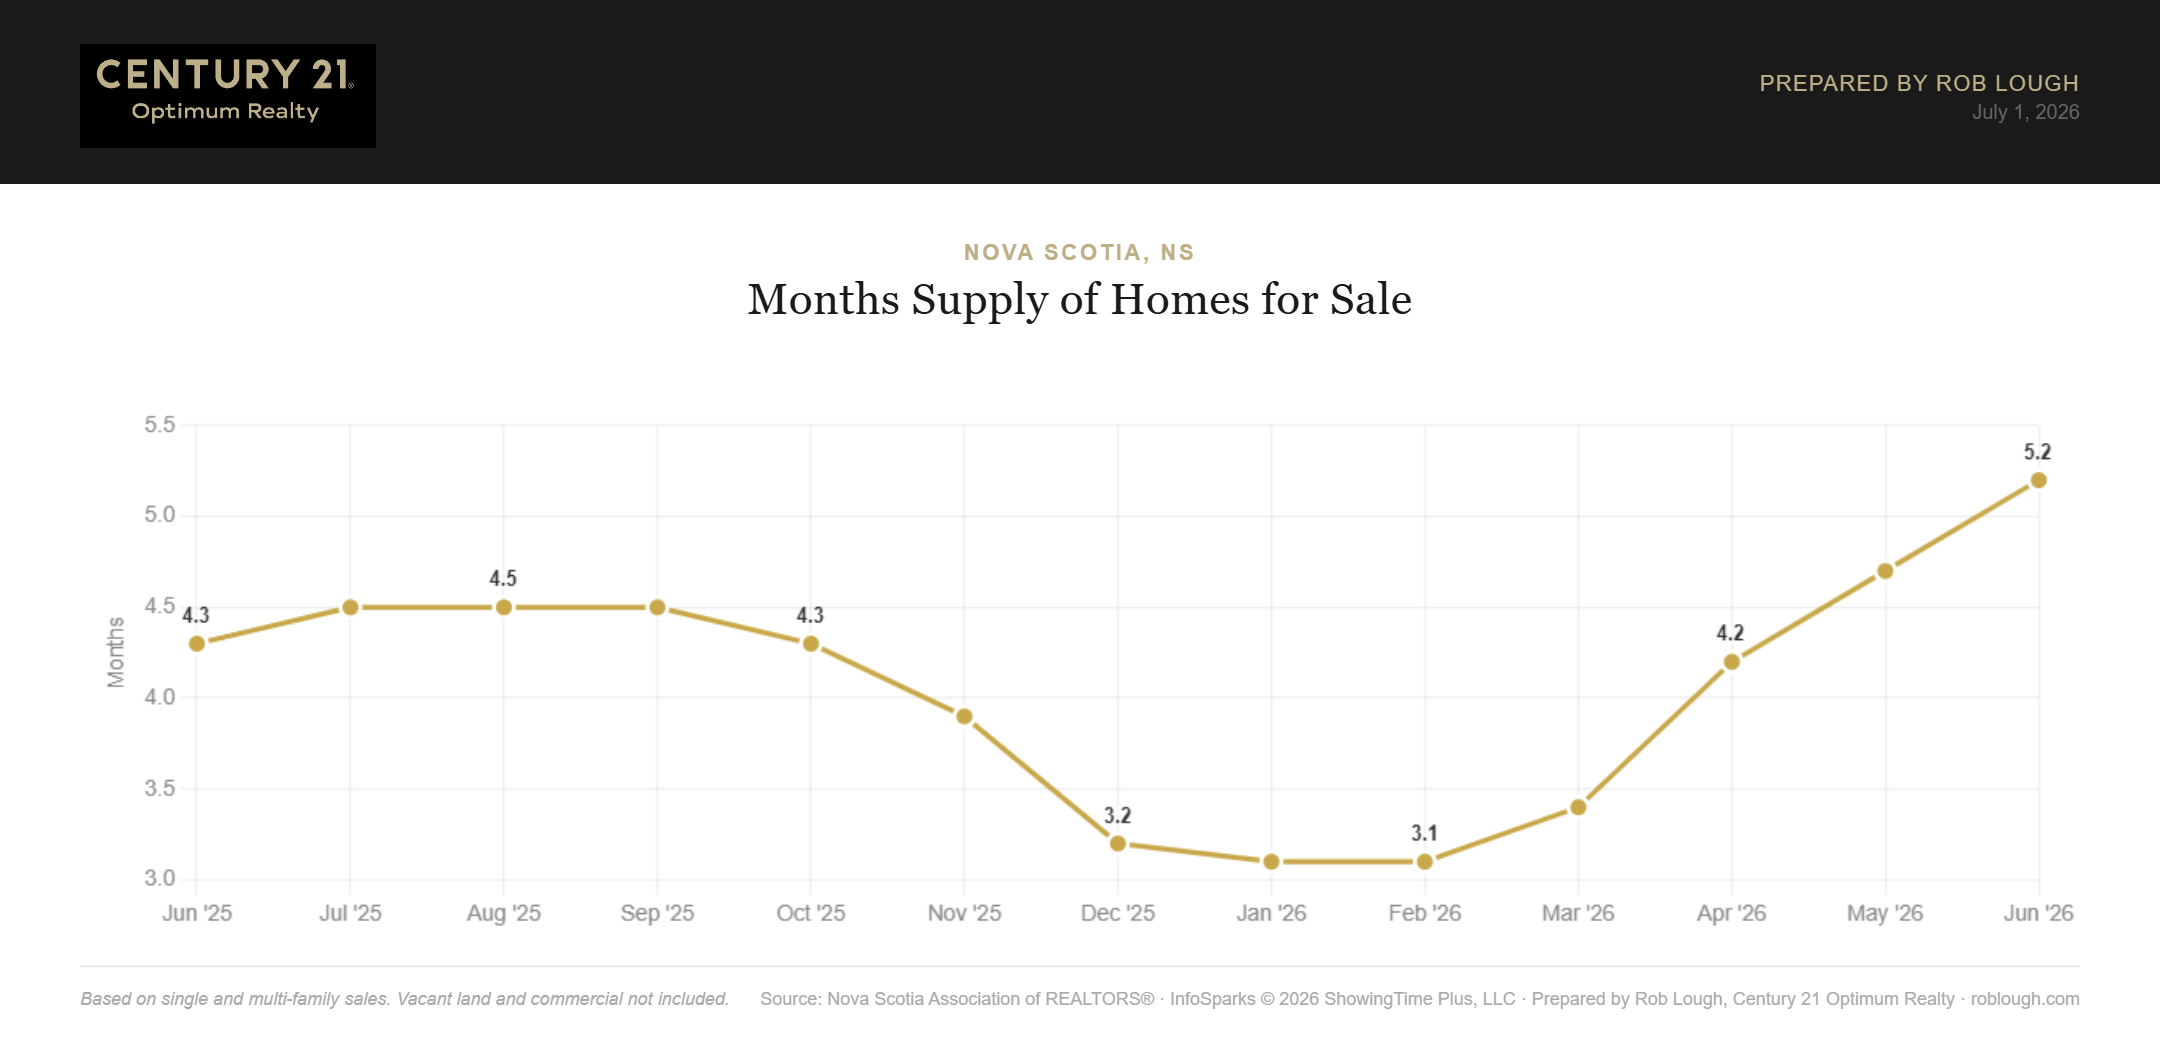
Months supply of inventory followed the same path, rising to 5.2 months in June, up from 4.7 in May and 4.3 a year ago. This is also a 13-month high and puts the market within striking distance of the 6-month threshold that typically defines a balanced market. If you’re considering a purchase, our team at Century 21 Optimum Realty can help you understand what this shift means for negotiating power in your target neighbourhood.

Nova Scotia Real Estate Market Statistics June 2026 Months supply of Inventory

Nova Scotia Real Estate Market Statistics June 2026 Months supply of Inventory


New Listings Hold Steady, Pending Sales Ease Slightly

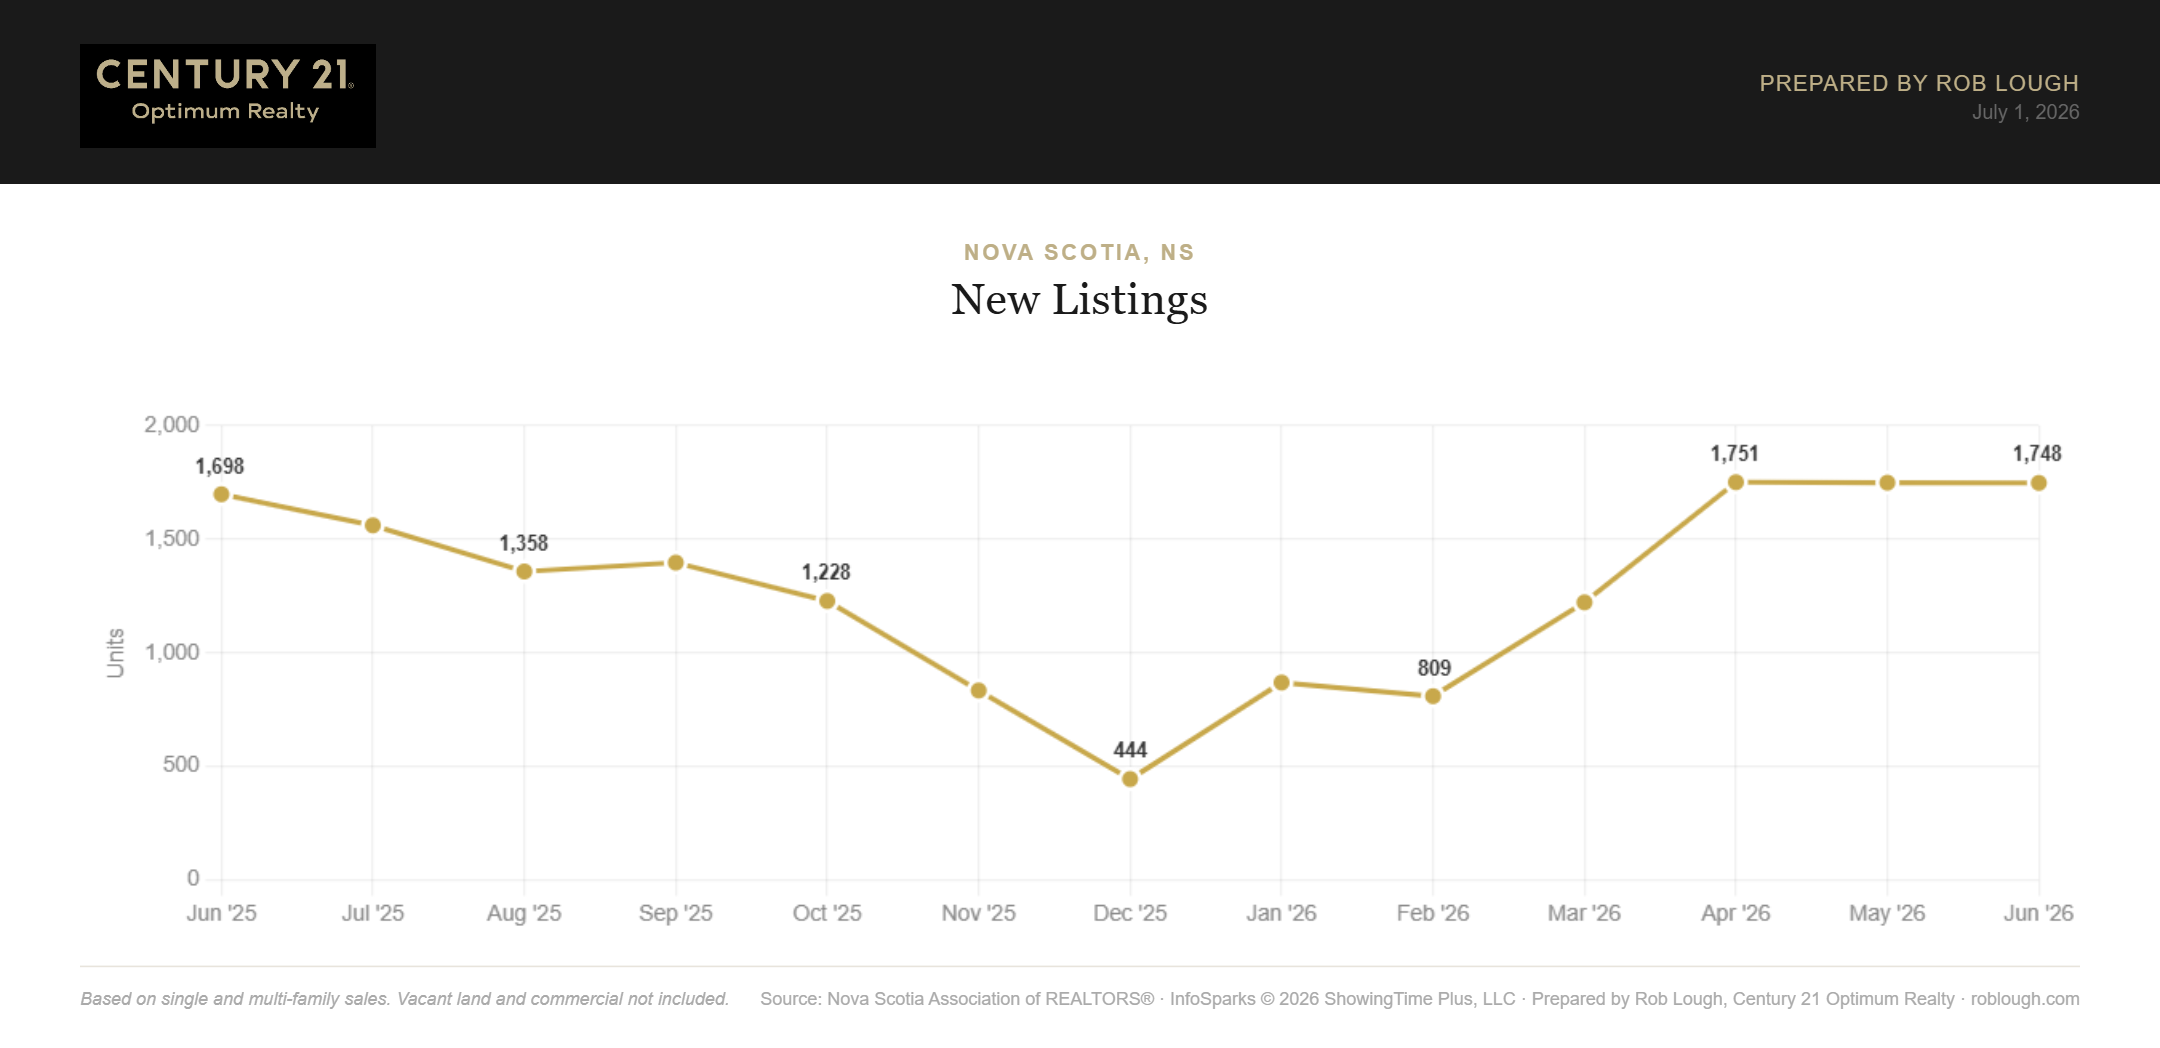
New listings came in at 1,748 in June, essentially unchanged from May’s 1,749 and up 2.9% from June 2025’s 1,698. Sellers are continuing to list at a healthy pace heading into summer.

Nova Scotia Real Estate Market Statistics June 2026 number of new listings

Nova Scotia Real Estate Market Statistics June 2026 number of new listings

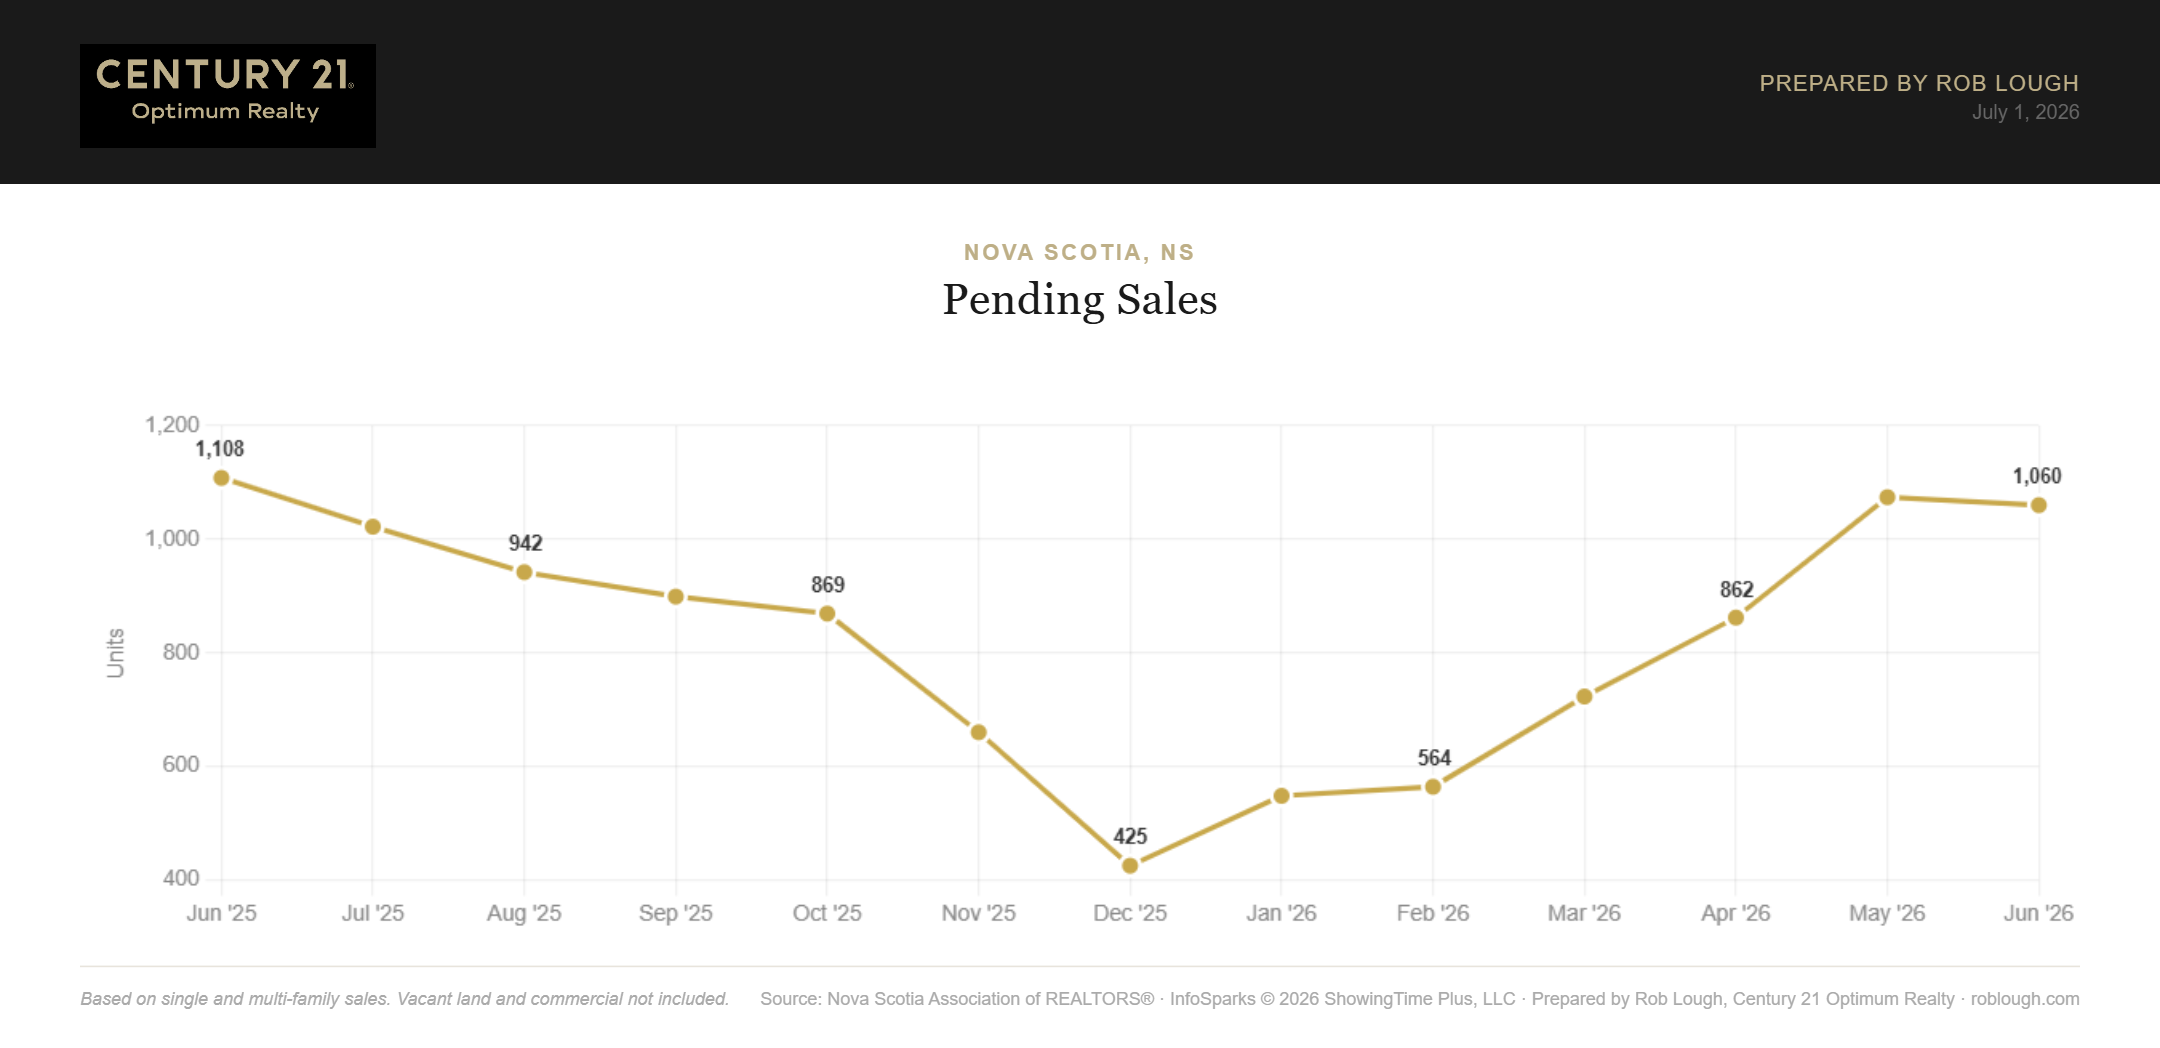
Pending sales dipped modestly to 1,060, down 1.3% from May and 4.3% below June 2025’s 1,108. With inventory rising faster than pending sales, the balance of negotiating power is edging toward buyers. Browse current Nova Scotia listings with our team.

Nova Scotia Real Estate Market Statistics June 2026 number of pending sales

Nova Scotia Real Estate Market Statistics June 2026 number of pending sales


Prices Ease From May, Hold Flat Year-Over-Year

The average sales price came in at $496,578 in June 2026, down 3.0% from May’s $512,037 but essentially unchanged from June 2025’s $497,883 (down just 0.3%) prices have stabilized over the past year despite month-to-month swings.

Nova Scotia Real Estate Market Statistics June 2026 average sales price

Nova Scotia Real Estate Market Statistics June 2026 average sales price

The median sales price was $460,000 in June, down from May’s $472,750 and exactly matching June 2025’s $460,000. For sellers wondering what their home is worth today, connect with our team at Century 21 Optimum Realty for a current market evaluation.

Nova Scotia Real Estate Market Statistics June 2026 median sales price

Nova Scotia Real Estate Market Statistics June 2026 median sales price


Dollar Volume of Closed Sales Reaches $543.3M

Total dollar volume of closed sales reached $543.26 million in June 2026, up 4.8% from May and down only 2.6% from June 2025’s $557.63 million. Total units sold climbed to 1,096, up 8.3% from May and just 2.1% below June 2025’s 1,120 – confirming that sales activity has returned to a healthy summer rhythm even as price growth has leveled off.

Nova Scotia Real Estate Market Statistics June 2026 dollar volume of Closed sales

Nova Scotia Real Estate Market Statistics June 2026 dollar volume of Closed sales


Homes Selling Faster: 42 Days on Market

Average days on market fell to 42 in June 2026, down from 46 in May and just two days off June 2025’s 40-day pace – one of the fastest readings in the trailing 13 months. Well-priced homes continue to move quickly.

Nova Scotia Real Estate Market Statistics June 2026 average days on market

Nova Scotia Real Estate Market Statistics June 2026 average days on market

If your home has been sitting on the market, or you’re weighing when to list this summer, our agents at Century 21 Optimum Realty can review your pricing strategy to make sure you’re positioned to sell efficiently.


Sale Price Ratios Continue to Soften

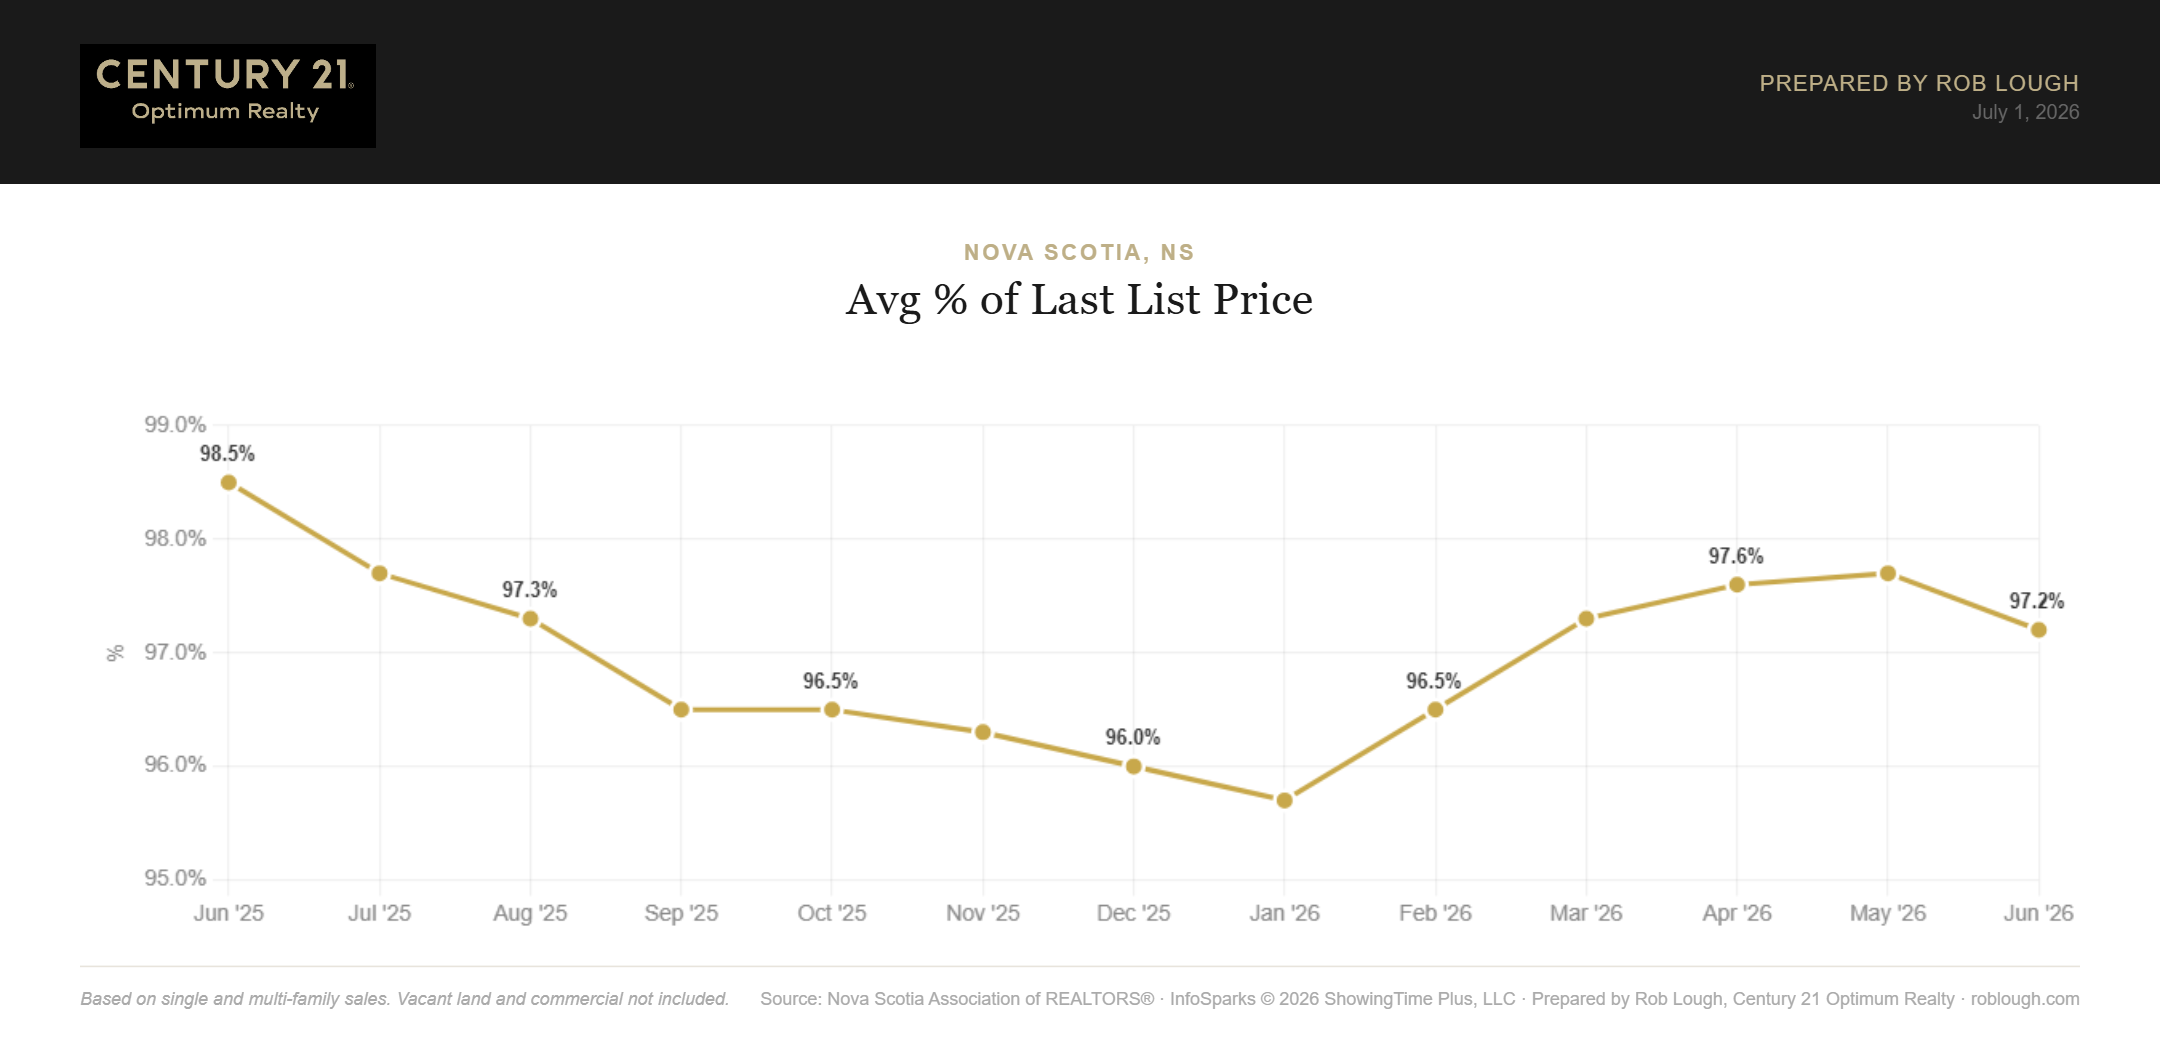
The average sale-to-list price ratio slipped to 97.2% in June, down from 97.7% in May and 98.5% a year ago – the lowest reading since January 2026.

Nova Scotia Real Estate Market Statistics June 2026 average % of last list price

Nova Scotia Real Estate Market Statistics June 2026 average % of last list price

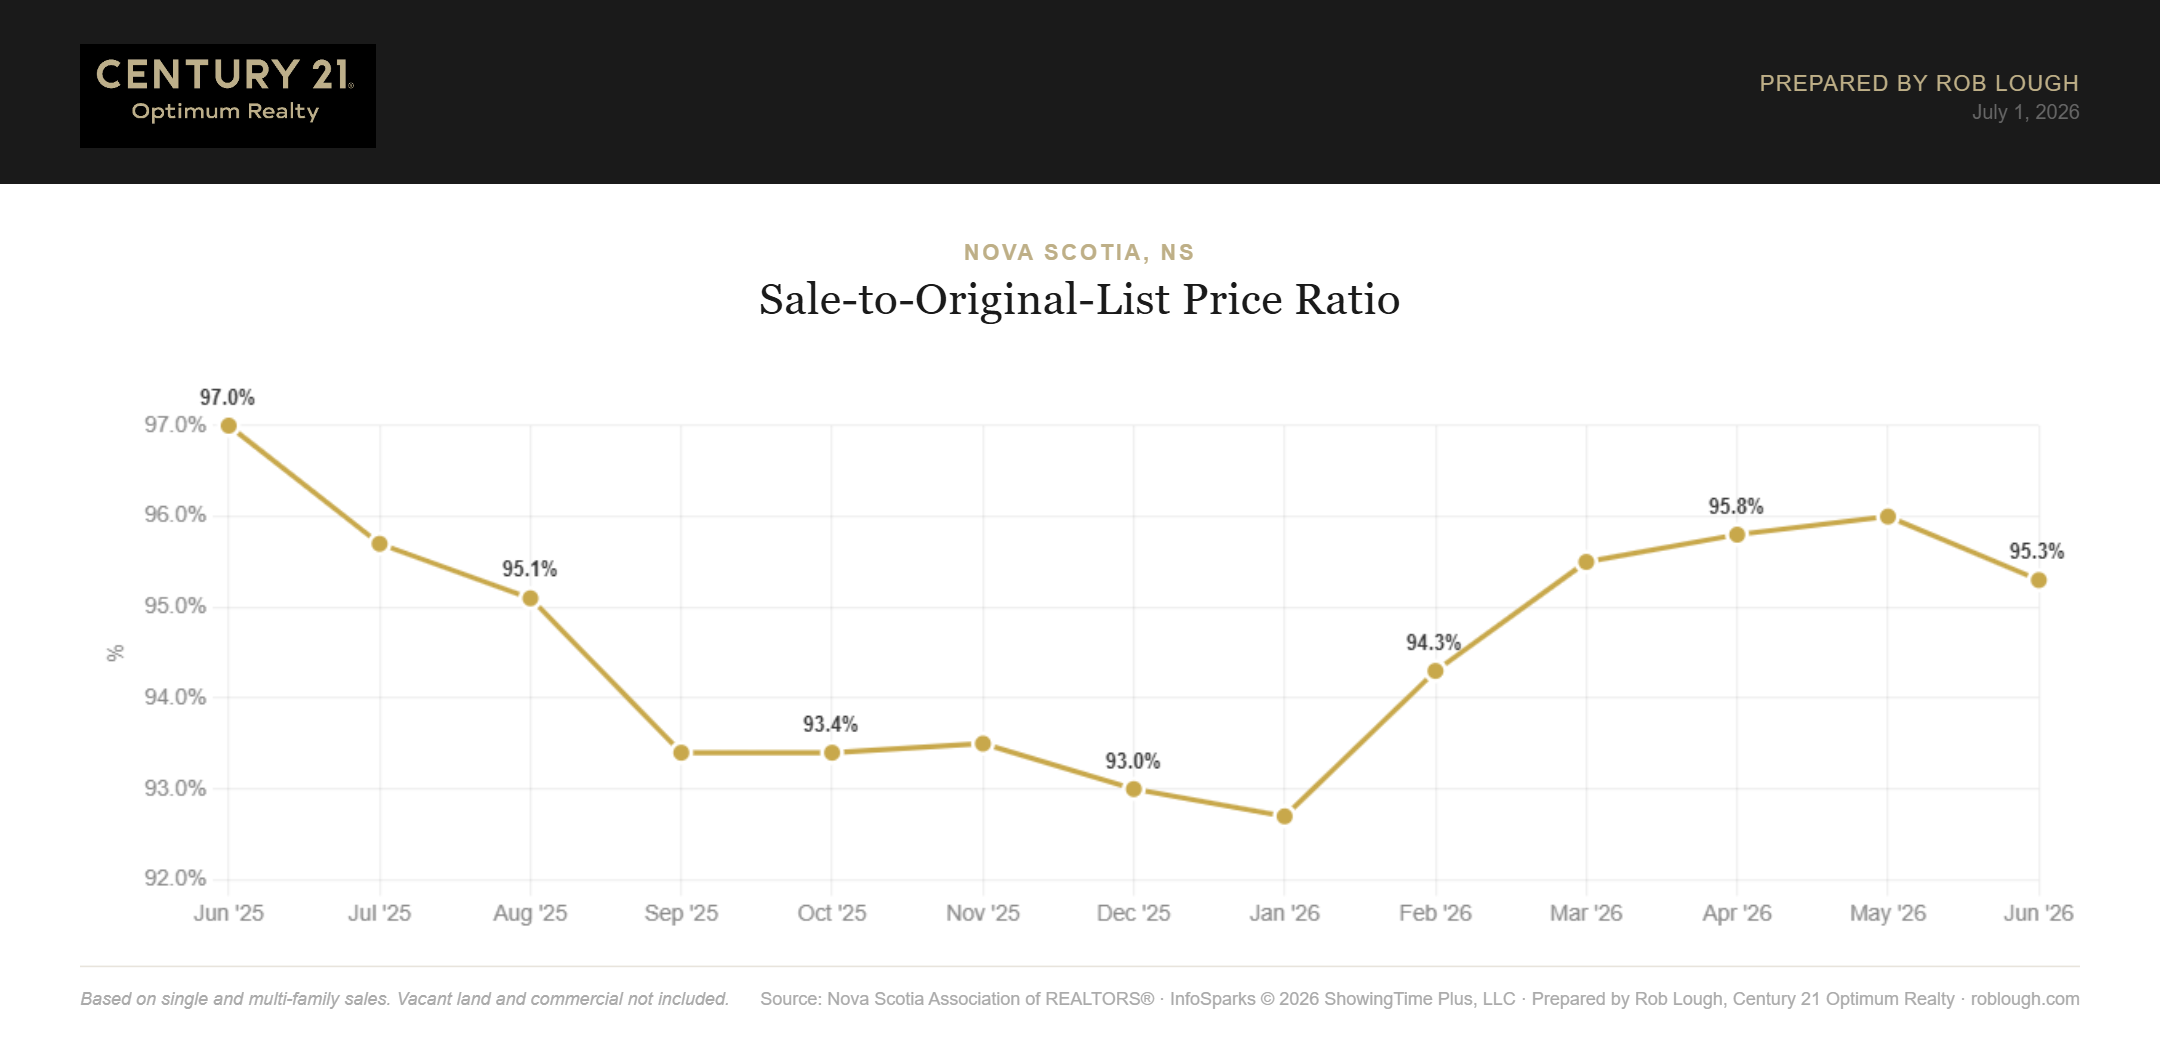
The sale-to-original-list-price ratio also eased, to 95.3%, down from 96.0% in May and 97.0% in June 2025. The widening gap between the two ratios (97.2% vs. 95.3%) suggests more price reductions are happening before homes sell than we saw earlier this spring – another sign the market is tilting toward buyers.

Nova Scotia Real Estate Market Statistics June 2026 average % of original list price

Nova Scotia Real Estate Market Statistics June 2026 average % of original list price


Showing Activity Cools From Spring Peaks

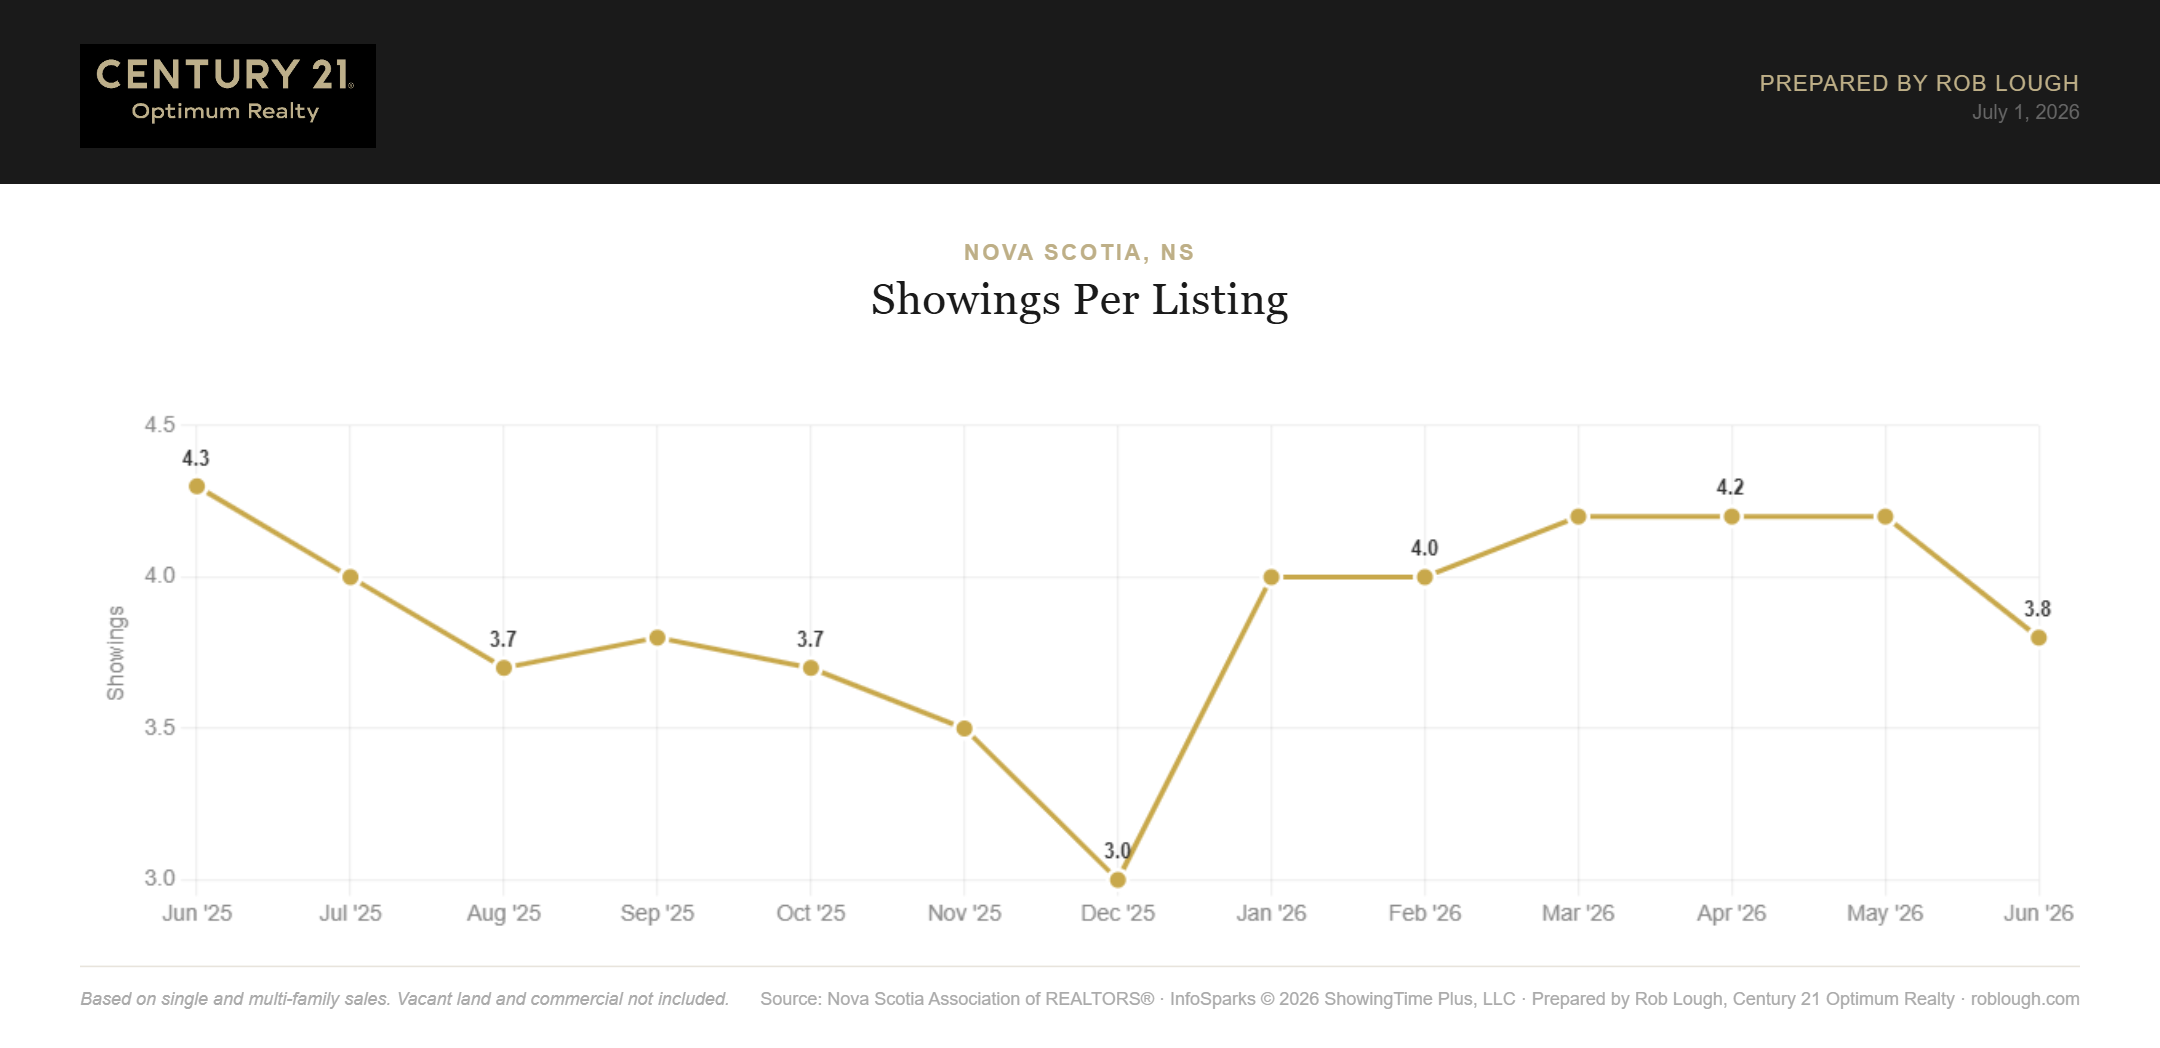
Showings per listing dropped to 3.8 in June, down from 4.2 in May and 4.3 a year ago, an 11.6% year-over-year decline.

Nova Scotia Real Estate Market Statistics June 2026 showings per listing

Nova Scotia Real Estate Market Statistics June 2026 showings per listing

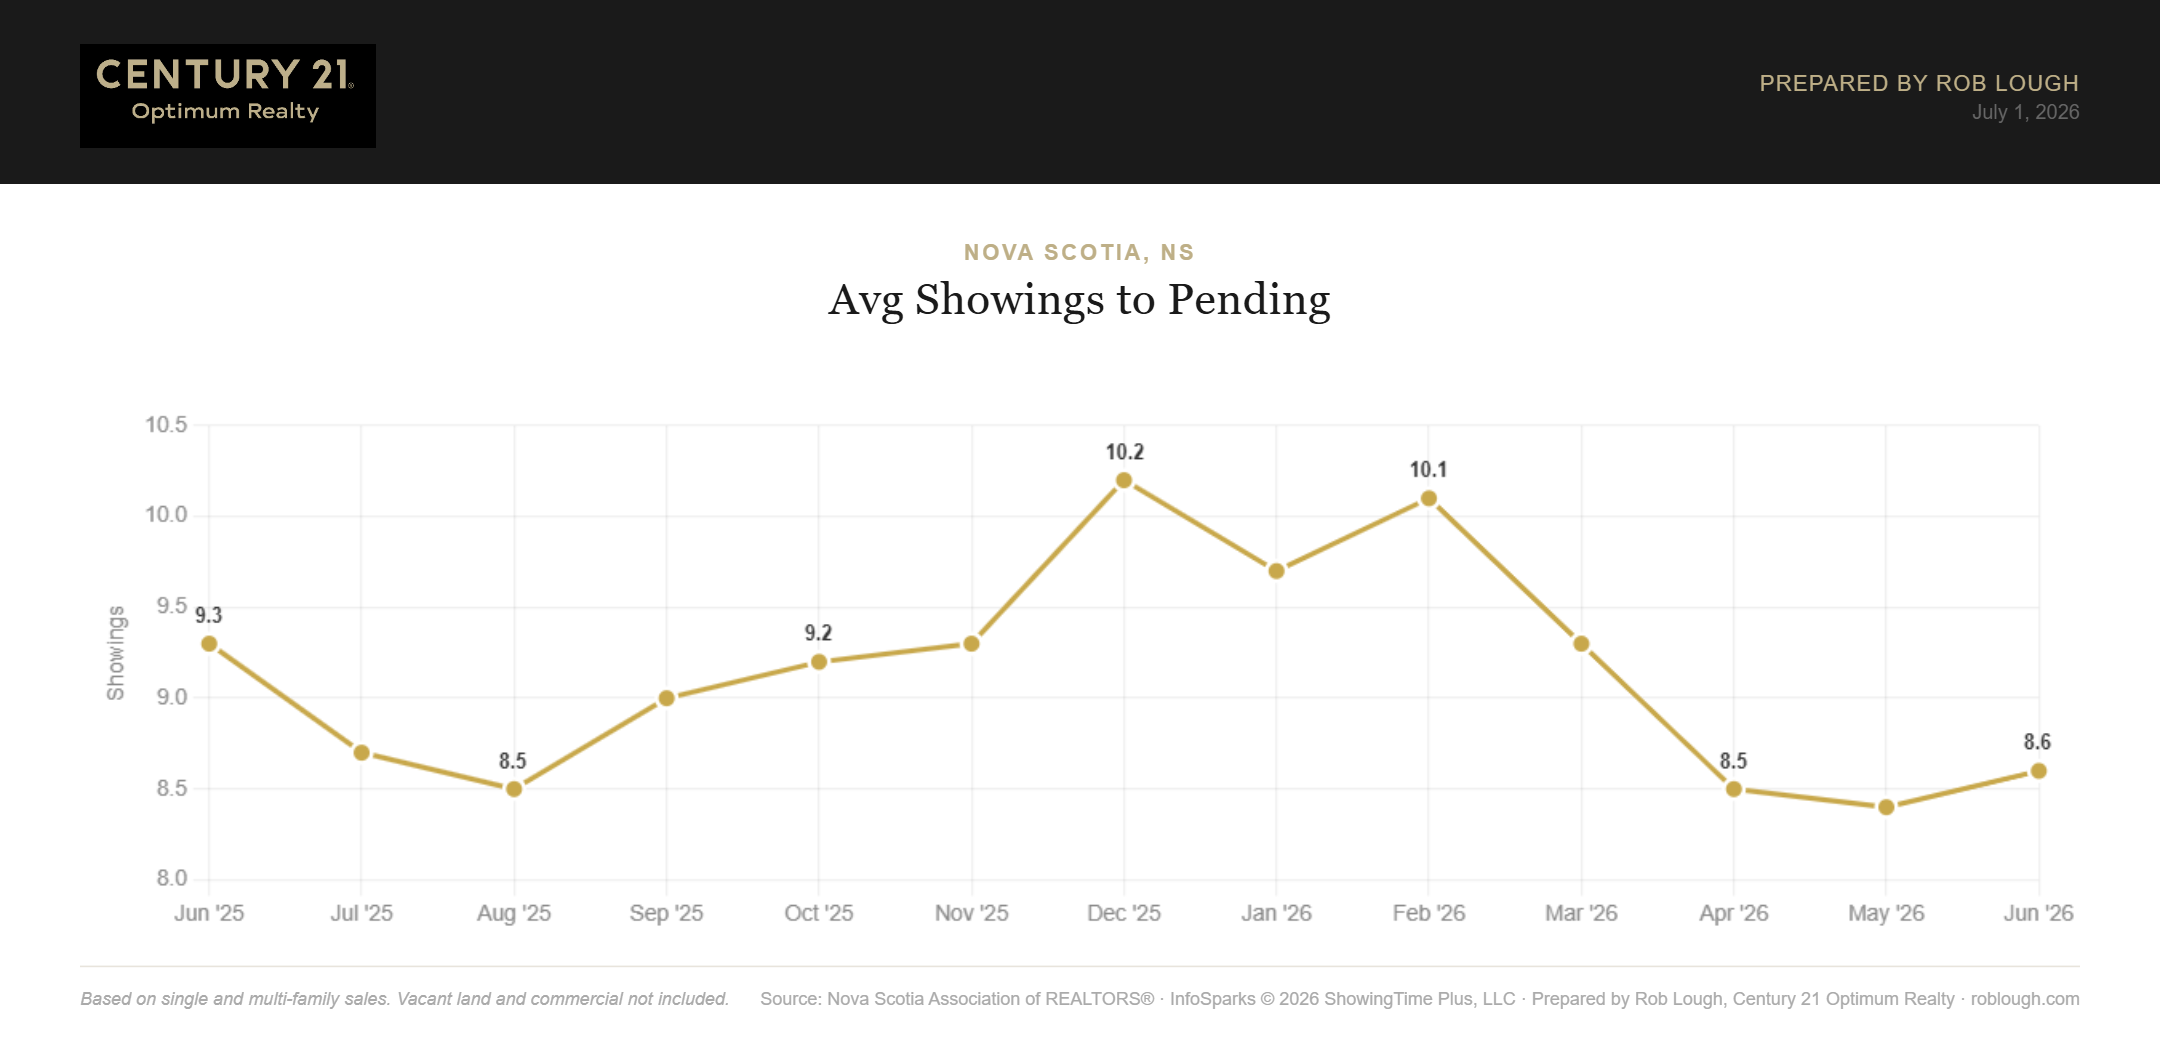
Average showings to pending ticked up slightly to 8.6, from 8.4 in May, though still well below June 2025’s 9.3. Buyers appear to be taking a bit longer to commit than earlier this spring, but conversion remains far healthier than the double-digit readings seen over the winter.

Nova Scotia Real Estate Market Statistics June 2026 average showings to pending

Nova Scotia Real Estate Market Statistics June 2026 average showings to pending


What This Means for Buyers and Sellers

For Buyers: Inventory just hit a 13-month high, days on market are among the fastest of the past year, and sellers are accepting slightly more off list price than they were in the spring. This is one of the more buyer-friendly readings of the past year. Browse current Nova Scotia listings with our team. For Sellers: Prices have held essentially flat year-over-year and homes are still moving quickly when priced well, but rising inventory and softer list-price ratios mean the easy pricing power of the spring is fading. Positioning your home correctly out of the gate matters more now than it did a few months ago. Get a free market evaluation from Century 21 Optimum Realty. Is Nova Scotia a buyer’s or seller’s market in June 2026? With 5.2 months of supply, a 13-month high, Nova Scotia is approaching the 6-month threshold that typically defines a balanced market. It’s one of the more buyer-friendly readings of the past year, though the province hasn’t fully crossed into buyer’s-market territory yet. How much do homes sell for in Nova Scotia? The average sales price was $496,578 in June 2026, down 3.0% from May but essentially flat versus June 2025’s $497,883. The median sales price was $460,000, matching June 2025 exactly. How long does it take to sell a home in Nova Scotia? Homes averaged 42 days on market in June 2026, down from 46 days in May and close to June 2025’s 40-day pace, one of the fastest readings of the trailing 13 months. How much housing inventory is available in Nova Scotia right now? Active listings reached 4,142 homes for sale in June 2026, the highest level in 13 months and up 13.0% from June 2025’s 3,666 listings. Are buyers gaining negotiating power in Nova Scotia? Yes. The average sale-to-list price ratio slipped to 97.2% in June 2026, down from 98.5% a year ago, and the sale-to-original-list ratio fell to 95.3% from 97.0%, both signs sellers are accepting more price concessions than they were last year.


About This Report

Data sourced from the Nova Scotia Association of REALTORSยฎ. Based on single and multi-family residential sales. Vacant land and commercial properties are not included. Prepared by Rob Lough, Broker/Owner, Century 21 Optimum Realty, Halifax-Dartmouth, Nova Scotia. Curious about the Halifax/Dartmouth Market Stats for June 2026? Are you a condo owner and want to know about the Halifax Dartmouth Condo Market Report for June 2026?


Related Resources

Frequently Asked Questions

Is Nova Scotia a buyer’s or seller’s market in June 2026? With 5.2 months of supply, a 13-month high, Nova Scotia is approaching the 6-month threshold that typically defines a balanced market. It’s one of the more buyer-friendly readings of the past year, though the province hasn’t fully crossed into buyer’s-market territory yet.

How much do homes sell for in Nova Scotia? The average sales price was $496,578 in June 2026, down 3.0% from May but essentially flat versus June 2025’s $497,883. The median sales price was $460,000, matching June 2025 exactly.

How long does it take to sell a home in Nova Scotia? Homes averaged 42 days on market in June 2026, down from 46 days in May and close to June 2025’s 40-day pace, one of the fastest readings of the trailing 13 months.

How much housing inventory is available in Nova Scotia right now? Active listings reached 4,142 homes for sale in June 2026, the highest level in 13 months and up 13.0% from June 2025’s 3,666 listings.

Are buyers gaining negotiating power in Nova Scotia? Yes. The average sale-to-list price ratio slipped to 97.2% in June 2026, down from 98.5% a year ago, and the sale-to-original-list ratio fell to 95.3% from 97.0%, both signs sellers are accepting more price concessions than they were last year.

Uncategorized โ€ข 1 June 2026

Nova Scotia Real Estate Market Statistics May 2026

Nova Scotia Real Estate Market Statistics May 2026

By Rob Lough, Broker/Owner | Century 21 Optimum Realty | June 1, 2026

Nova Scotia’s housing market entered the spring season with renewed momentum. May 2026 data from the Nova Scotia Association of REALTORSยฎ shows rising sales activity, firming prices, and a meaningful jump in inventory, all pointing to a market in transition. Whether you’re buying or selling, understanding these trends matters. At Century 21 Optimum Realty, we track these numbers every month so you can make informed decisions.


Inventory Rebounds: Homes for Sale Hit 3,777

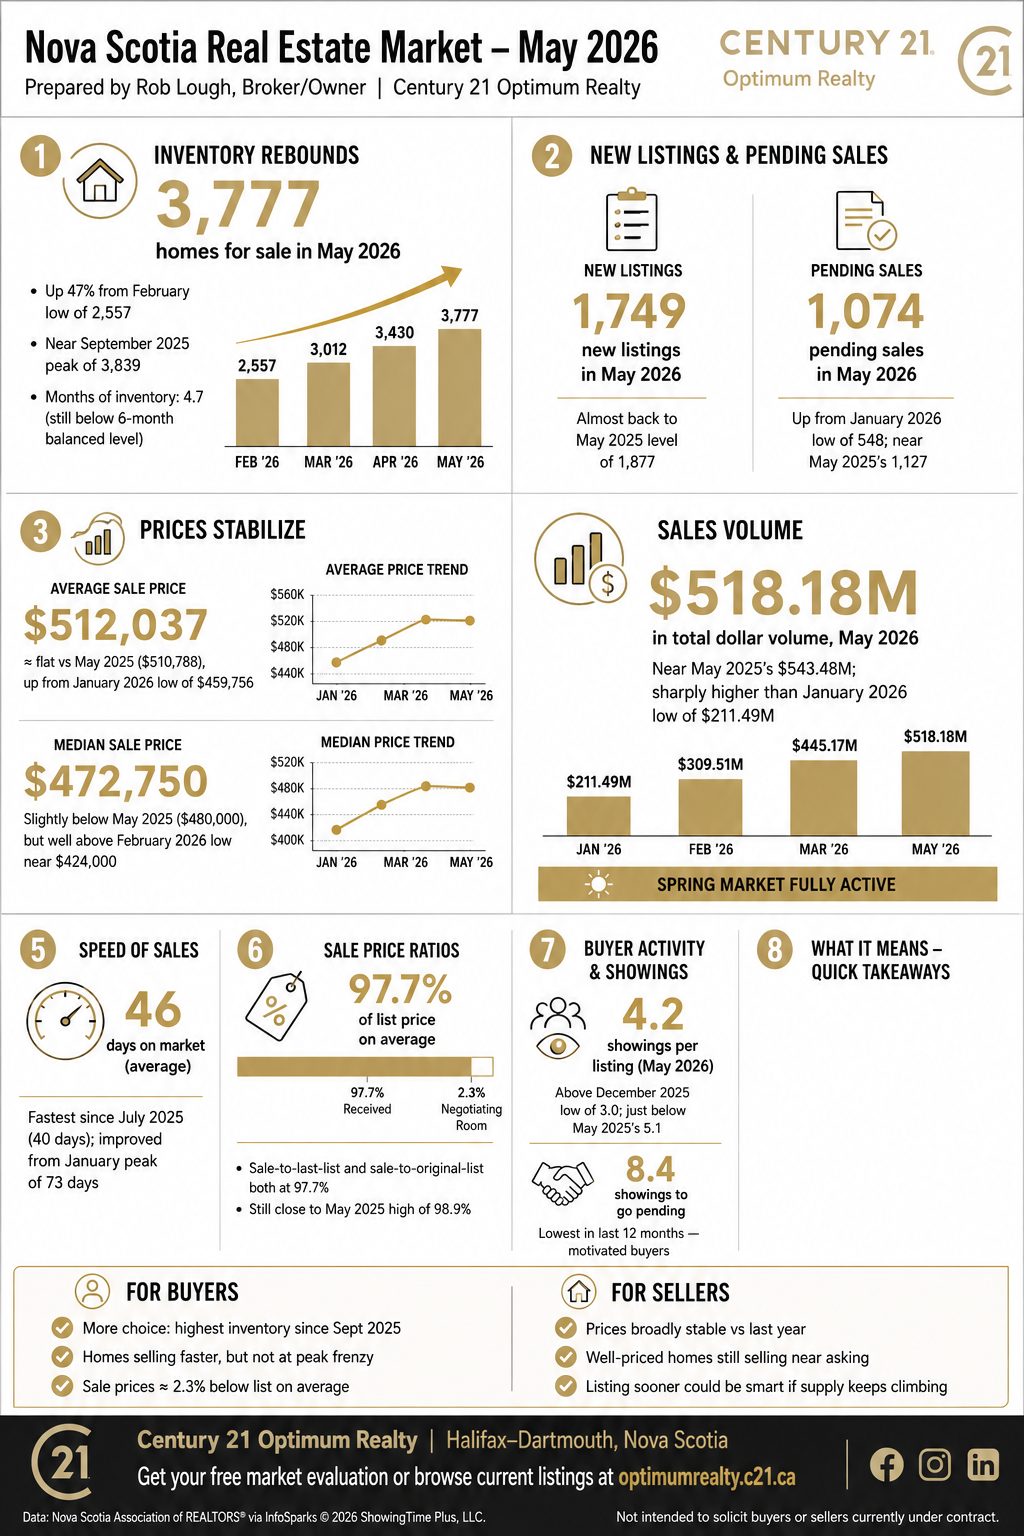
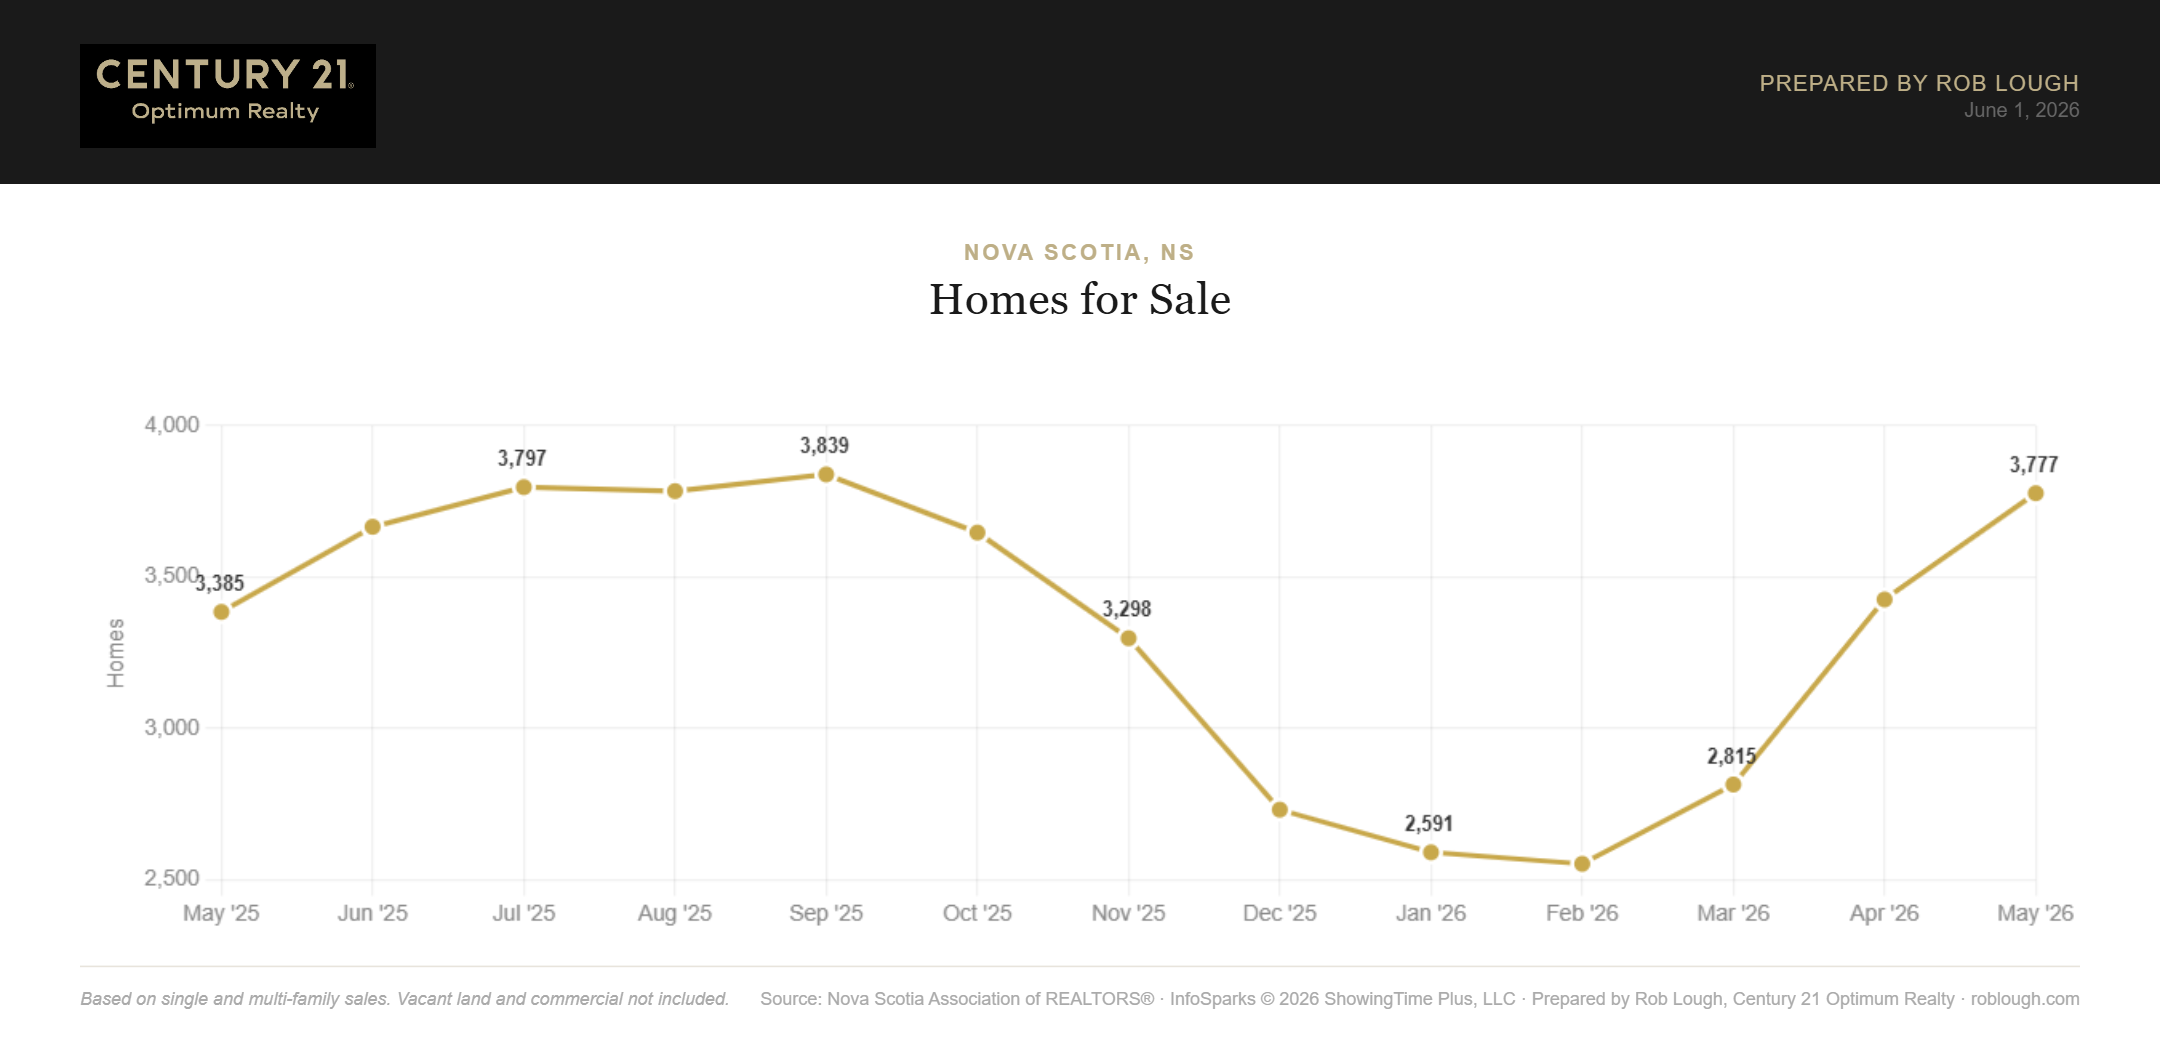
After bottoming out at a 12-month low of 2,557 in February 2026, active listings climbed sharply through the spring. Homes for sale reached 3,777 in May 2026, nearly matching the September 2025 peak of 3,839 and representing a 47% increase from the winter lows.

Nova Scotia Real Estate Market Statistics May 2026 Number of Homes for Sale

Nova Scotia Real Estate Market Statistics May 2026 Number of Homes for Sale

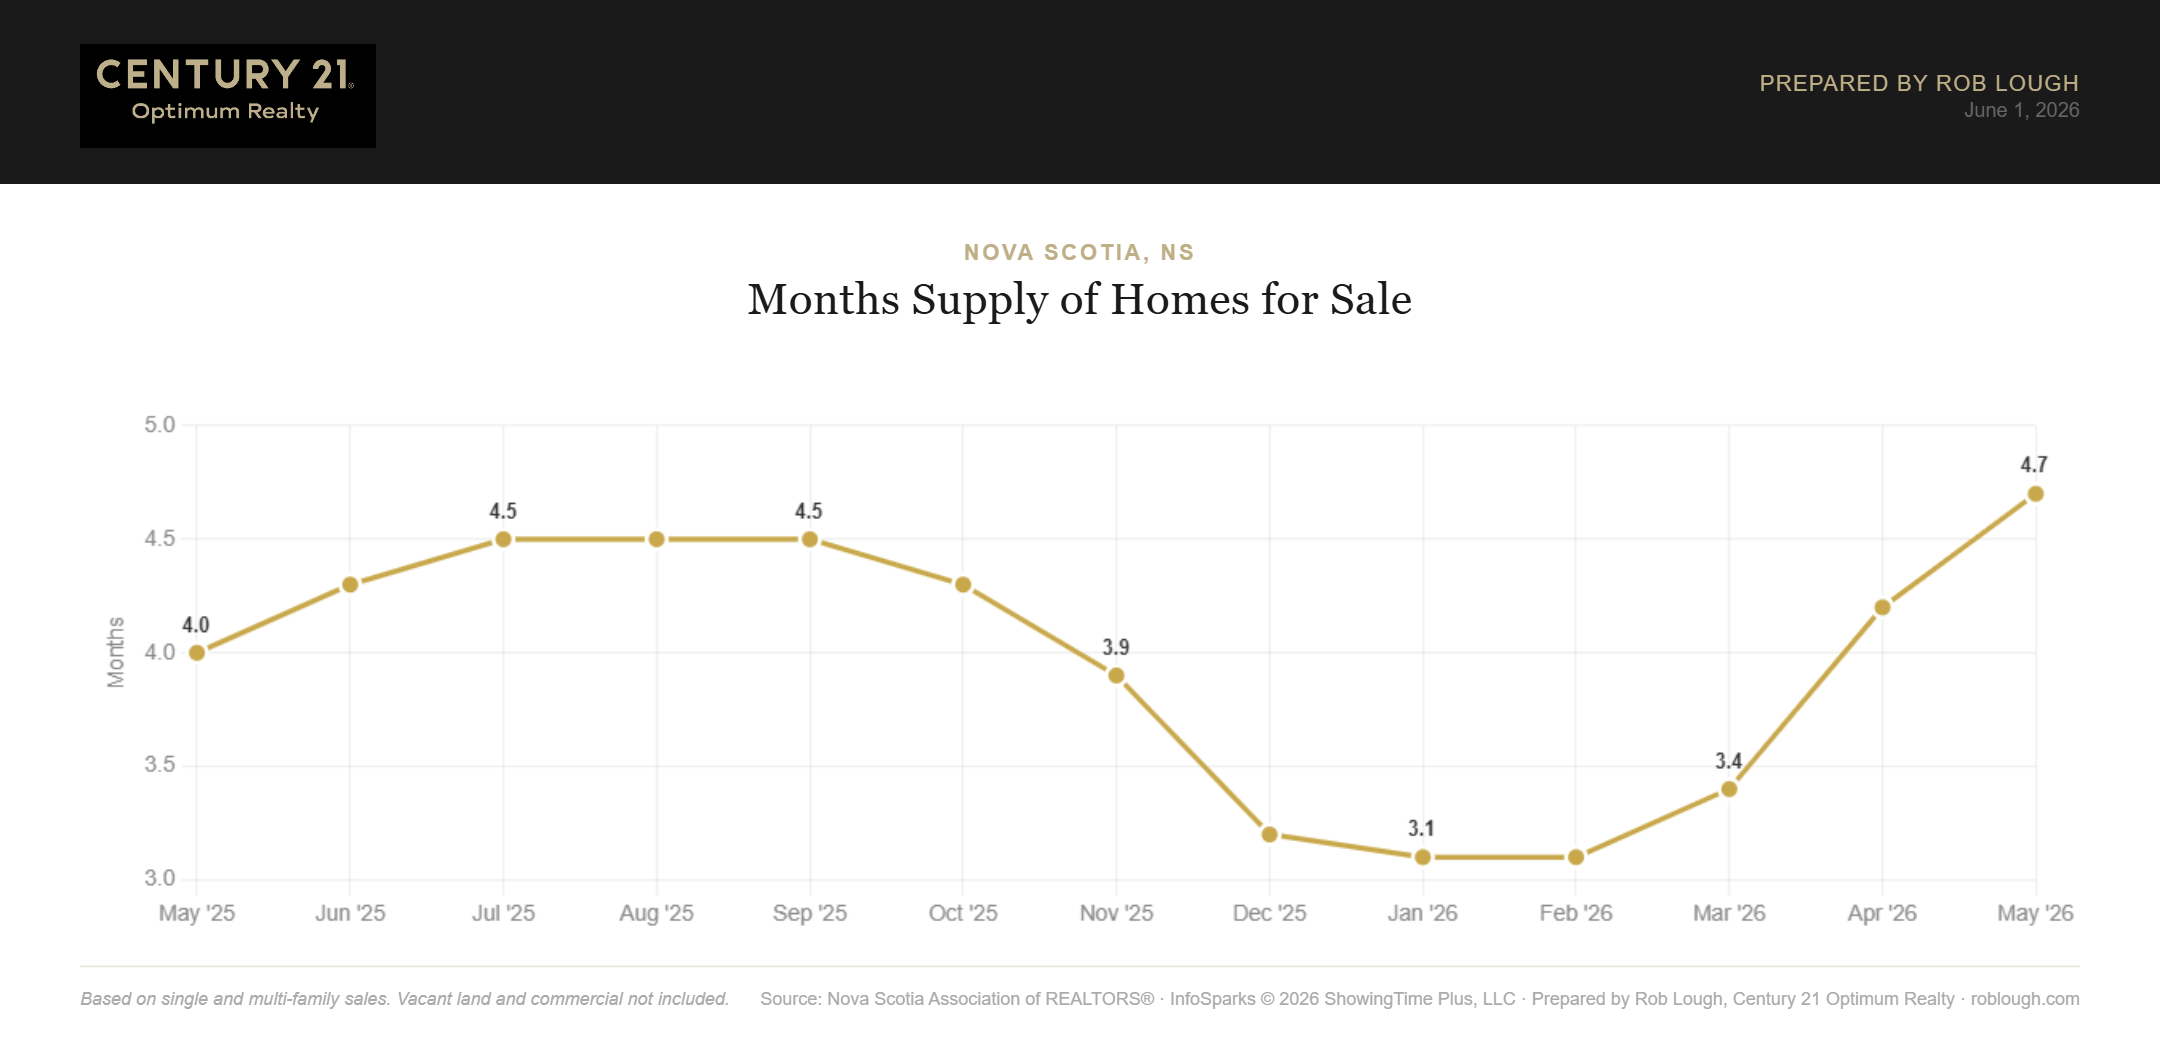
Months supply of inventory followed the same trajectory, rising from a tight 3.1 months in January to 4.7 months in May. While still below the 6-month threshold that defines a balanced market, this shift signals improving conditions for buyers. If you’re considering a purchase, our team at Century 21 Optimum Realty can help you navigate what this means for negotiating power in your target area.

Nova Scotia Real Estate Market Statistics May 2026 months supply of inventory for sale

Nova Scotia Real Estate Market Statistics May 2026 months supply of inventory for sale


New Listings and Pending Sales Both Surge in Spring

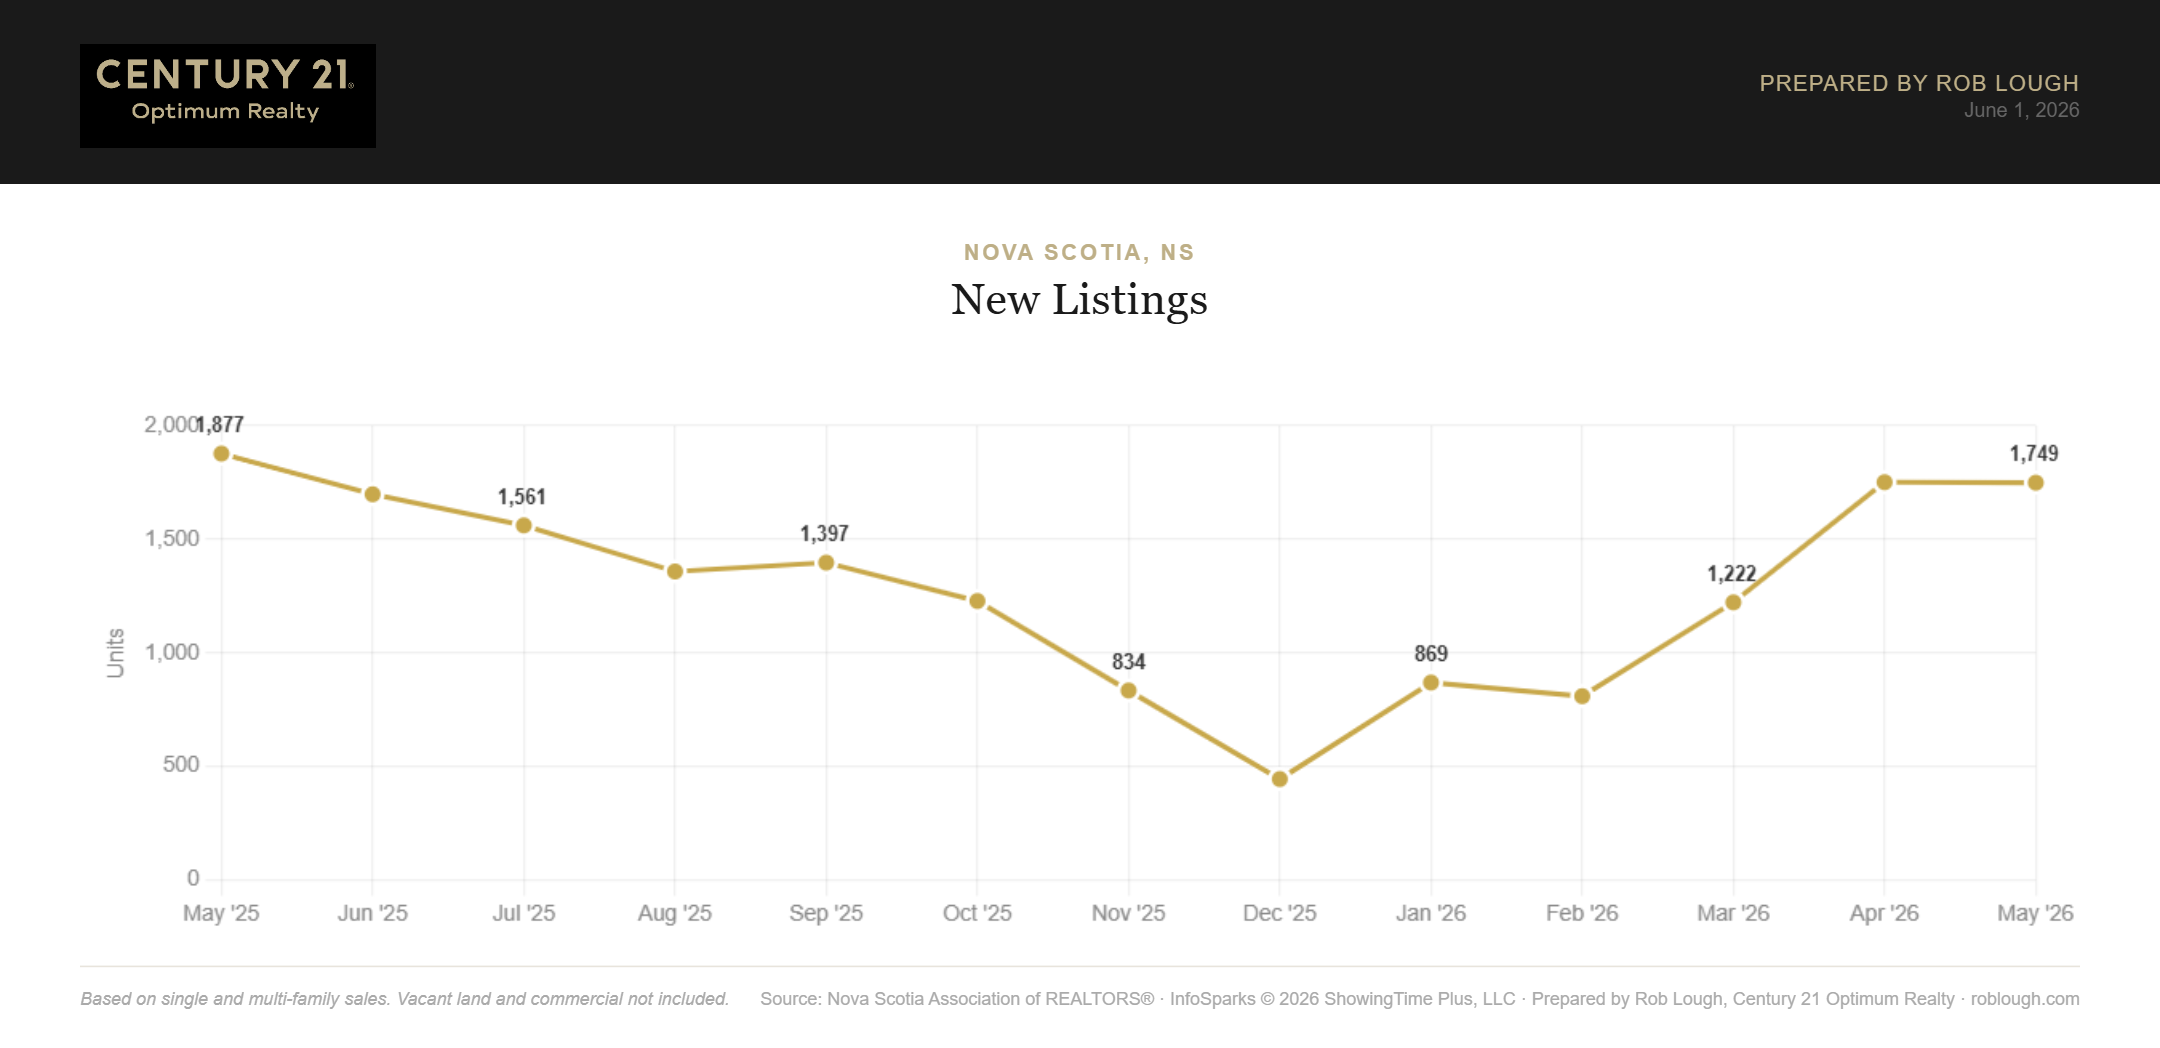
New listings came in at 1,749 in May 2026, nearly matching the spring 2025 pace of 1,877. The fall-off through winter (bottoming at just 434 in December) has clearly reversed, giving buyers more options heading into summer.

Nova Scotia Real Estate Market Statistics May 2026 Number of new listings

Nova Scotia Real Estate Market Statistics May 2026 Number of new listings

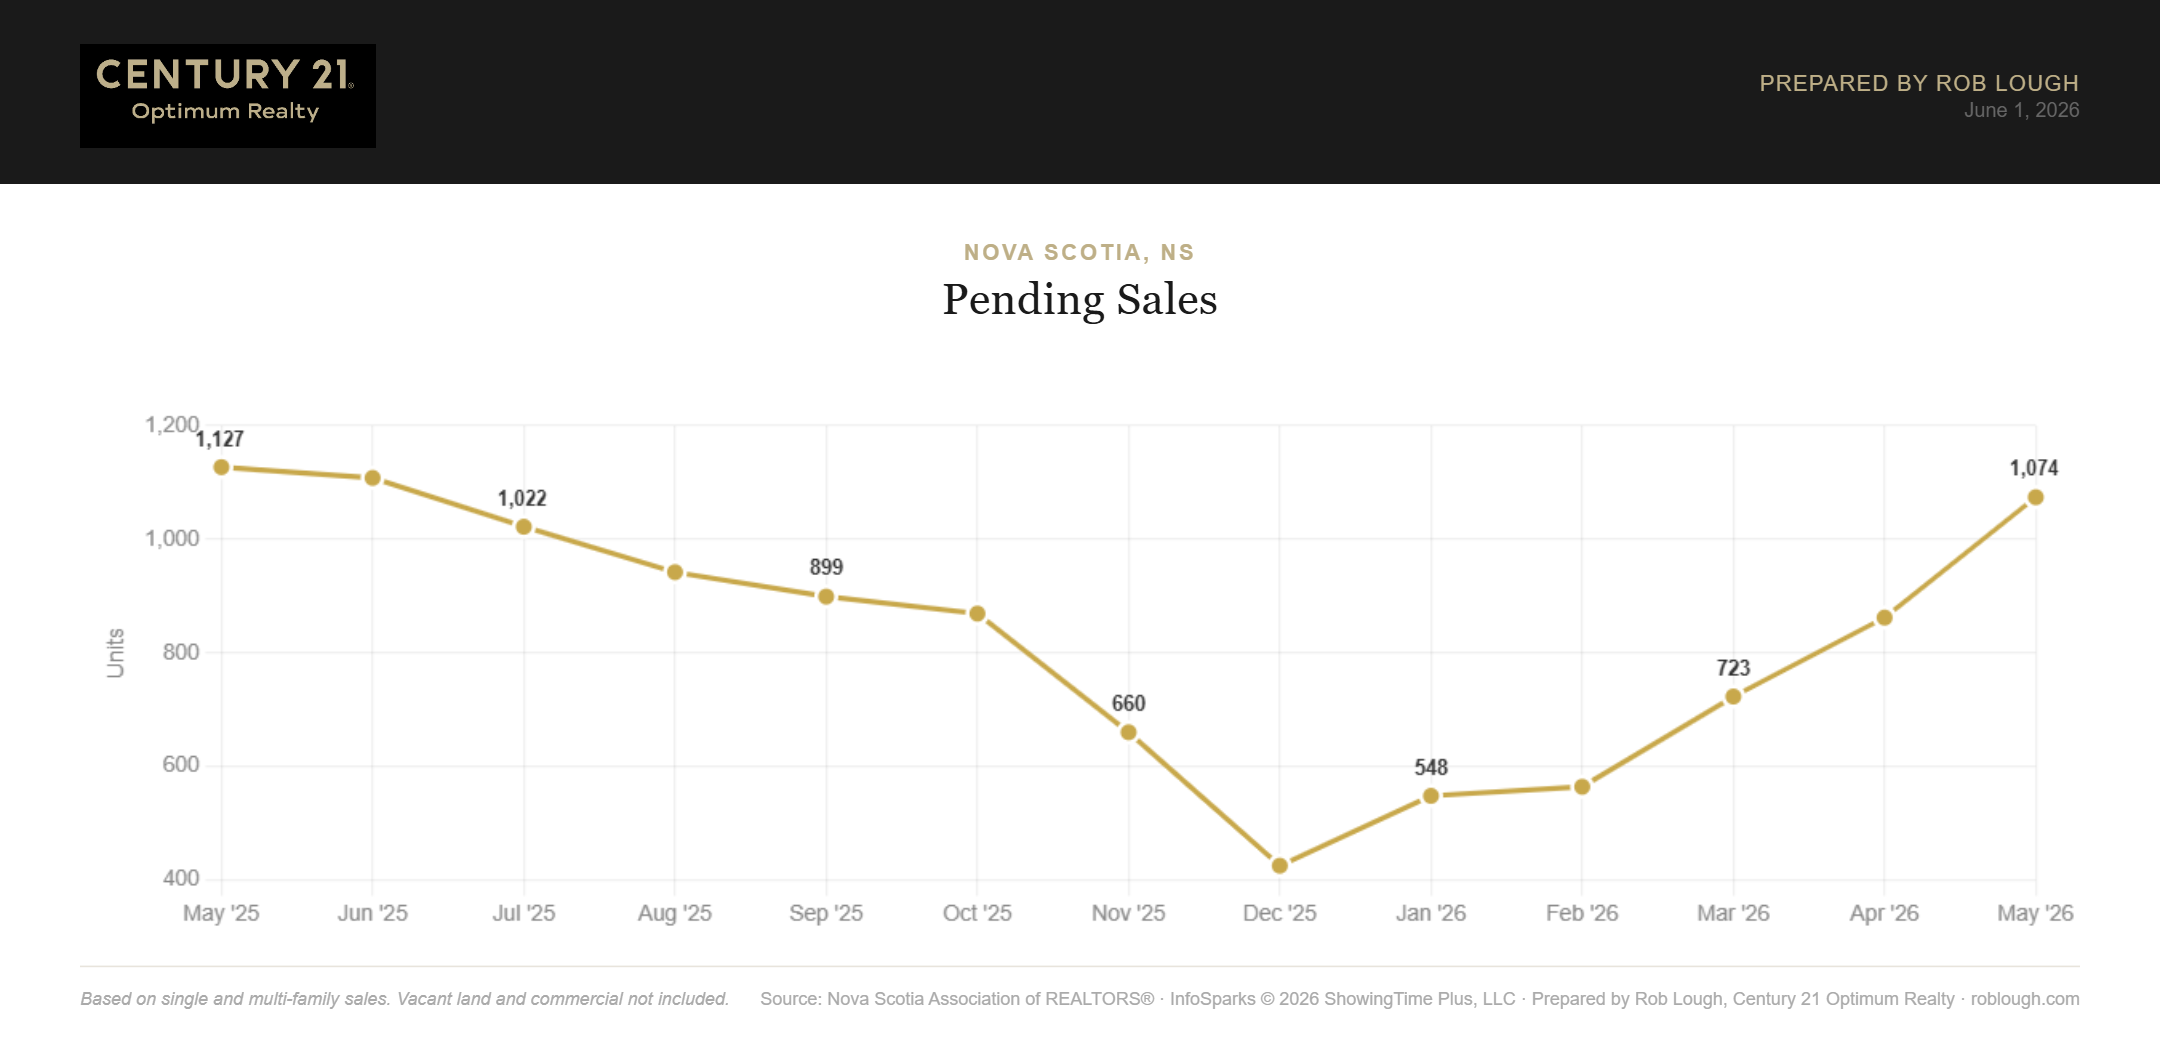
Pending sales hit 1,074 in May, up significantly from the January 2026 trough of 548 and nearly on par with May 2025’s 1,127. This strong buyer re-engagement suggests that lower interest rates and improved inventory are drawing sidelined purchasers back into the market. Our listing search and buyer resources can help you find what’s available right now across Halifax-Dartmouth and beyond.

Nova Scotia Real Estate Market Statistics May 2026 Number of pending sales

Nova Scotia Real Estate Market Statistics May 2026 Number of pending sales


Prices Stabilize Near $512,000 Average

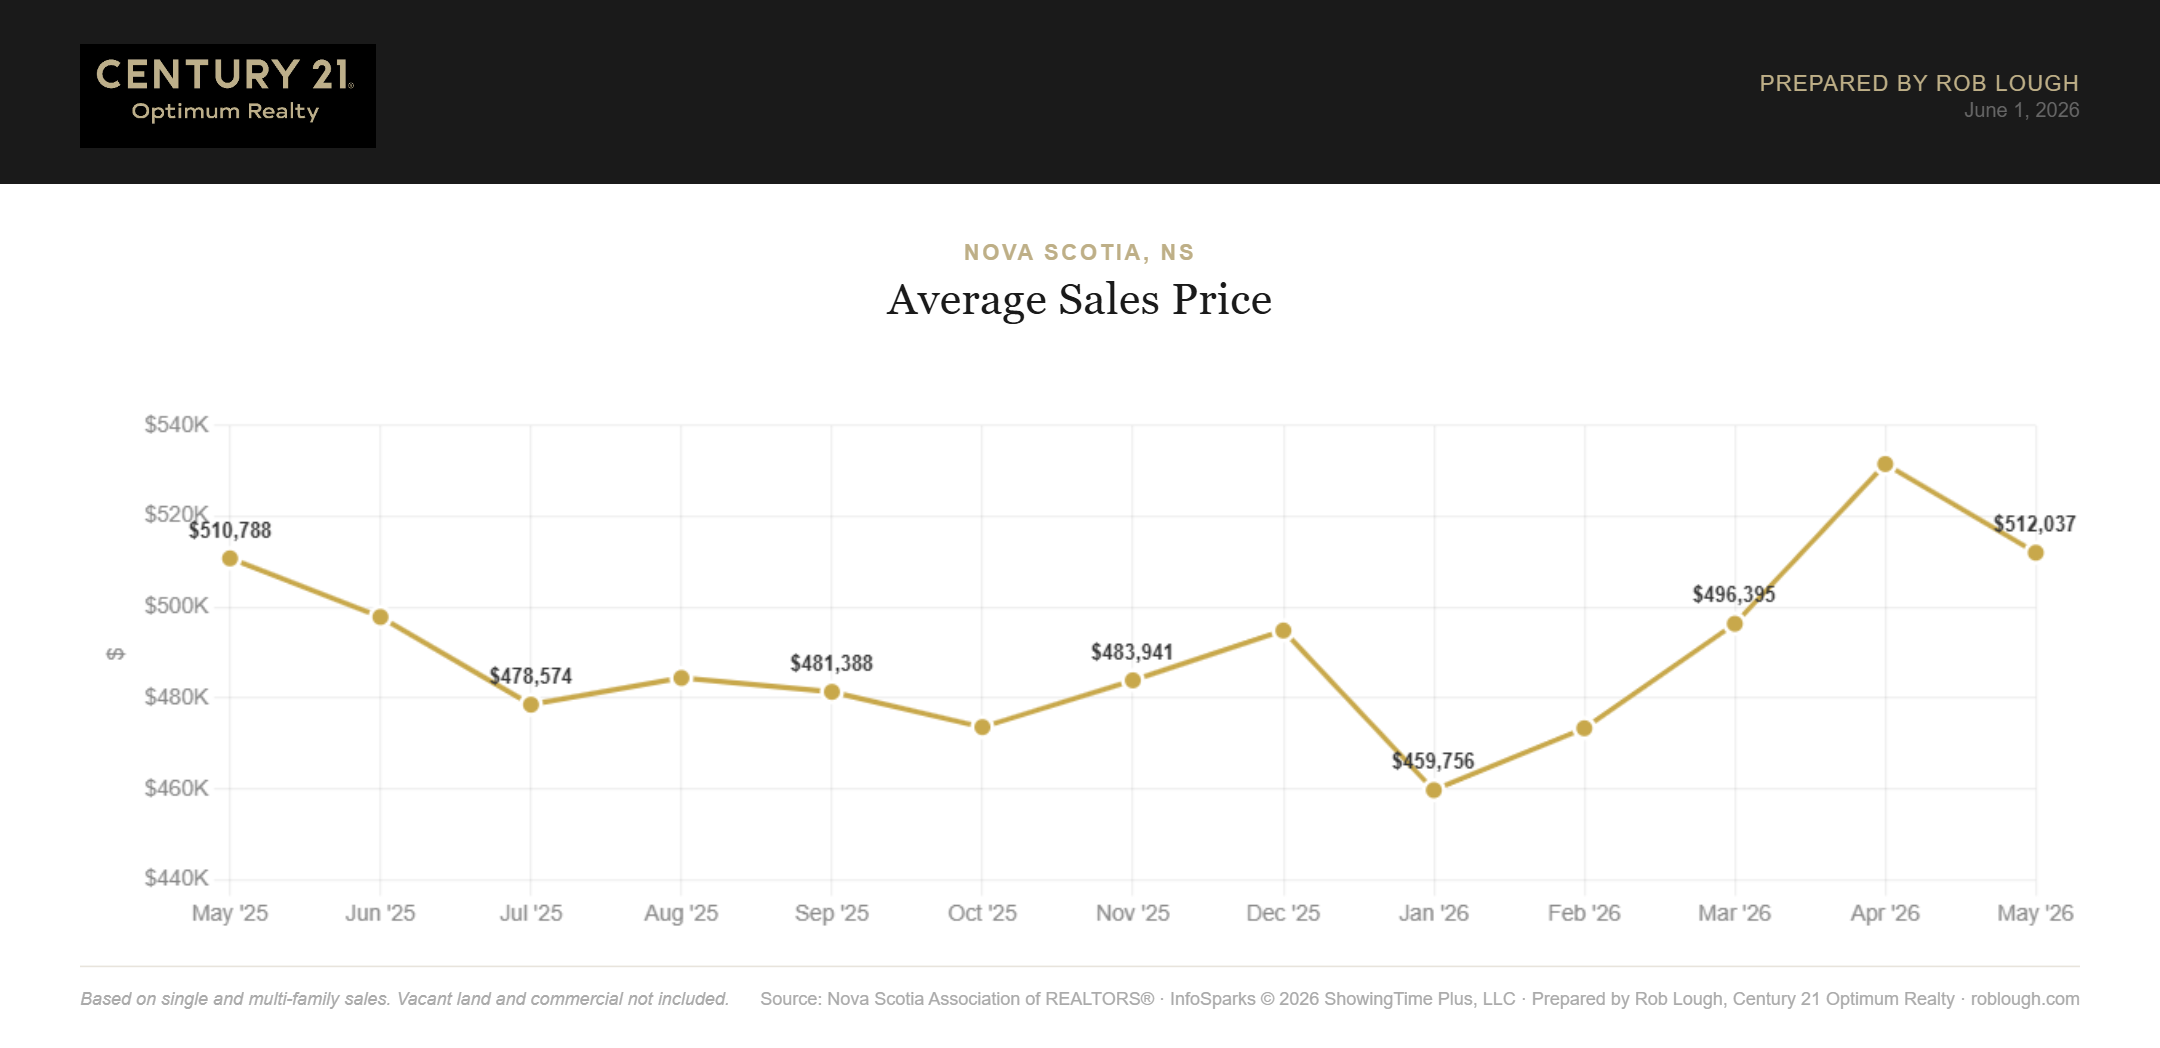
The average sales price in Nova Scotia reached $512,037 in May 2026, recovering well from the January low of $459,756 and settling close to the May 2025 benchmark of $510,788. Year-over-year, prices are essentially flat, up about 0.2%, a remarkable stabilization after the volatility seen through 2024 and into early 2025.

Nova Scotia Real Estate Market Statistics May 2026 average sales price

Nova Scotia Real Estate Market Statistics May 2026 average sales price

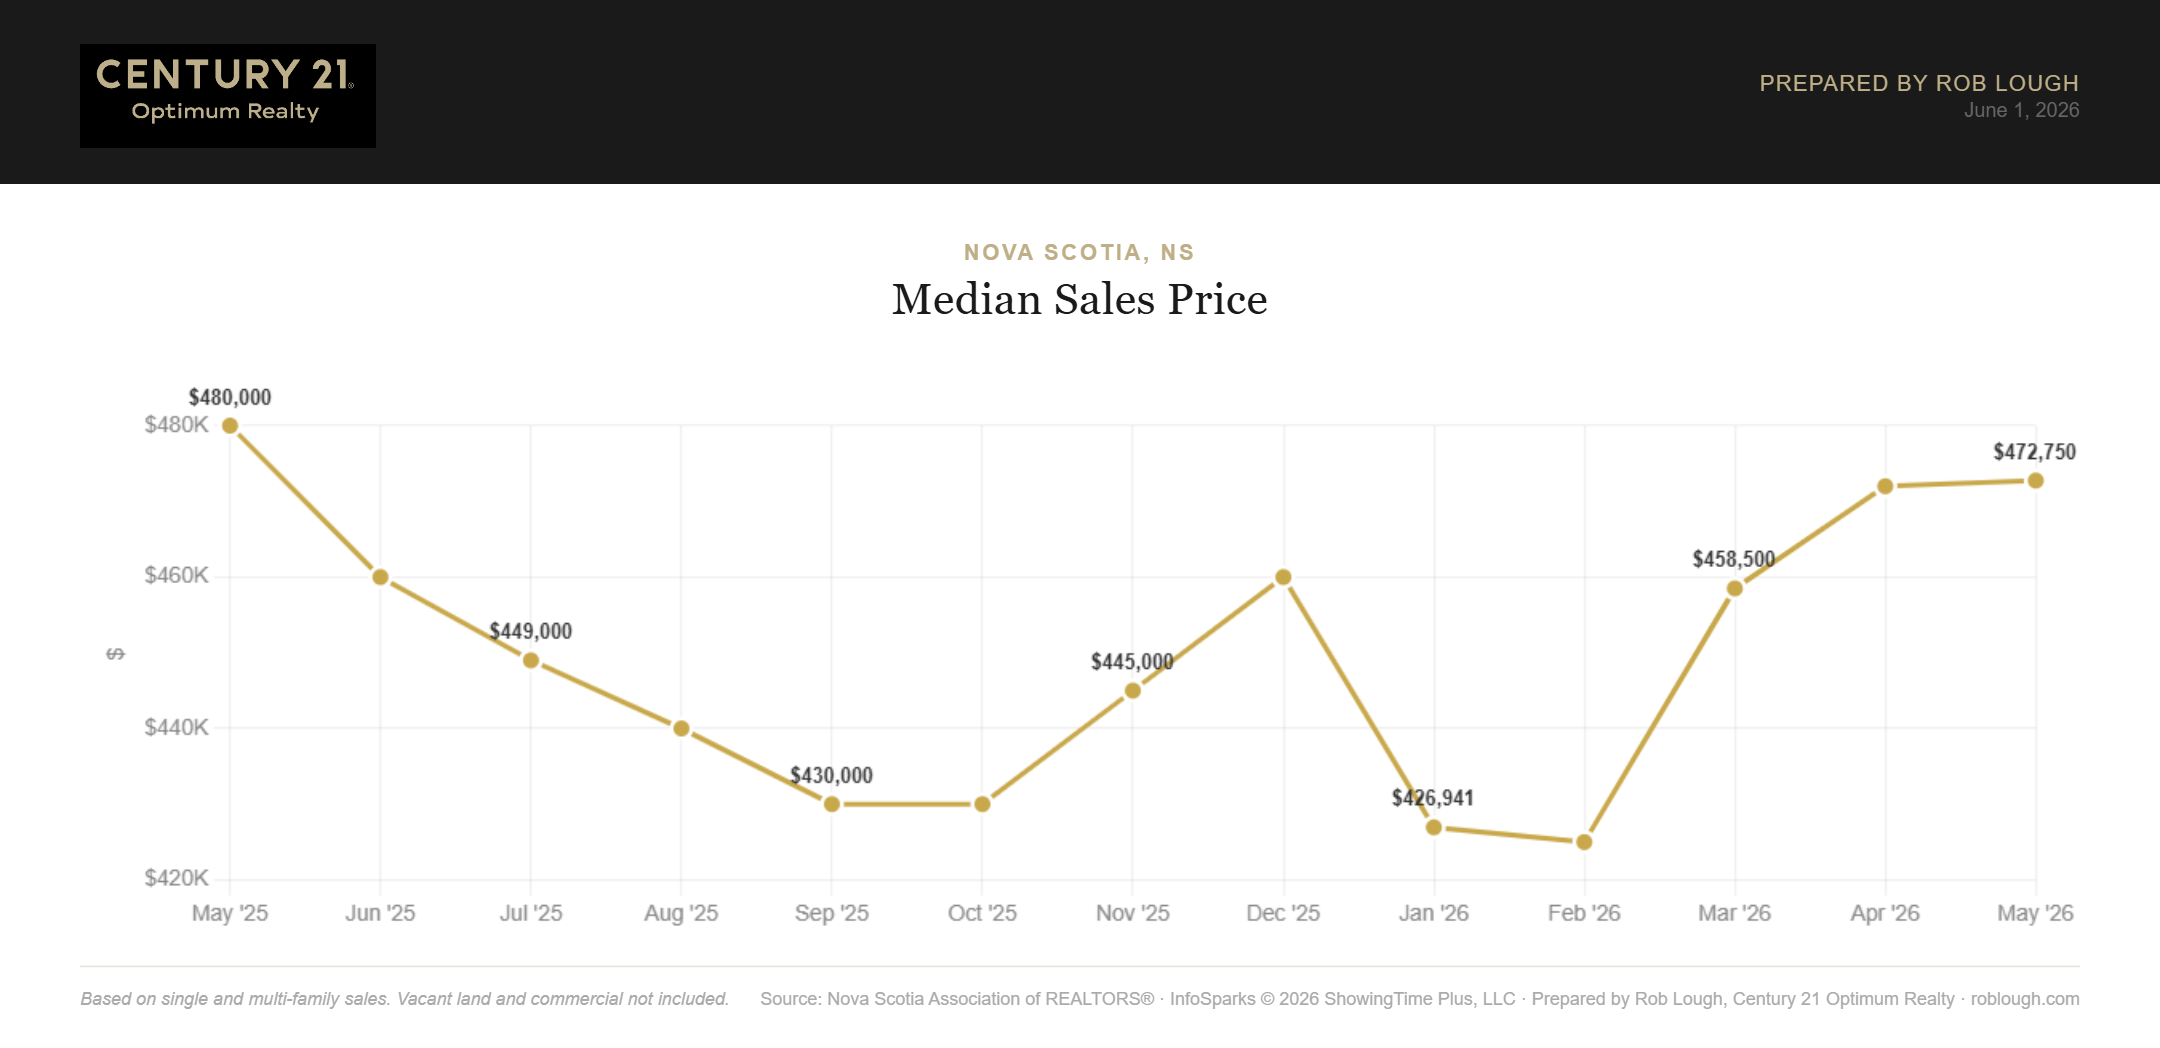
The median sales price tells a similar story. At $472,750 in May 2026, the median is down modestly from $480,000 in May 2025 but has rebounded strongly from the February 2026 low near $424,000. For sellers wondering what their home is worth today, connect with our team at Century 21 Optimum Realty for a current market evaluation.

Nova Scotia Real Estate Market Statistics May 2026 median sales price

Nova Scotia Real Estate Market Statistics May 2026 median sales price


Dollar Volume of Closed Sales Approaches $518M

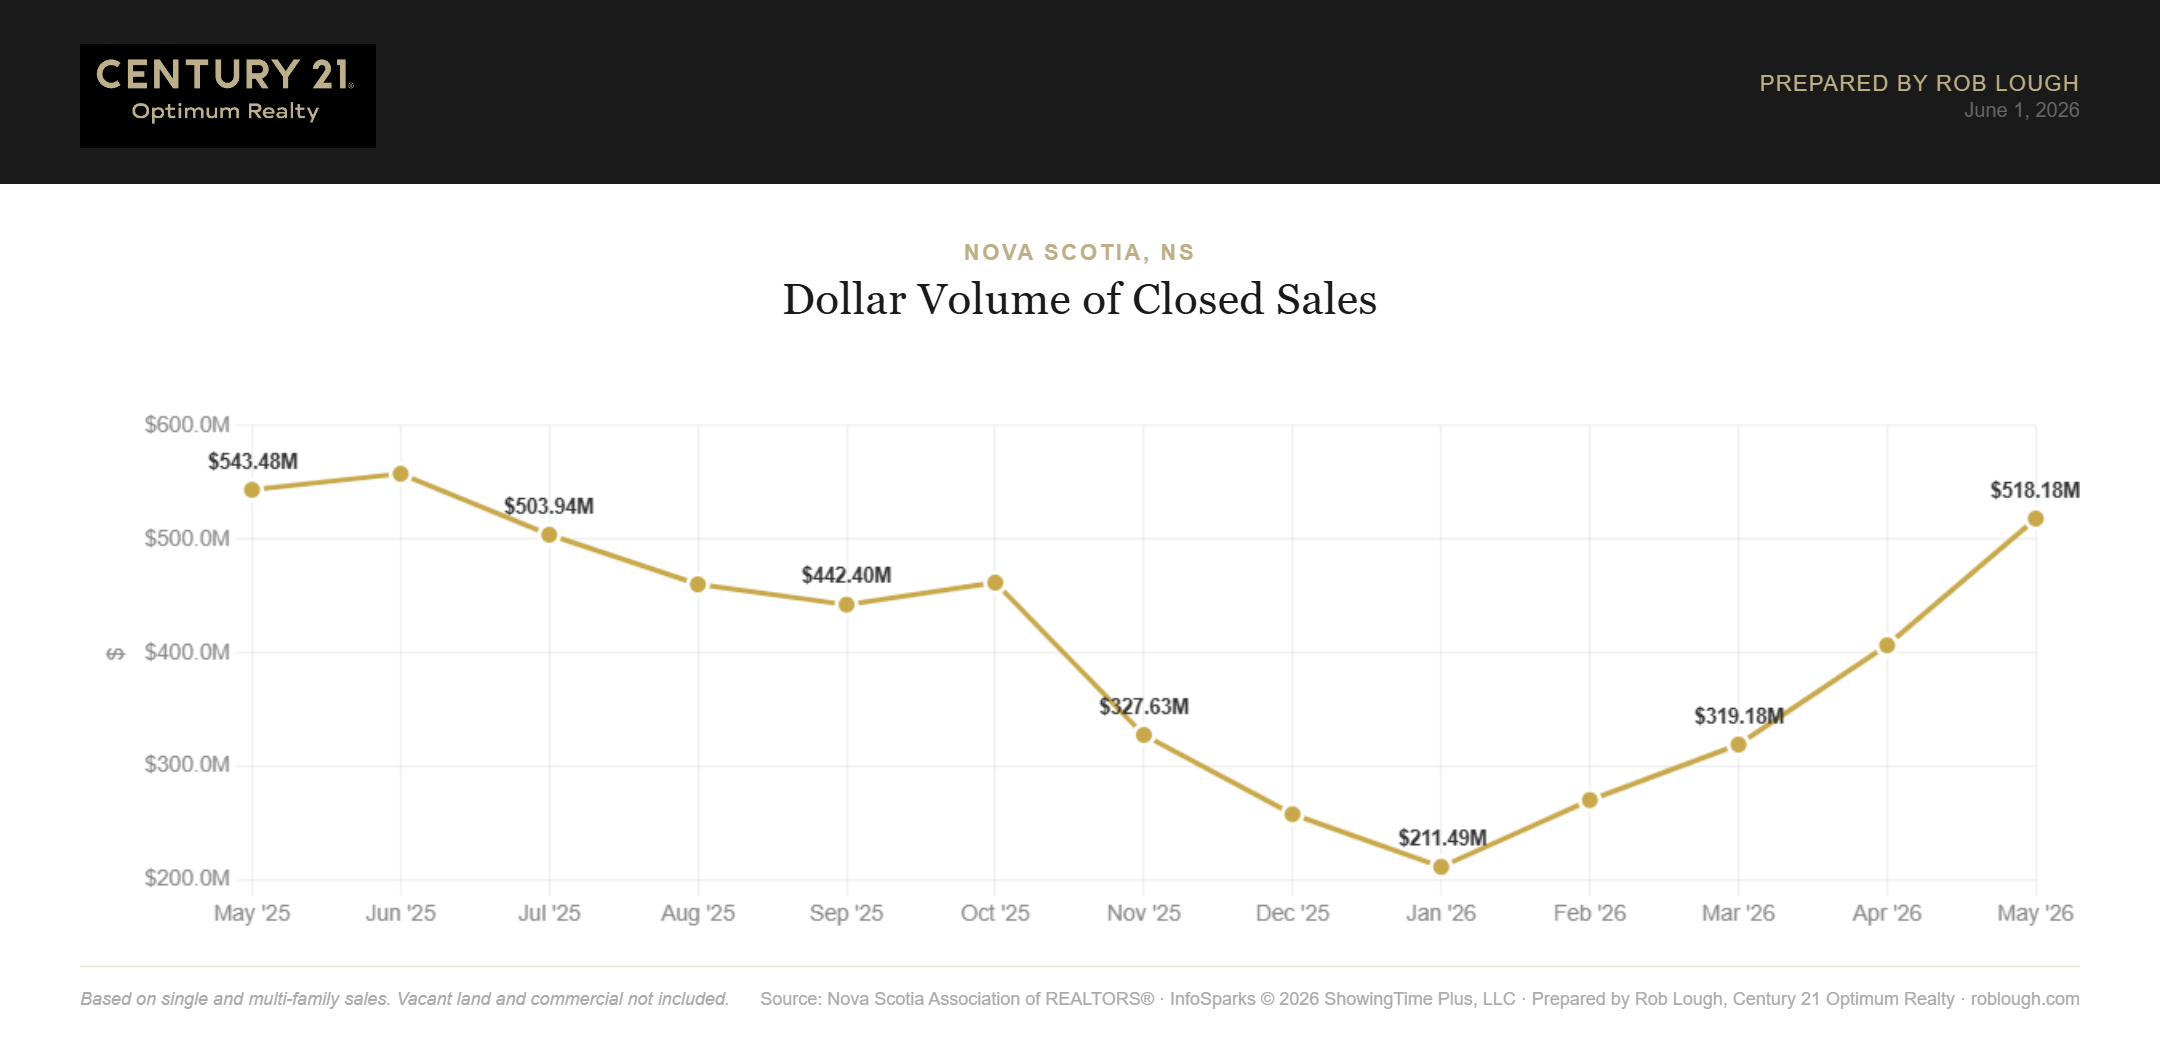
Total dollar volume of closed sales reached $518.18 million in May 2026, virtually matching May 2025’s $543.48M and representing a dramatic recovery from the January 2026 low of $211.49M. This is one of the clearest indicators that the Nova Scotia market has returned to full spring activity.

Nova Scotia Real Estate Market Statistics May 2026 dollar volume of closed sales

Nova Scotia Real Estate Market Statistics May 2026 dollar volume of closed sales


Homes Selling in 46 Days on Average Fastest Since Summer 2025

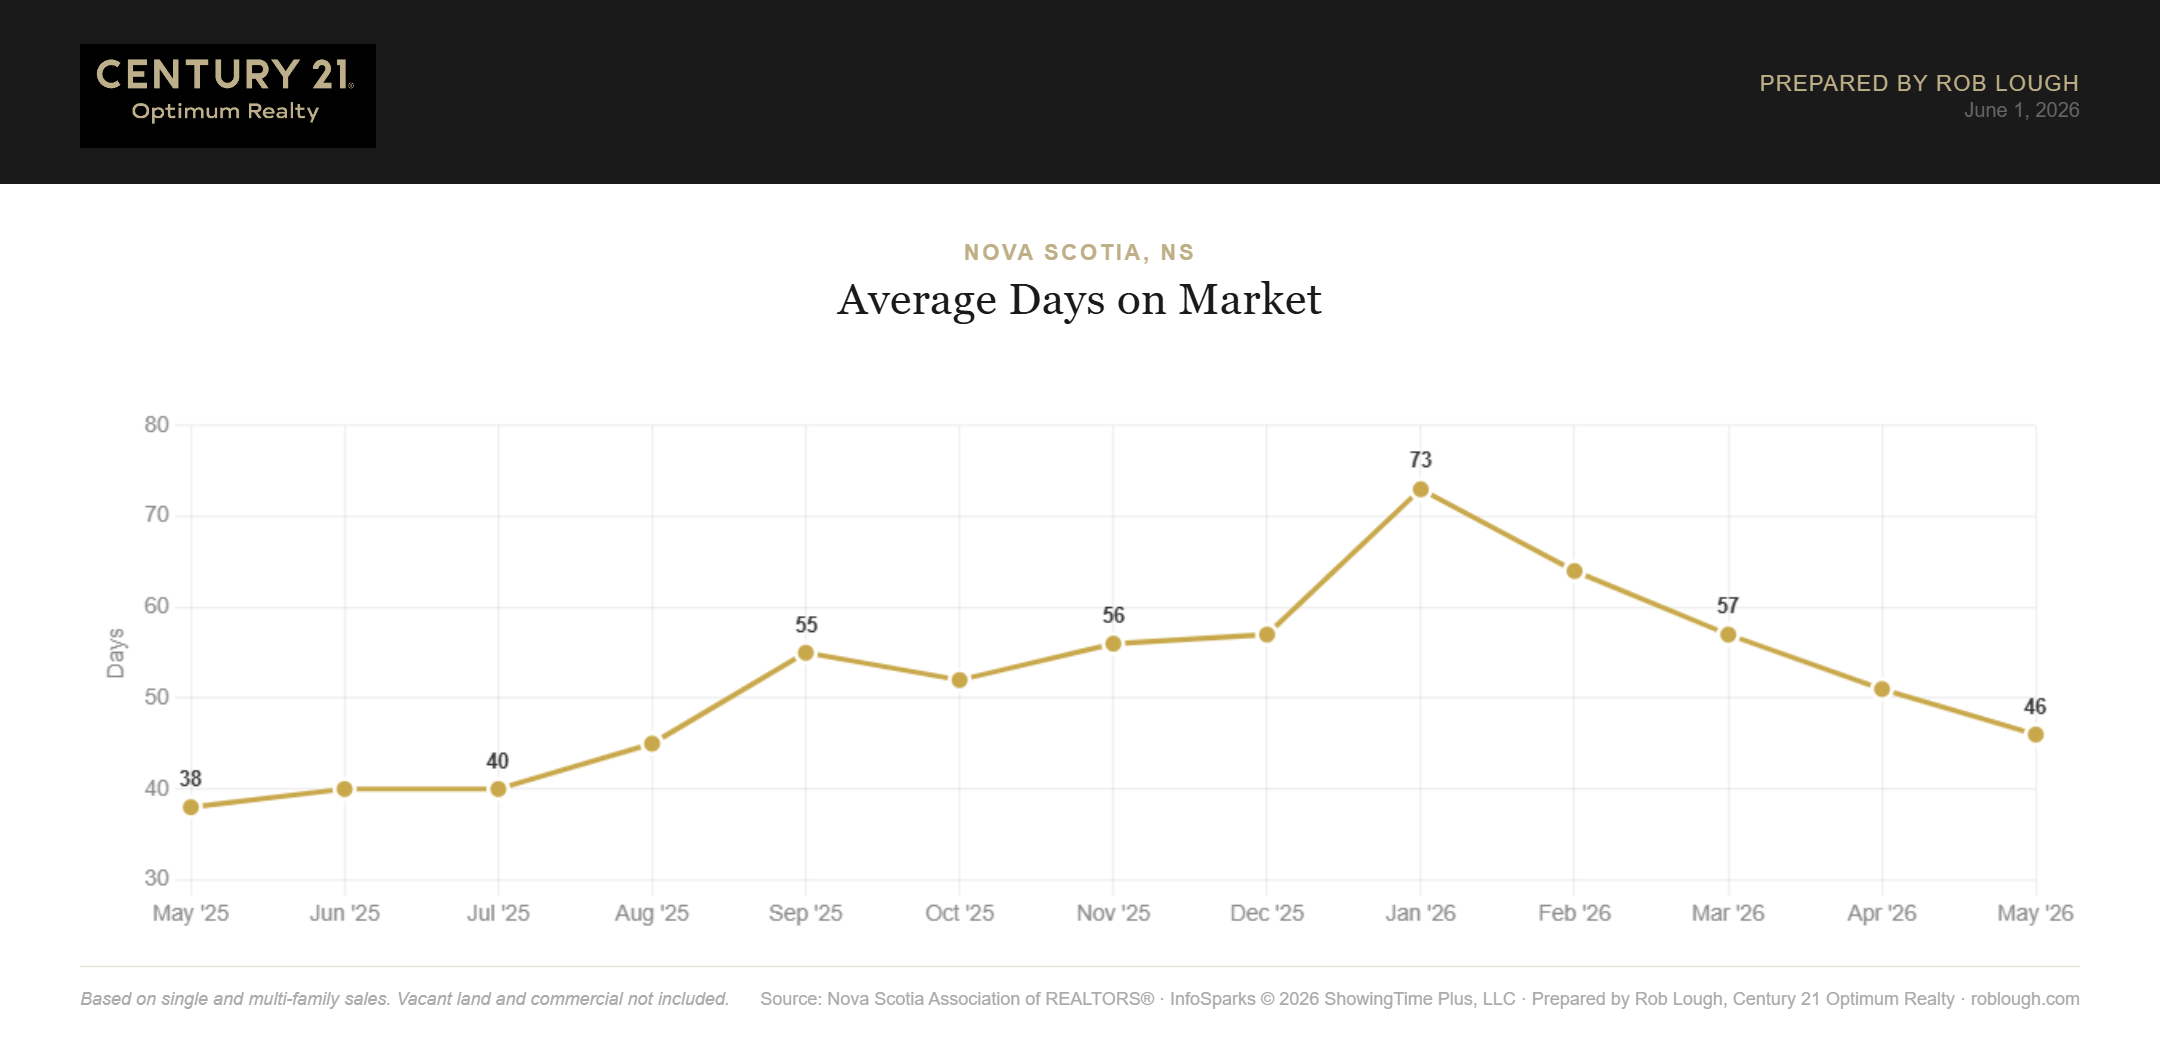
Average days on market dropped to 46 days in May 2026, the lowest reading since July 2025 (40 days) and a sharp improvement from the 73-day peak in January. The trend is clear: well-priced homes are moving.

Nova Scotia Real Estate Market Statistics May 2026 average days on market

Nova Scotia Real Estate Market Statistics May 2026 average days on market

If your home has been sitting on the market, or if you’re thinking about listing this summer, our agents at Century 21 Optimum Realty can review your pricing strategy and marketing approach to make sure you’re positioned to sell efficiently.


Sale Price Ratios: Sellers Still Getting Close to Asking

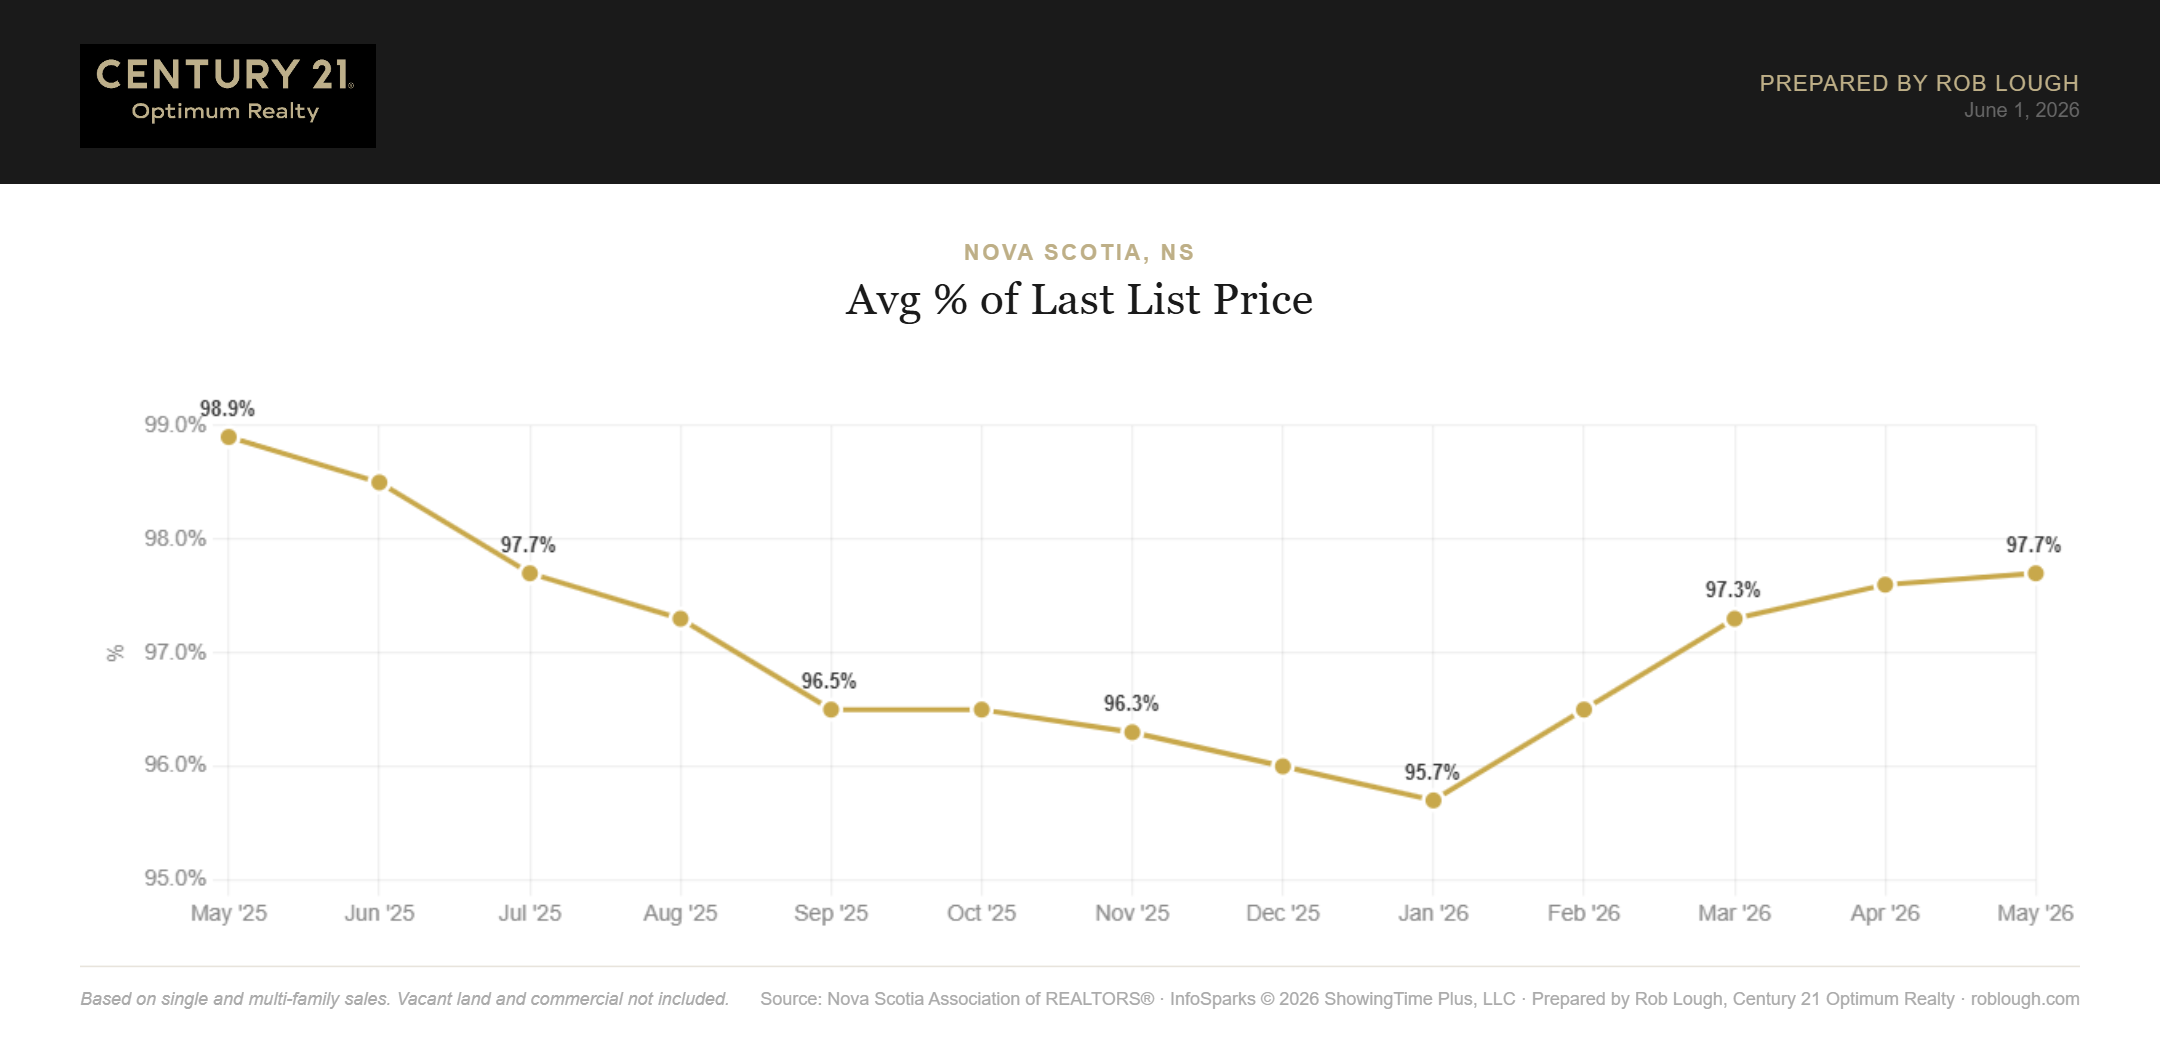
The average sale-to-list price ratio (last list price) held at 97.7% in May 2026, a recovery from the January trough of 95.7% and matching the July 2025 level. Compared to the near-peak conditions of May 2025 (98.9%), buyers are gaining a small but meaningful edge.

Nova Scotia Real Estate Market Statistics May 2026 average % of last list price

Nova Scotia Real Estate Market Statistics May 2026 average % of last list price

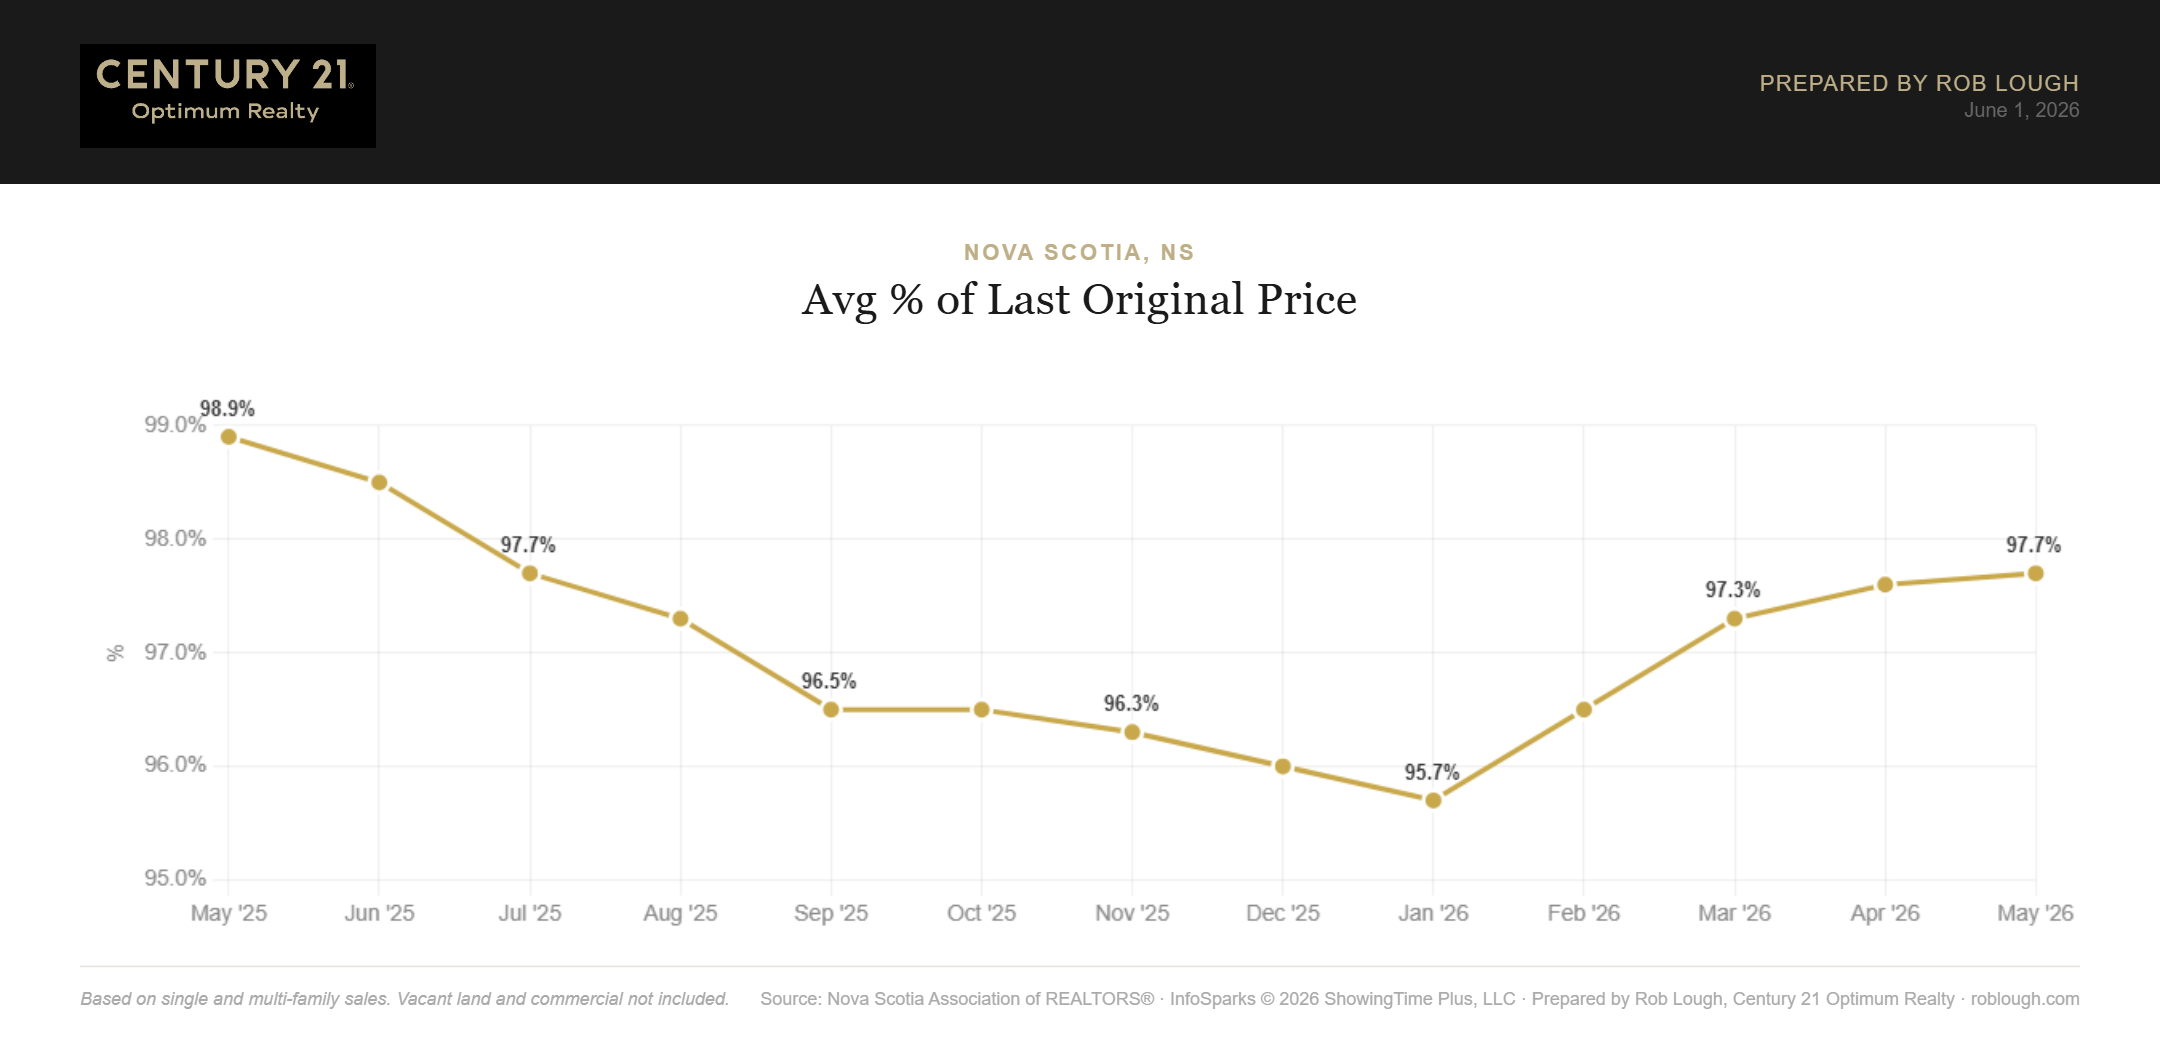
The average sale-to-original-list-price ratio also came in at 97.7%,ย identical to the last-list-price figure, which suggests fewer price reductions are occurring before sale. Sellers who price correctly the first time are still achieving strong results.

Nova Scotia Real Estate Market Statistics May 2026 average % of last original list price

Nova Scotia Real Estate Market Statistics May 2026 average % of last original list price


Showing Activity Points to Active, Engaged Buyers

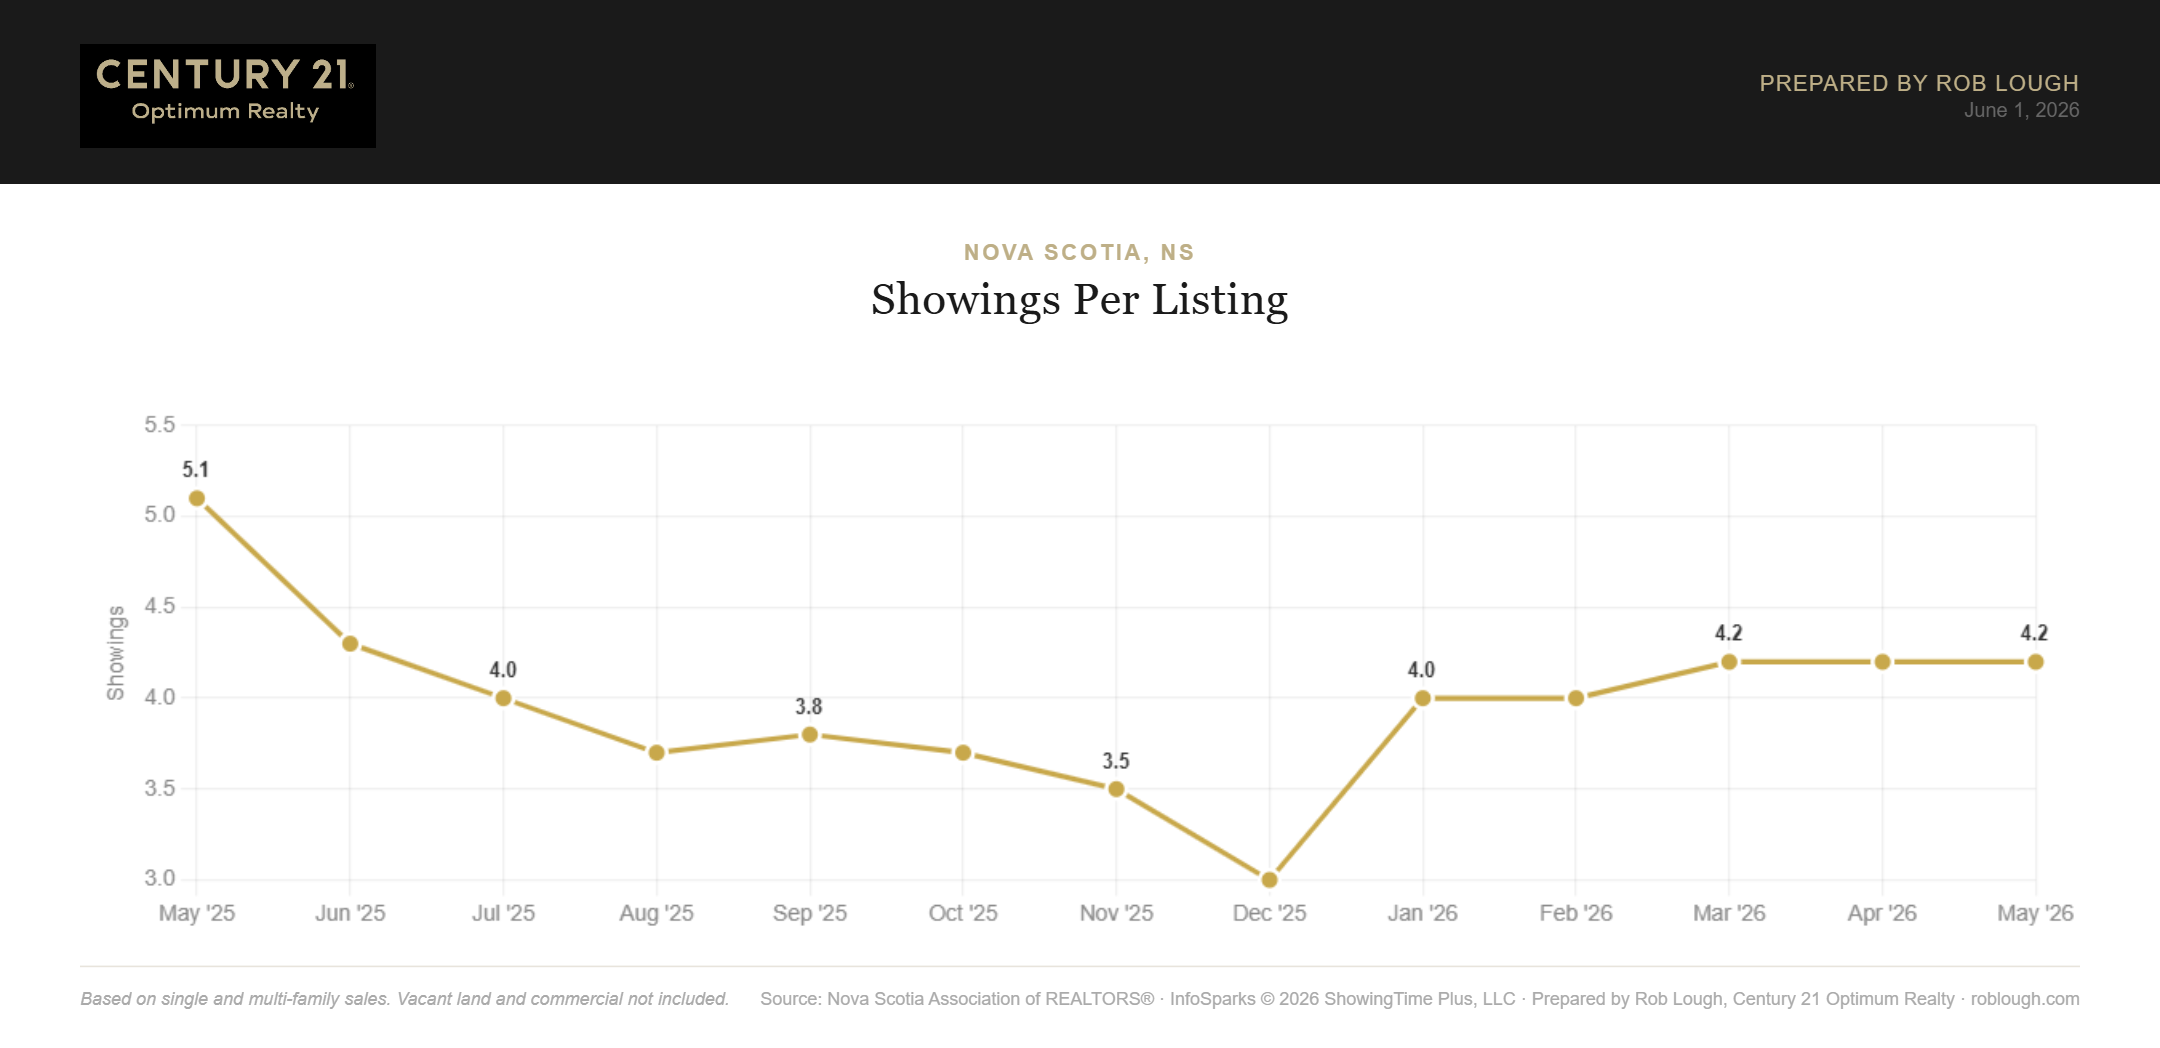
Showings per listing settled at 4.2 in May 2026, consistent with April and well above the December 2025 low of 3.0. While not at the frenzy level of May 2025 (5.1 showings per listing), buyer engagement is healthy and stable.

Nova Scotia Real Estate Market Statistics May 2026 number of showings per listing

Nova Scotia Real Estate Market Statistics May 2026 number of showings per listing

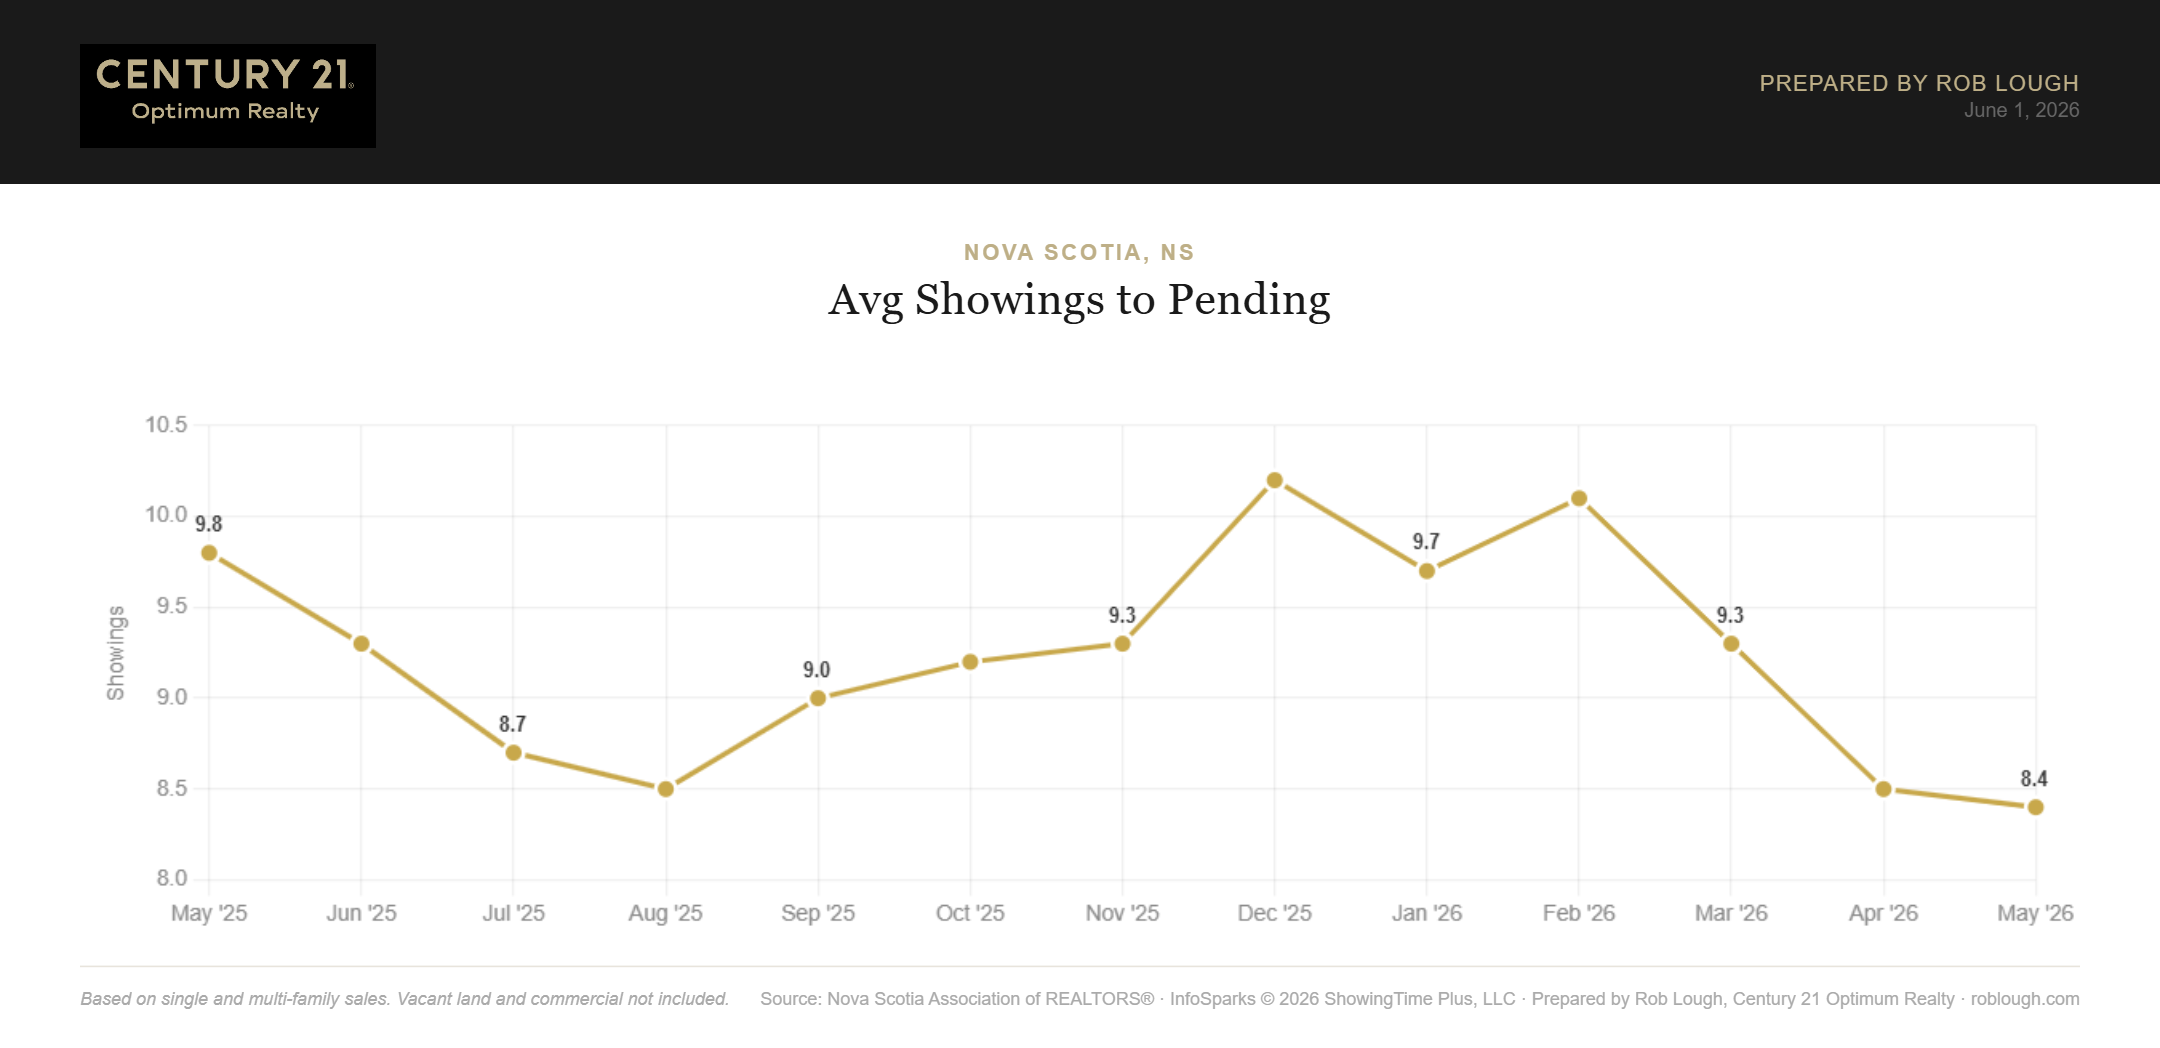
Average showings to pending came in at 8.4 in May, the lowest in the trailing 12-month window and down meaningfully from the December/February highs near 10.1. Fewer showings required to go pending is a positive signal for sellers: buyers who show up are more likely to make an offer.

Nova Scotia Real Estate Market Statistics May 2026 number of showings to pending

Nova Scotia Real Estate Market Statistics May 2026 number of showings to pending


What This Means for Buyers and Sellers

For Buyers: Inventory is the highest it’s been since September 2025, days on market are falling, and sale prices are within about 2.3% of list. This is a better entry point than anything buyers saw last spring or summer. Rate conditions and economic uncertainty remain factors, but the data supports moving if you find the right property. Browse current Nova Scotia listings with our team.

For Sellers: Prices have stabilized close to year-ago levels and the market is moving at a healthy pace. If you priced and positioned correctly, May data shows you should expect reasonable showing activity and offers close to asking. Summer will be telling, if new listings continue to outpace demand, prices could soften. Listing sooner rather than later may be advantageous. Get a free market evaluation from Century 21 Optimum Realty.


About This Report

Data sourced from the Nova Scotia Association of REALTORSยฎ. Based on single and multi-family residential sales. Vacant land and commercial properties are not included. Prepared by Rob Lough, Broker/Owner, Century 21 Optimum Realty, Halifax-Dartmouth, Nova Scotia. Curious about the Halifax/Dartmouth Market Stats for May 2026? Are you a condo owner and want to know about the Halifax Dartmouth Condo Market Report for May 2026?


Related Resources

Uncategorized โ€ข 1 May 2026

Nova Scotia Real Estate Market Stats April 2026

Nova Scotia Real Estate Market Stats April 2026: More Inventory, Longer Days, Prices Holding

By Rob Lough, Broker/Owner, Century 21 Optimum Realty Published May 2026 | Data: Nova Scotia Association of REALTORS


April’s numbers are in, and they continue the story that has been building since the summer of 2025: Nova Scotia’s real estate market is carrying more inventory, taking longer to sell homes, and giving buyers measurably more negotiating room than they had eighteen months ago. Prices, however, are holding, and in some key measures, still climbing.

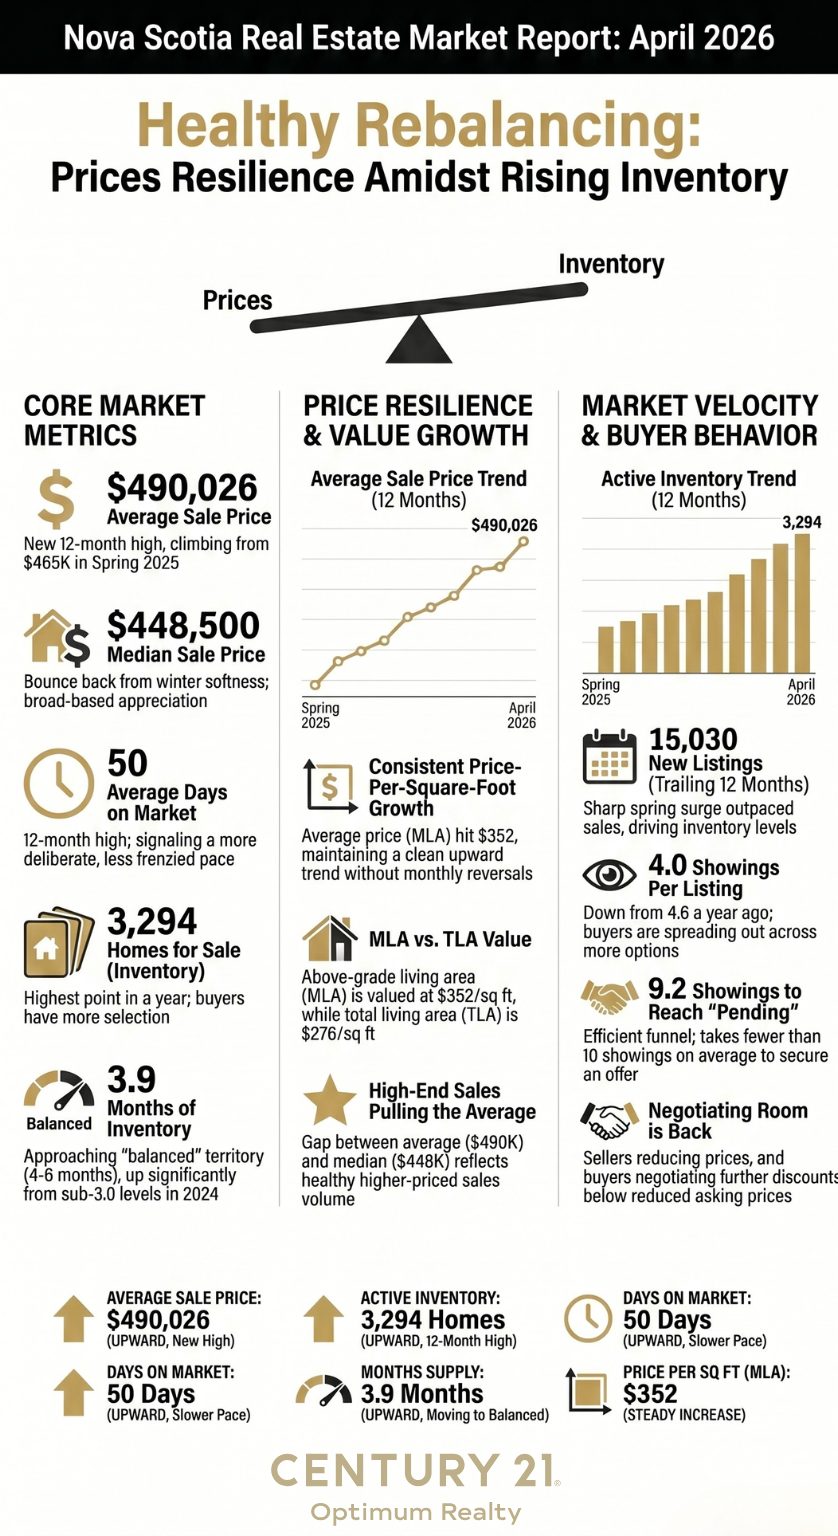
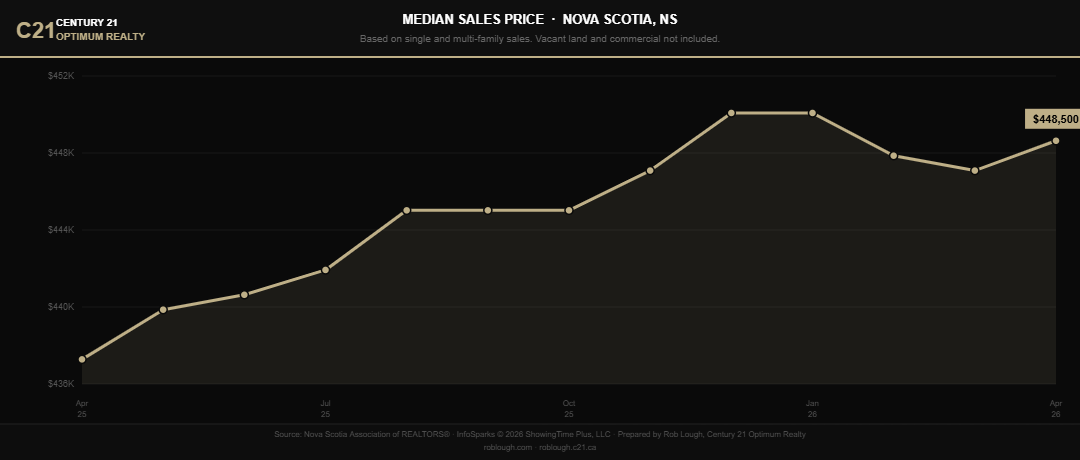
The average sale price across Nova Scotia reached $490,026 in April 2026. The median came in at $448,500. Neither figure signals a market in retreat. What the full dataset shows is a market that has rebalanced after the extraordinary run-up of the pandemic years, and it is behaving the way a healthy market should: more selection for buyers, more discipline required from sellers, and a genuine window of opportunity for patient investors.

This is our most comprehensive monthly report to date, covering 15 data metrics from the Nova Scotia Association of REALTORS. Here is what each one is telling us. A note on trailing 12-month data: Several of the metrics below are presented as trailing 12-month figures. This means the number reflects the cumulative or rolling total of the most recent 12 months ending in April 2026, rather than April alone. Trailing 12-month data smooths out seasonal swings and gives a more reliable picture of underlying market direction than any single month can. When you see a trailing figure rising or falling, it reflects a genuine trend, not a one-month blip. Point-in-time metrics like average price, days on market, and price per square foot reflect current conditions only and are labeled accordingly.

For context behind these trends, our Nova Scotia Real Estate Market Stats March 2026 and Spring 2026 Nova Scotia Real Estate overview cover the ground leading into this month.


Average Sales Price: $490,026

Nova Scotia Market Stats April 2026 Average Sales Price

Nova Scotia Market Stats April 2026 Average Sales Price

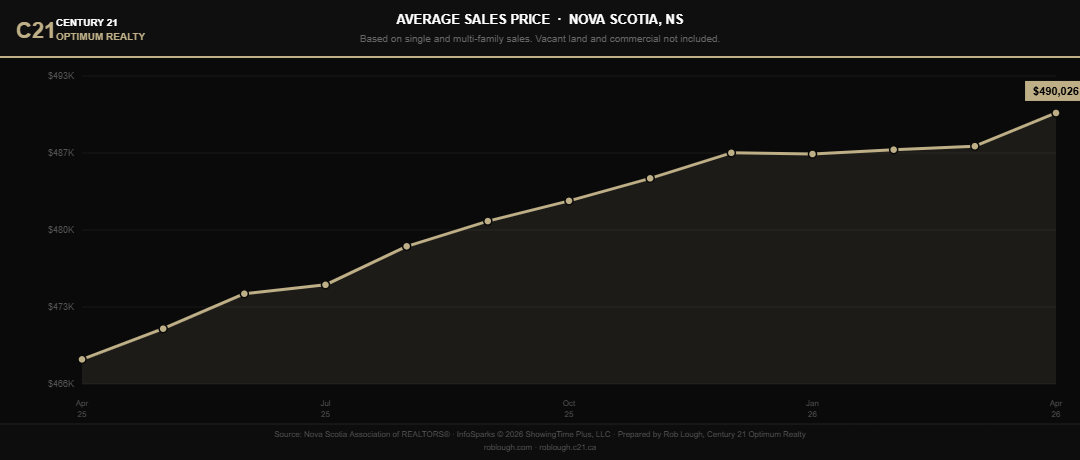
The average sale price hit $490,026 in April 2026, a new high in the trailing 12-month dataset and a meaningful jump from the $486K to $487K range that held through the winter months. The upward trend in average price has been remarkably consistent, climbing from approximately $465K in spring 2025 to today’s reading without any sustained reversal.

It is worth distinguishing average from median here. The average is pulled upward by higher-end sales; the median at $448,500 reflects the midpoint of all transactions. Both figures matter. Together they confirm that price appreciation is not limited to a narrow luxury segment. The market is broadly holding value.

For Buyers: The average price crossing $490K means your borrowing capacity and purchase budget need to be stress-tested against today’s market, not last year’s. Get pre-approved and know exactly what you qualify for before you start seriously shopping. At these price points, the difference between a well-structured offer and a reactive one is real money.

For Sellers: An average sale price approaching $490K is a strong market signal. Your equity position is significant. The discipline required now is not finding buyers willing to pay, it is pricing accurately enough to attract them in a timely way. Sellers who chase the average without supporting comparables are leaving days on market, not dollars, on the table.

For Investors: Average prices near $490K set a high bar for cash-flow acquisition in the traditional residential space. Run your gross rent multiplier and cap rate calculations carefully. The appreciation story, however, remains intact. The consistent upward climb in average price over the trailing year confirms that Nova Scotia residential real estate continues to build value over time.


Median Sales Price: $448,500

Nova Scotia Market Stats April 2026 Median Sales Price

Nova Scotia Market Stats April 2026 Median Sales Price

The median came in at $448,500 for April, bouncing back from the late-winter softness documented in our Nova Scotia Real Estate Market Stats February 2026 report and consistent with the spring recovery we flagged in March. The median peaked around $451K in January 2026 before seasonal compression pulled it down through February, and it has since recovered.

The gap between average ($490K) and median ($448,500) tells its own story. It reflects a healthy spread of property types transacting across the province, with a meaningful volume of higher-priced homes pulling the average above the midpoint.

For Buyers: The median is your most useful reference point when sizing up what the market looks like at the middle of the price distribution. If your budget sits around $448K, you are competing in the heart of the Nova Scotia market, not on the fringe.

For Sellers: If your property falls between the median and average, you are in a well-trafficked part of the market. Buyers exist at your price point. The question is whether your property is positioned to attract them relative to the other options currently available at similar prices.

For Investors: The spread between median and average creates opportunity in both directions. Properties below the median may offer value-add potential in underserved segments. Properties near the average are easier to refinance against if you need to access equity later.


Average Days on Market: 50 Days

Nova Scotia Market Stats April 2026 Average Days on Market

Nova Scotia Market Stats April 2026 Average Days on Market

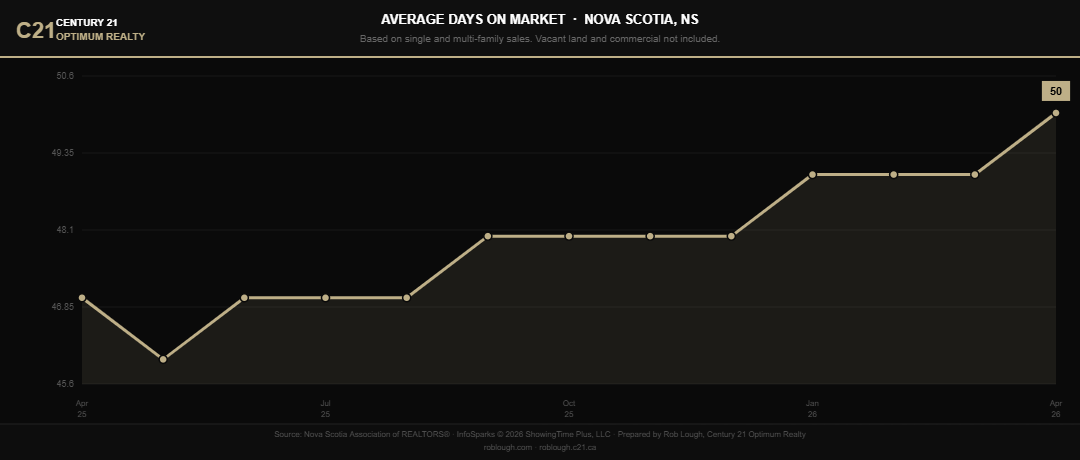
Average days on market reached 50 days in April, the highest point in the trailing 12-month dataset, continuing the steady climb from the summer 2025 low of approximately 45 days. As we outlined in our Nova Scotia Real Estate Market Stats January 2026 report, this trend has been in place for nearly a year.

It is worth keeping perspective. As our Ten Years of Nova Scotia Real Estate in Five Key Charts documents, pre-pandemic days on market routinely ran in the 60 to 90 day range. Fifty days is not alarming by historical standards. What it confirms is that the frenzied 28 to 30 day turnarounds of 2021 and 2022 are well behind us, and sellers who price as though those conditions still exist are finding that out the hard way.

For Buyers: Fifty days on average means you have time to think. You can book a second showing, bring in your home inspector, and review your financing without feeling like the property will be gone tomorrow. Use that breathing room strategically rather than rushing into a decision.

For Sellers: Overpriced listings are sitting longest. If your property has been on the market beyond the 50-day average with few showings and no offers, the market is giving you clear feedback on price or presentation. Acting on that feedback early saves carrying costs and emotional energy. Reductions after 60-plus days generate less momentum than accurate pricing from day one.

For Investors: Longer days on market expand your window to negotiate and conduct thorough due diligence. Income properties that have been sitting are worth a closer look, particularly if the listing agent can speak to showing history and any price adjustment timeline. Patience is an asset in this environment.


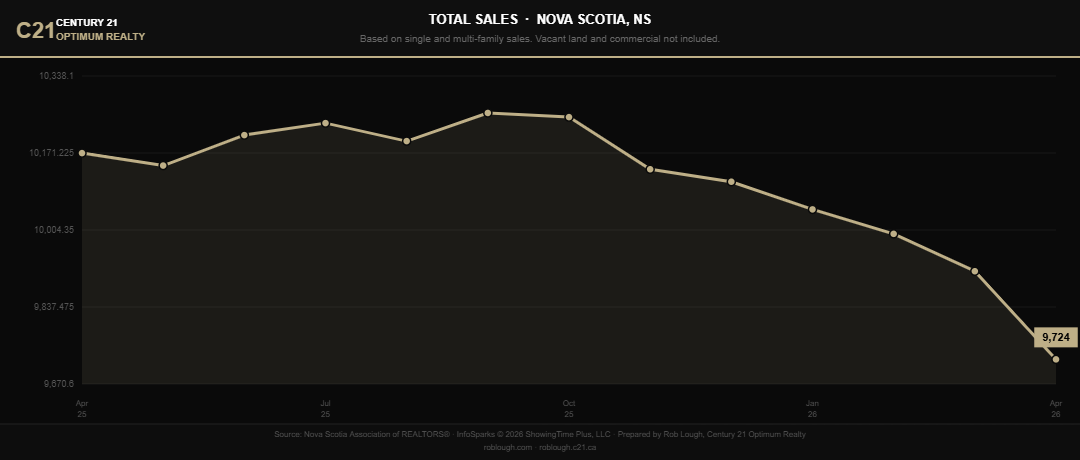
Total Sales: 9,724 (Trailing 12 Months)

Nova Scotia Market Stats April 2026 Total dollar volume

Nova Scotia Market Stats April 2026 Total dollar volume

The trailing 12-month sales count fell to 9,724, continuing a steady decline from the 10,200-plus readings of mid-2025. Transaction volume has been compressing consistently, reflecting both higher carrying costs for move-up buyers and a more cautious buyer pool than we saw during the peak activity period.

This is not a collapse in demand. As the Five Years of Nova Scotia Real Estate Market Analysis shows, sustainable annual volumes for this province sit in the 10,000 to 11,000 range. We are approaching that normalized floor, not falling through it.

For Buyers: Fewer transactions means fewer competing buyers in the room with you on any given property. The bidding war environment that defined 2021 through early 2024 has largely passed. You may still encounter multiple offers on a well-priced, well-presented home, but it is no longer the default condition across the market.

For Sellers: Lower transaction volume means your listing needs to work harder to attract the buyers who are actively in the market. This is not the environment to test pricing above comparable sales and wait for the market to catch up. The buyers transacting right now are informed, deliberate, and comparing carefully.

For Investors: Declining unit volume can sometimes signal a buying window, particularly when prices are stable. Motivated sellers who need to move are more likely to negotiate seriously in a lower-volume market than they were when every listing generated immediate multiple offers.


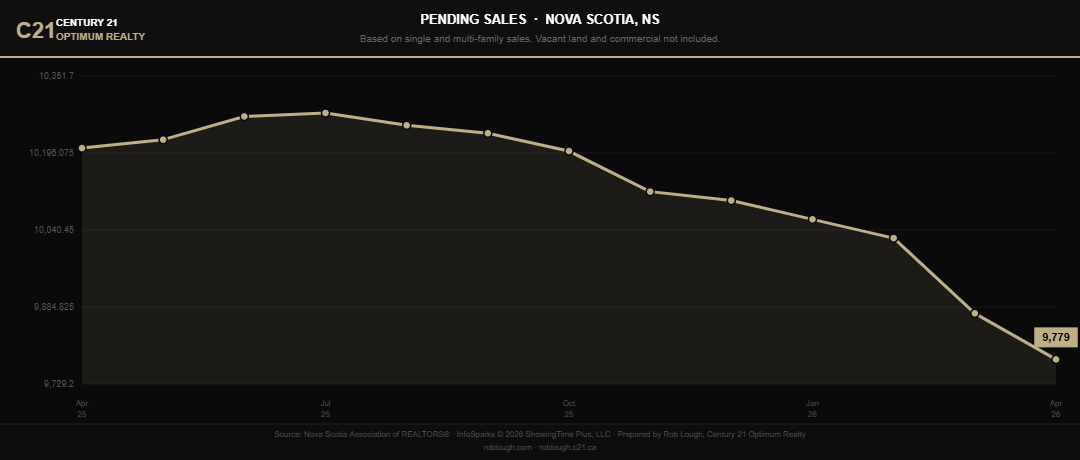
Pending Sales: 9,779 (Trailing 12 Months)

Nova Scotia Market Stats April 2026 number of pending sales

Nova Scotia Market Stats April 2026 number of pending sales

Pending sales came in at 9,779 on a trailing 12-month basis, down from the 10,200-plus readings of summer 2025 and continuing the same compression pattern as total closed sales. Pending sales are a leading indicator: they represent homes that have accepted offers but not yet closed, so today’s pending count previews next month’s closed sales figures.

The fact that pending sales (9,779) are slightly higher than total closed sales (9,724) is actually a modest positive signal. It suggests the pipeline is not thinning further and that the current pace of buyer activity should sustain closed volumes at roughly this level in the near term.

For Buyers: A relatively stable pending count means you are not stepping into a market that is either seizing up or suddenly surging. Conditions are consistent. Offers are being made and accepted. The market is functioning.

For Sellers: The pending count tells you that buyers are writing offers. If your property is not generating offer interest after adequate market exposure, the feedback is specific to your listing, not a sign that the market has stopped moving.

For Investors: Pending sales tracking close to closed sales volume is a liquidity indicator. Properties that are well-priced and in good condition are still finding buyers. Your exit strategy on any acquisition remains viable in this environment.


New Listings: 15,030 (Trailing 12 Months)

Nova Scotia Market Stats April 2026 number of new listings

Nova Scotia Market Stats April 2026 number of new listings

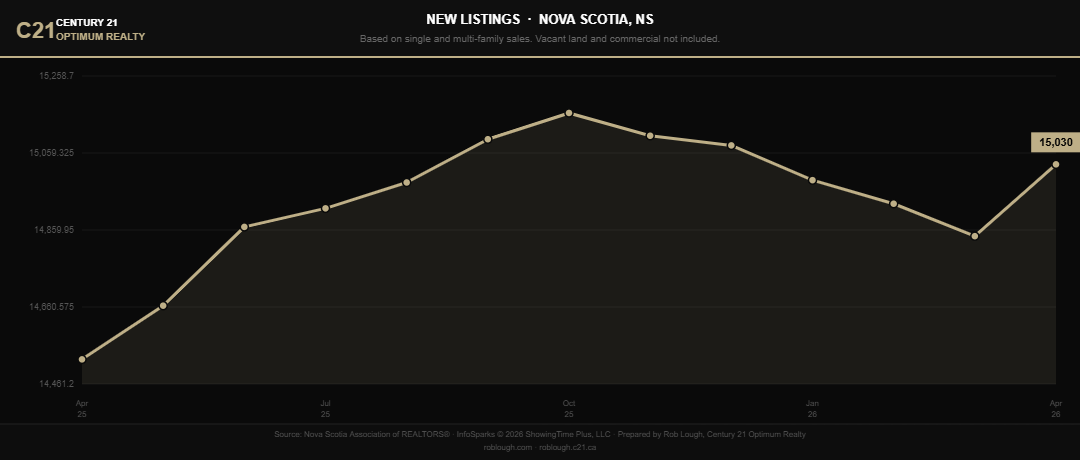
New listings rebounded sharply in April to a trailing 12-month total of 15,030, the highest reading since the October 2025 peak. That spring surge in seller activity is exactly what we would expect at this time of year, and it is bringing meaningful new product to market just as buyer foot traffic picks up.

The math here is important. With 15,030 new listings entering the market and only 9,724 closed sales, the province is generating significantly more inventory than it is absorbing. That gap is the structural reason supply is building and months supply is rising.

For Buyers: The spring listing surge is working in your favour. More inventory means more selection, more comparison opportunities, and more room to walk away from a property that does not meet your criteria and find another one. For more on what buyer motivation looks like right now provincially, see The Homeownership Dream Is Still Alive in Nova Scotia.

For Sellers: You are listing into a market with more competition than existed a year ago. Your property needs to stand out. Professional photography, a clean and decluttered presentation, and accurate pricing are not optional extras in April 2026. They are the baseline for generating showings.

For Investors: Rising new listings create short-term buying opportunities, particularly for properties that come to market overpriced and then reduce within 30 to 45 days. Setting up saved searches and acting quickly on price-adjusted listings that meet your criteria is a practical strategy right now.


Homes for Sale (Inventory): 3,294

Nova Scotia Market Stats April 2026 number of homes for sale

Nova Scotia Market Stats April 2026 number of homes for sale

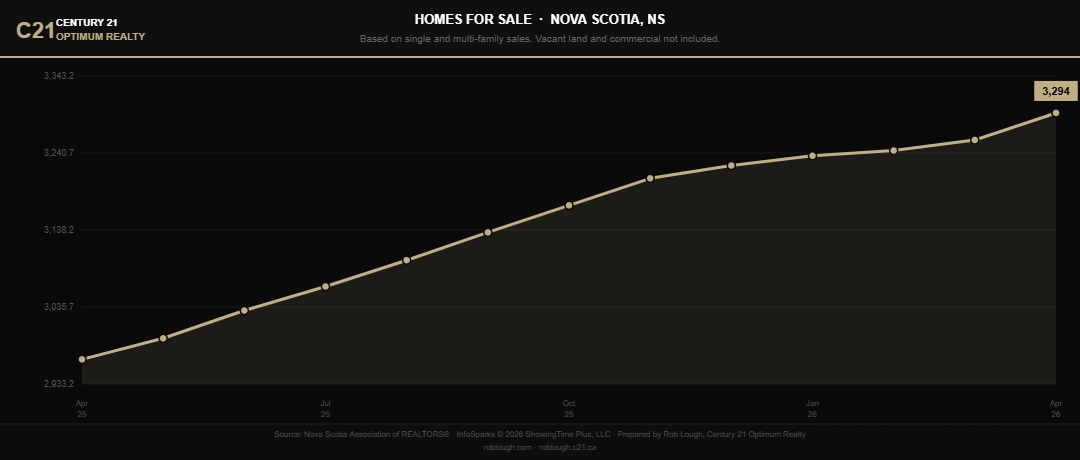
Active inventory reached 3,294 homes, the highest point in the full trailing year and a consistent upward climb from the 2,960-ish levels of spring 2025. More homes on the market is a structural shift that buyers have been waiting on for years. This is still not a traditional buyers’ market, but it is meaningfully more balanced than anything seen during the pandemic period.

For Buyers: More inventory means more choices and less desperation. You can be selective. If a home has a feature that concerns you or a price that feels stretched, there is another listing worth considering. That was simply not true in 2022.

For Sellers: You are no longer the only house on the block. Buyers browsing listings today have real alternatives. Anything that makes your home less competitive, whether deferred maintenance, dated presentation, or an aspirational price, will push buyers toward the next property on their list.

For Investors: Higher inventory levels historically correlate with better acquisition conditions for patient buyers. Set your criteria and let the market come to you. With 3,294 active listings to monitor, the opportunity cost of waiting for the right deal is low.


Months Supply of Homes for Sale: 3.9 Months

Nova Scotia Market Stats April 2026 months of inventory supply

Nova Scotia Market Stats April 2026 months of inventory supply

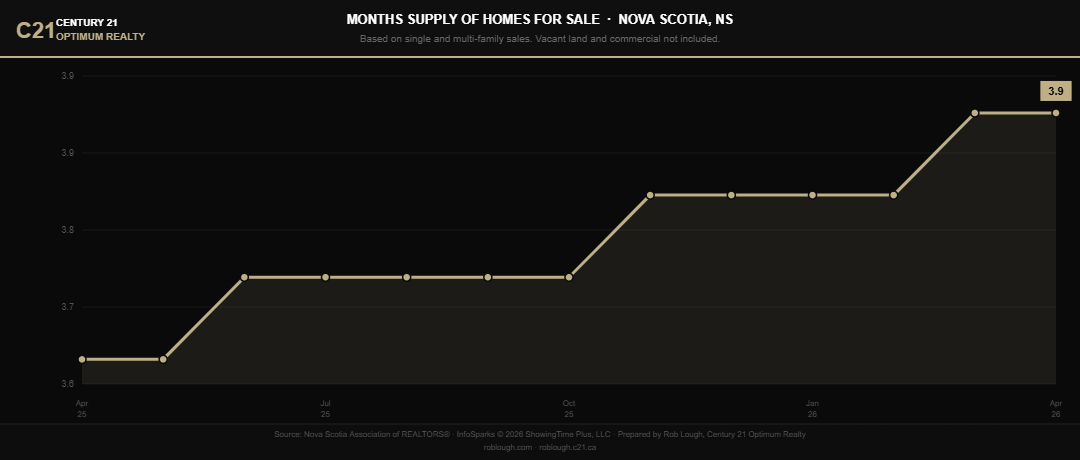
Months supply came in at 3.9, up significantly from the 3.6 readings of earlier this year and dramatically above the sub-3.0 levels that defined the frenzied market of 2023 and 2024. The standard threshold for a balanced market is 4 to 6 months. Nova Scotia is knocking on that door.

For Buyers: At 3.9 months, you are operating in a near-balanced market. You have leverage you did not have eighteen months ago, without being in a situation where sellers are desperate. Negotiate with confidence on price and conditions, but do not assume every seller will capitulate. Well-priced homes are still attracting serious interest.

For Sellers: You are not in a buyers’ market yet, but the trend line is moving in that direction. Sellers who price accurately and list while spring momentum is at its peak will be better positioned than those who wait until fall when months supply typically climbs further.

For Investors: Months supply approaching the balanced threshold is often where experienced investors become more active. There is enough inventory to be selective, enough motivated sellers to negotiate, and enough price stability to underwrite acquisitions with reasonable confidence in exit values.


Dollar Volume of Closed Sales: $4.76 Billion (Trailing 12 Months)

Nova Scotia Market Stats April 2026 total dollar volume of closed sales

Nova Scotia Market Stats April 2026 total dollar volume of closed sales

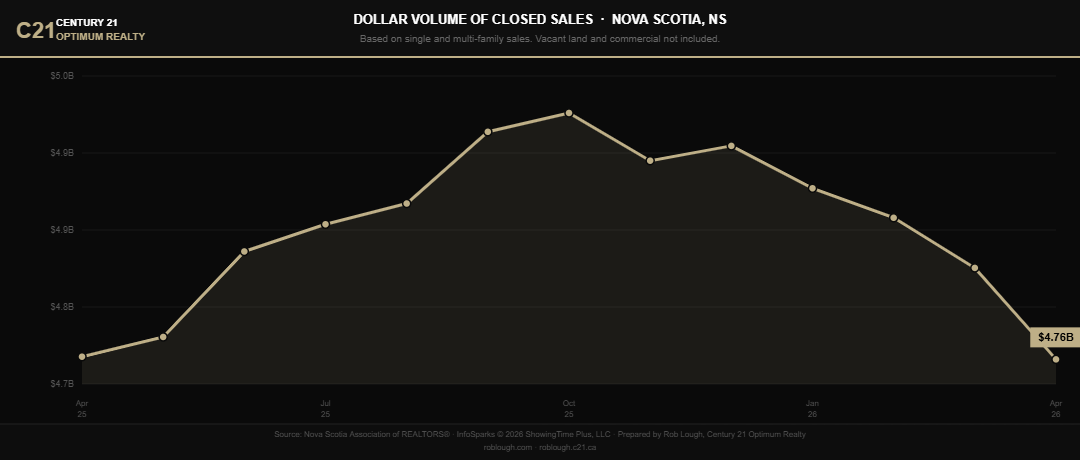
The trailing 12-month dollar volume of closed sales came in at $4.76 billion, down from the $4.9 billion readings recorded near the peak in late 2025. This compression reflects fewer transactions rather than lower prices, a distinction worth understanding clearly. Dollar volume is the product of units sold multiplied by average price. With prices holding and even rising while unit counts decline, the softness in total volume is entirely a function of transaction pace.

For Buyers: Stable prices alongside lower dollar volume means the market is not in freefall, but it also means you should not expect a significant price correction to bail you out if you overpay. Buy what you can genuinely afford at today’s prices.

For Sellers: The $4.76 billion trailing volume confirms that substantial real estate activity is still transacting in Nova Scotia. Buyers with real purchasing power are in the market. The issue is not a lack of buyers; it is a more selective and patient buyer pool that requires the right property at the right price.

For Investors: Total dollar volume at this scale confirms market liquidity. Exit strategies remain viable. If you are buying now with a 3 to 5 year horizon, the Nova Scotia Real Estate Market Statistics 2025: Year in Review documents how this market has sustained and grown value through multiple rate and supply cycles.


Avg Price Per Sq Ft (MLA): $352

Nova Scotia Market Stats April 2026 average cost per square foot MLA

Nova Scotia Market Stats April 2026 average cost per square foot MLA

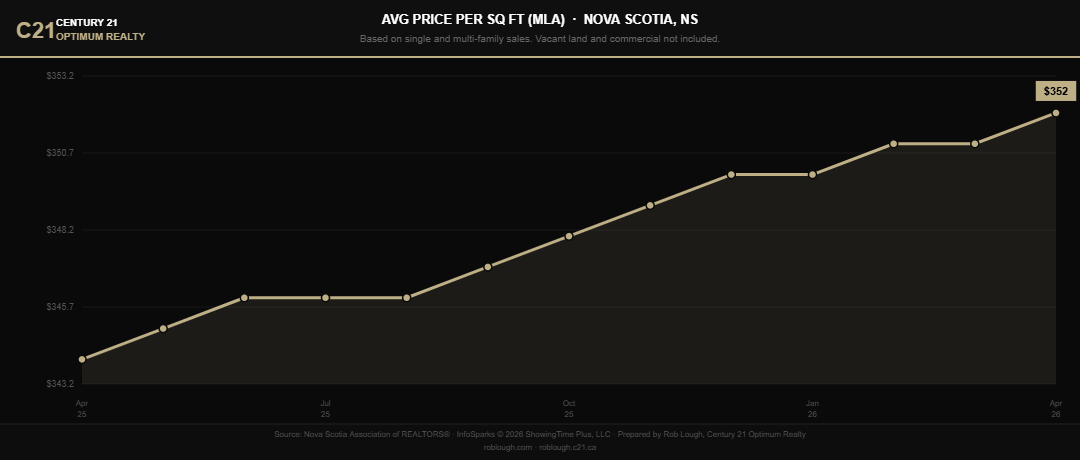
The average price per square foot based on main living area (MLA) reached $352 in April 2026, continuing a remarkably consistent upward trend that has moved from approximately $343 in spring 2025 to today’s reading without a single monthly reversal. This is one of the cleanest uptrend lines in the entire dataset.

MLA-based pricing strips out finished basement space and provides the most straightforward comparison of above-grade living area value across property types. The consistent rise here tells you that buyers are paying more per usable square foot even as other demand indicators soften. The per-square-foot story at the provincial level mirrors what our Condo vs. House in Halifax-Dartmouth: A Decade of Data analysis found at the local level: per-square-foot values in Nova Scotia have been remarkably durable.

For Buyers: At $352 per sq ft on MLA, you have a benchmark to evaluate any property you are considering. Listings pricing significantly above this figure need to justify the premium with location, condition, or features. Listings below this figure in good condition may represent relative value worth acting on.

For Sellers: Rising price per square foot is good news for your net proceeds calculation. If you have invested in finished space, updated kitchens, or improved living areas, the market is rewarding square footage at a higher rate than it was a year ago. Make sure your listing highlights the quality and livability of your above-grade space.

For Investors: A consistently rising price per square foot is one of the more reliable indicators of underlying value growth in a market. At $352/sqft MLA, you can underwrite renovation and addition costs against a metric that has shown no signs of softening.


Avg Price Per Sq Ft (TLA): $276

Nova Scotia Market Stats April 2026 average cost per square foot TLA

Nova Scotia Market Stats April 2026 average cost per square foot TLA

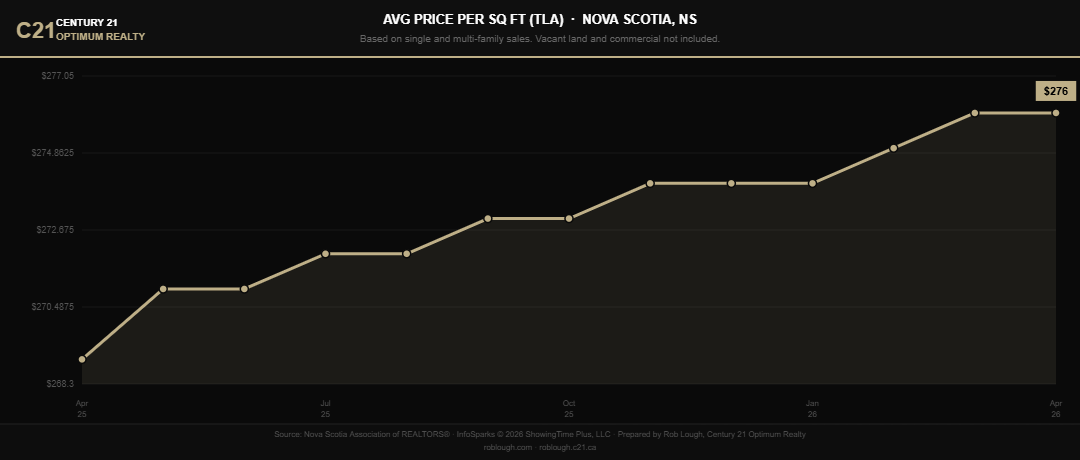
The average price per square foot based on total living area (TLA), which includes finished basement space, came in at $276 in April 2026. Like the MLA figure, this has trended consistently upward from approximately $268 a year ago, rising steadily through every month of the trailing dataset.

The gap between MLA ($352) and TLA ($276) per square foot reflects the discount the market applies to below-grade finished space relative to above-grade living area. That differential is consistent with what buyers experience in practice: finished basements add value, but not dollar-for-dollar with main floor space.

For Buyers: The TLA figure is relevant when comparing properties where one home has significant finished basement space and another does not. A house with 1,500 sq ft MLA and 800 sq ft finished basement is not the same value proposition as one with 2,300 sq ft entirely above grade, even if the total square footage looks similar.

For Sellers: If your home has a fully finished lower level, make sure your agent is presenting that square footage accurately in the listing and that buyers understand the value it adds. The $276 TLA figure gives you a starting point, but location, finish quality, and natural light all influence how buyers price finished lower levels.

For Investors: For properties where you are considering a basement development or conversion project, the spread between TLA ($276) and MLA ($352) per square foot tells you the approximate value uplift you can expect per square foot of new above-grade-equivalent finished space. Run those numbers carefully against your renovation costs.


Showings Per Listing: 4.0

Nova Scotia Market Stats April 2026 average number of showings per listing

Nova Scotia Market Stats April 2026 average number of showings per listing

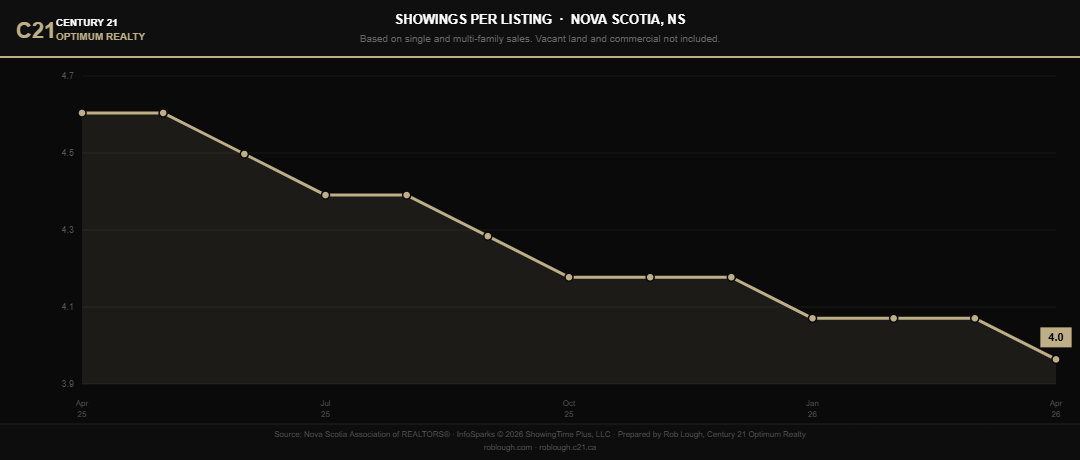
Showings per listing dropped to 4.0 in April, extending a downward trend in place since the spring 2025 highs above 4.6. Fewer showings per property is a direct function of more inventory competing for the same pool of active buyers.

For Buyers: Four showings per listing on average means competition at individual properties has softened meaningfully. You are less likely to arrive at a showing and learn that three other offers came in overnight. Take the time to see a property properly before committing.

For Sellers: Every showing counts more than it did a year ago. Your home needs to convert interest into offers at a higher rate when showing traffic is lighter. Homes that show well are still generating offers. Homes that do not are accumulating days on market instead.

For Investors: Fewer showings per listing can indicate which properties are generating genuine market interest versus which ones are sitting. A listing with minimal showing activity after 30 days is typically telling you something about price or condition that deserves your analytical attention before making an offer.


Average Showings to Pending: 9.2

Nova Scotia Market Stats April 2026 average number of showings per listing to pending

Nova Scotia Market Stats April 2026 average number of showings per listing to pending

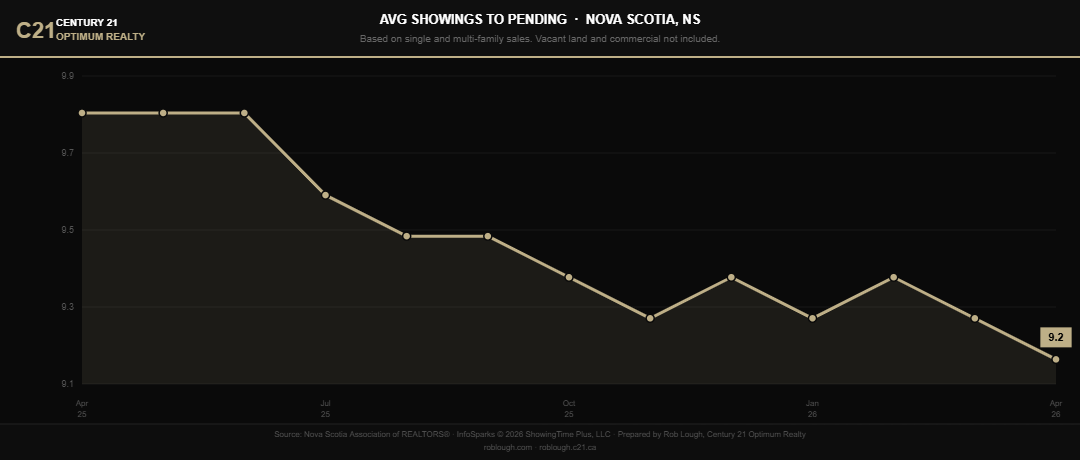
It now takes an average of 9.2 showings before a property goes pending, down from near-9.8 levels of spring 2025. That downward trend is actually a modest positive signal: homes that do attract buyers are converting to pending status somewhat more efficiently than they were a year ago. The funnel from showing to offer has tightened even as overall showing volume per listing has declined.

For Buyers: A 9.2 showings-to-pending average means there is a real buyer pool out there working through the inventory. If you are on showing number four or five at a property you love, you are not alone in the market. Move with intention when you find the right home.

For Sellers: Fewer showings are needed to generate an offer than earlier in the cycle. If you are getting quality showings from motivated buyers, your conversion rate is improving. Focus your energy on attracting the right showings through accurate pricing and strong marketing rather than simply maximizing foot traffic.

For Investors: The showings-to-pending ratio is one of the cleaner signals of true buyer demand. At 9.2, demand is present and real. A well-priced income property in a desirable area is still finding its buyer within a reasonable timeframe.


Avg % of Last List Price and Avg % of Last Original Price

Nova Scotia Market Stats April 2026 average sale to last list price

Nova Scotia Market Stats April 2026 average sale to last list price

Nova Scotia Market Stats April 2026 average sale to original list price

Nova Scotia Market Stats April 2026 average sale to original list price

These two metrics together tell the most important story for anyone actively negotiating right now. Both continued their steady downward drift through April.

The Avg % of Last List Price reflects how close buyers are coming to the most recent asking price, after any reductions. The Avg % of Last Original Price reflects how far the final sale sits from where the seller started. When both figures decline simultaneously, it tells you two things: sellers are reducing before selling, and even after reducing, buyers are still negotiating further below that reduced price.

As noted in our March 2026 report, at current ratios a buyer on a $450,000 to $500,000 home is typically landing $15,000 to $20,000 below the original asking price. The gap between where sellers start and where they close has widened meaningfully over the past year.

For Buyers: You have negotiating room that simply did not exist in 2021 or 2022. Use it. A well-structured offer that comes in below list with reasonable conditions is no longer considered unusual in most segments of the market. Work with your agent to understand what comparable sales support and offer accordingly. The data is on your side.

For Sellers: The two-chart combination here is your clearest warning. Overpricing your home at the outset does not result in a higher sale price. It results in a price reduction followed by a further negotiated discount, leaving you with less than accurate initial pricing would have delivered. Price right the first time and protect your net proceeds.

For Investors: Softening sold-to-ask ratios are your signal that acquisition costs are negotiable. The gap between original list price and final sale is your first layer of value creation on any acquisition. Budget your offer based on realistic comparable sales, not on what sellers are asking.


What This Means Heading Into May

The April 2026 data across all 15 metrics paints a coherent and consistent picture.

Prices are holding and the average is setting new highs. Price per square foot is rising steadily. At the same time, total sales, pending sales, showings per listing, and sold-to-ask ratios are all softening. Inventory is up. Days on market are at their longest point in the trailing year. Months supply is approaching the balanced threshold.

This is not a market in distress. It is a market that has rebalanced after an unprecedented run, and it is operating the way a healthy market should. Buyers have more selection, more time, and more negotiating power than at any point since before the pandemic surge. Sellers who approach pricing and presentation with discipline are still closing successfully at strong prices. Investors who are patient and analytical have more opportunity to acquire on favorable terms than they have had in years.

If you are thinking about buying, selling, or investing in Halifax-Dartmouth, East Hants, or District 104 this spring, reach out. The conditions are workable on all sides of the transaction. It just requires more strategy and preparation than it did two years ago.

For the full context behind these trends, our Nova Scotia Real Estate Market Statistics 2025: Year in Review and Five Years of Nova Scotia Real Estate Market Analysis remain essential reading.


Data source: Nova Scotia Association of REALTORS Based on single and multi-family residential sales. Vacant land and commercial not included. Prepared by Rob Lough, Broker/Owner, Century 21 Optimum Realty.ย 


Related Resources

Uncategorized โ€ข 30 April 2026

The Homeownership Dream Is Still Alive in Nova Scotia

The Homeownership Dream Is Still Alive in Nova Scotia. The Math Is What’s Broken.

By Rob Lough, Broker/Owner | Century 21 Optimum Realty | Halifax-Dartmouth, Nova Scotia Published: April 2026


Here’s something that doesn’t get said enough in conversations about Nova Scotia’s housing crisis: most people still want to own a home. They haven’t given up. They haven’t decided renting is fine. They haven’t moved on.

What they’ve done is run the numbers and the numbers don’t work.

New research from the Nova Scotia Association of REALTORS, conducted by Abacus Data and released this spring, lays out exactly where Nova Scotians stand on housing in 2026. The results paint a picture that is less about despair and more about a province full of people who want something they’re being priced out of reaching.

That distinction matters, because it changes what the solution actually looks like.

Most Nova Scotians Still Want to Own

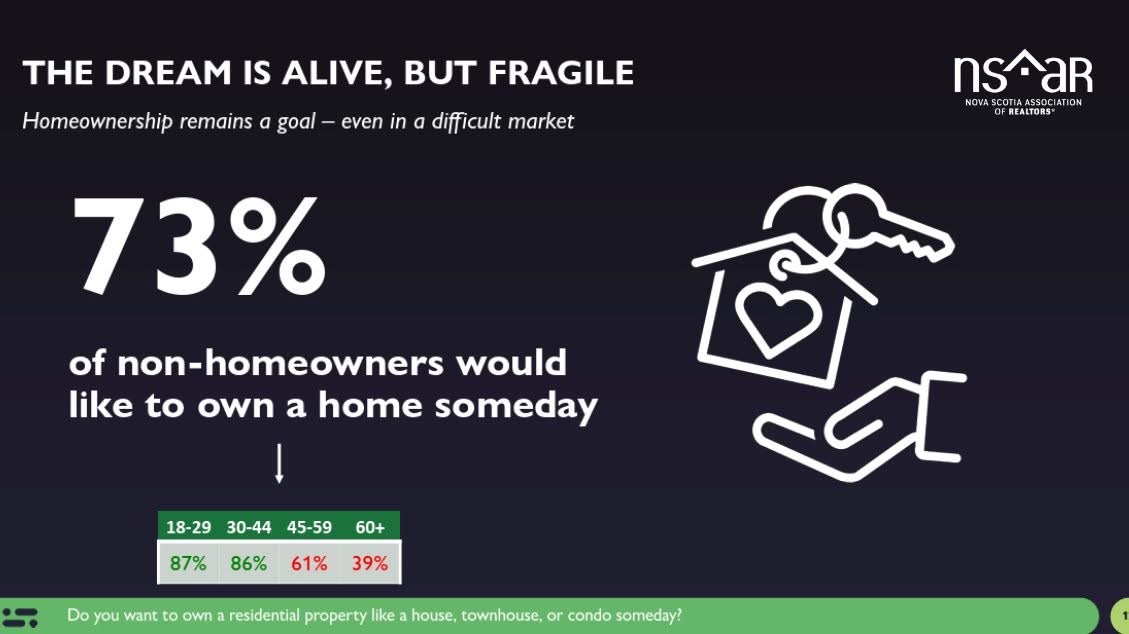
Among Nova Scotians who don't currently own a home, 73% say they want to someday.

Among Nova Scotians who don’t currently own a home, 73% say they want to someday.

Among Nova Scotians who don’t currently own a home, 73% say they want to someday. Among adults under 30, that number is 87%. Among those aged 30 to 44, it’s 86%.

These are not small numbers. They represent the overwhelming majority of renters and non-owners in this province, people actively hoping to cross the threshold into ownership, not people who’ve made peace with staying on the sidelines.

That motivation is real, and it shows up in our offices every week. Buyers who have been watching the market for one, two, sometimes three years. People who are pre-approved but can’t find something at a price that works. First-time buyers who have the income to carry a mortgage but can’t bridge the upfront cash gap.

The aspiration is there. The pathway keeps getting narrower.

The Gap Between Wanting and Getting

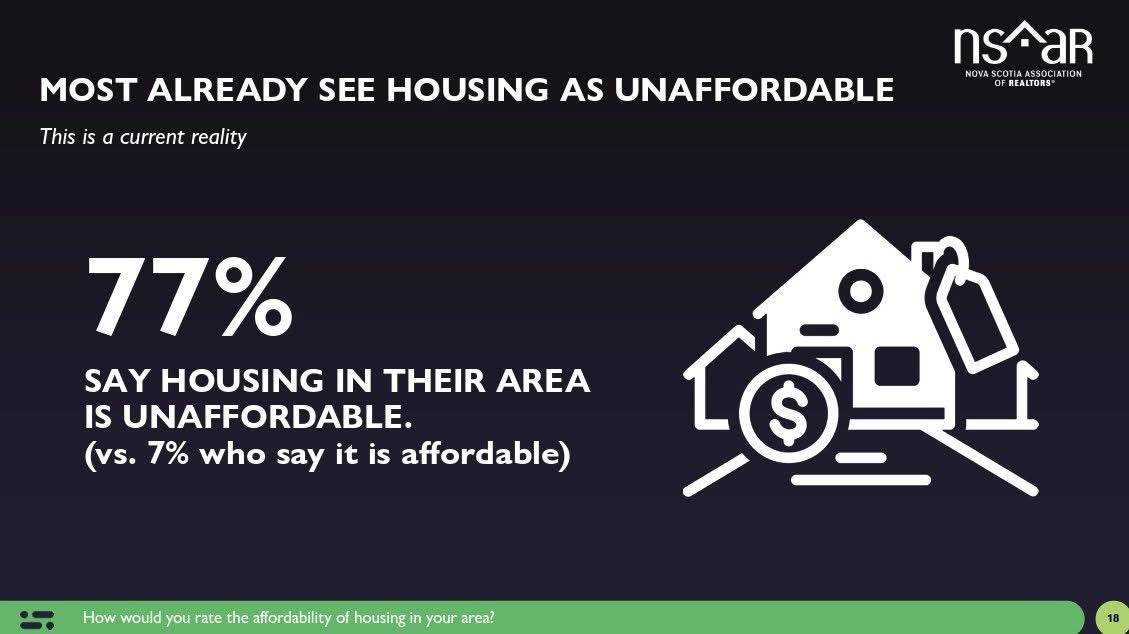
survey asked Nova Scotians to rate housing affordability today, 77% said housing in their area is unaffordable.

survey asked Nova Scotians to rate housing affordability today, 77% said housing in their area is unaffordable.

When the same survey asked Nova Scotians to rate housing affordability today, 77% said housing in their area is unaffordable. Only 7% said it is affordable.

That 70-point spread between the people who want to own and the people who think the market is accessible tells you everything about where the pressure is. It’s not a confidence problem or a desire problem. It’s a price problemย  and behind the price problem is a supply problem and a construction cost problem that the province has been grappling with for years.
Our Nova Scotia Real Estate Market Stats for March 2026 put the provincial average sale price at approximately $463,000, more than 50% higher than it was in early 2021. For a buyer putting down 5% on a $463,000 home, that’s $23,150 in down payment alone, before legal fees, land transfer tax, home inspection, title insurance, and prepaid property taxes are factored in. For many Nova Scotians earning average wages, accumulating that upfront cash while paying today’s rents is the single biggest obstacle between where they are and where they want to be.

What Nova Scotians Actually Want Done

The NSAR/Abacus research didn’t just measure the problem, it asked people what they think would actually fix it. The answers are instructive, and perhaps surprising.
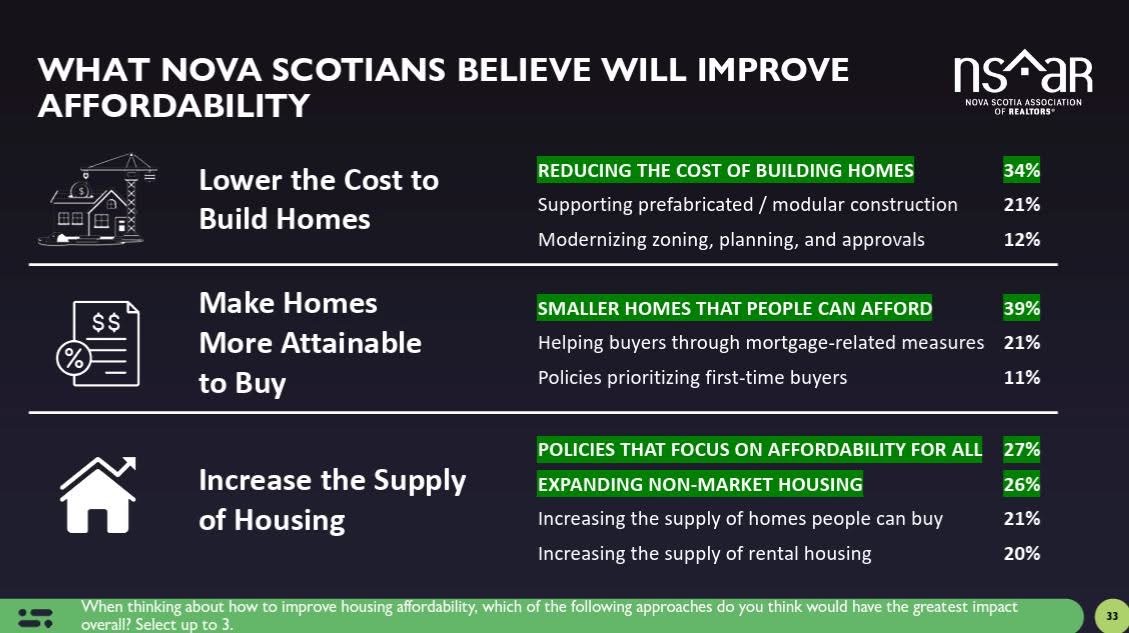
The single most popular response, at 39%, was straightforward: build smaller homes that people can afford. Not a new government program. Not a tax credit. Not a mortgage subsidy. Smaller homes at reachable prices.

That response topped every other option in the survey, across all three solution categories tested. Reducing the cost of construction came in at 34%. Policies focused on affordability for all drew 27%, and expanding non-market housing drew 26%. Mortgage-related measures and first-time buyer policies each drew around 21% and 11% respectively.

Read together, Nova Scotians are telling their government and their industry something clear: the product itself needs to change. The market has been building homes that an increasingly small share of the population can afford to buy. The solution isn’t just more of the same, it’s different product at different price points.

This is consistent with what our 2026โ€“27 Nova Scotia Budget breakdown identified as one of the budget’s key gaps: government investment in supportive housing and homelessness is meaningful, but the missing middle, attainable ownership housing for working Nova Scotians, remains undersupplied.

The Concern Is Universal, But Not Evenly Felt

Eighty-seven percent of Nova Scotians say they are concerned about the state of housing in the province.

Eighty-seven percent of Nova Scotians say they are concerned about the state of housing in the province.

Thirty-six percent say they are very concerned. Those numbers are high enough that they’re essentially describing a consensus, not a political position or a demographic segment, but the broad view of the province.

But concern is not evenly distributed. Among renters, 91% are concerned. Among aspiring homeowners, 95% are concerned. Among adults aged 30 to 44, the cohort most actively trying to buy, 92% are concerned.

These are the people sitting across from us at kitchen tables, trying to figure out whether this spring is the right time to make a move. They are not pessimistic about homeownership in the abstract. They are frustrated by the specific gap between what they can afford and what the market is offering them.

Where the Real Opportunities Are Right Now

The NSAR data is a provincial snapshot, but the opportunities are local and they’re real.

The programs available to first-time buyers in 2026 are genuinely the strongest we’ve seen in years. Nova Scotia’s 2% Down Payment Assistance Program directly addresses the upfront cash barrier that the survey identifies as the core problem, allowing eligible buyers to purchase with just 2% down on homes up to $570,000 in HRM and East Hants. Our detailed guide on stacking federal and provincial programs shows how the Bill C-4 GST rebate, the down payment program, and extended amortizations can work together for buyers of new construction.

For buyers with flexibility on location, the value gap between HRM and central Nova Scotia remains significant. Our Five Years of Nova Scotia Real Estate Market Analysis puts the full price appreciation story in context and makes clear that markets outside HRM have absorbed far less of that 50% run-up than Halifax and Dartmouth have.

For sellers, the survey results are a useful reminder of who your buyer is. Seventy-three percent of non-owners in this province want to own someday. The buyers are there. What they need is product priced within reach of what the market currently qualifies them for, which, in a spring 2026 environment with softened sold-to-ask ratios and longer days on market, means accurate pricing matters more than it has in years. Our Spring 2026 Nova Scotia real estate overview covers exactly where the market sits heading into the busiest months of the year.


The NSAR research doesn’t reveal a province that has given up on homeownership. It reveals a province that wants it badly, sees the path as increasingly difficult, and has a fairly clear idea of what needs to change. For buyers who are still in the game, pre-approved, patient, and prepared, this market has more room to negotiate than it has since before the pandemic surge. The tools are there. The motivation is there. The question is whether the product and the policy will catch up to the demand.

Related Resources

Uncategorized โ€ข 28 April 2026

Condo vs. House in Halifax-Dartmouth: A Decade of Data

Condo vs. House in Halifax-Dartmouth: A Decade of Data
Halifax Condo vs. House: 10-Year Market Comparison (2016โ€“2026) | Rob Lough โ€“ Century 21 Optimum Realty

Halifax-Dartmouth Real Estate  ยท  10-Year Market Analysis

Condo vs. House in Halifax-Dartmouth:
A Decade of Data

Average sale prices, units sold, and price per square foot โ€” single-family homes vs. condo apartments, 2016 through early 2026.

If you've been watching the Halifax-Dartmouth real estate market over the past decade, you know it has been anything but predictable. But the full story only comes into focus when you place two property types side by side, the single-family home and the condo apartment, and trace their paths across ten years of verified NSAR data.

This article does exactly that. Using sales data from the Nova Scotia Association of REALTORSยฎ (NSAR) via InfoSparks, I've pulled annual averages for sale prices, total units sold, and price per square foot for both property types from 2016 through early 2026. The resulting picture is one of a market where condos and single-family homes started the decade close in price, diverged dramatically through the pandemic boom, and are now settling into a new equilibrium that every buyer and seller in HRM needs to understand. For where the market stands right now, the Halifax-Dartmouth Real Estate Market Stats: April 2026 and the Halifax-Dartmouth Condo Market Report: April 2026 provide the most current read on both segments.

For the provincial backdrop to this Halifax-specific story, the Ten Years of Nova Scotia Real Estate in Five Key Charts article on optimumrealty.c21.ca provides essential context. And for the five-year arc of price appreciation that reshaped affordability across the region, see the Five Years of Nova Scotia Real Estate Market Analysis (2021โ€“2025). This article drills into what those broader trends looked like specifically for Halifax-Dartmouth and specifically for the condo vs. house comparison.

Average Sale Price: Condo vs. Single-Family Home (Annual Average, 2016โ€“2025)

The chart below plots annual average sale prices for both property types across ten full years. Annual averaging smooths out month-to-month volatility and gives a cleaner read on where the two segments have actually been and how far they've diverged.

Average Annual Sale Price โ€” Halifax-Dartmouth Area Source: NSAR / InfoSparks ยฉ 2026 ShowingTime Plus, LLC.
Single-Family Home
Condo Apartment

In 2016, the average single-family home in Halifax-Dartmouth sold for approximately $303,000. The average condo that year came in around $263,000 โ€” a gap of roughly $40,000, or about 13%. Condos were the more accessible entry point, as expected.

Both property types drifted modestly upward through 2017, 2018, and 2019 โ€” annual appreciation in the 2โ€“4% range, consistent with Halifax's historically stable pre-pandemic pace. Then 2020 changed everything.

Single-family homes accelerated sharply. By 2021, the average house had crossed $488,000. By 2022, the annual average peaked near $555,000. Condos rose too, but more modestly in absolute terms โ€” reaching the low $450,000s at their 2022 annual average. The gap between the two property types, once measured in tens of thousands, had grown to over $100,000.

The 2023 and 2024 data show continued strength for single-family, with condos plateauing in the $480,000โ€“$490,000 range before some softening. In early 2026, single-family transactions in Halifax-Dartmouth are routinely closing in the $620,000โ€“$660,000 range. Condos are running $465,000โ€“$535,000 depending on the month, with spring 2026 showing renewed strength โ€” as detailed in the Halifax Condo Market Report for March 2026.

~+$330K Avg. house price gain
2016 to 2025
~+$219K Avg. condo price gain
2016 to 2025
~109% Approx. house price
appreciation, decade
๐Ÿ“Š Buyer Takeaway โ€” Average Sale Price

The price gap between a Halifax-Dartmouth condo and a single-family home has grown from roughly $40,000 in 2016 to over $130,000โ€“$150,000 today. For buyers working with a fixed pre-approval, that gap is the difference between being in the market and being on the sidelines. Condos are not a consolation prize โ€” they're a legitimate entry point into Halifax homeownership, and the data shows they've delivered real appreciation over the decade.

๐Ÿก Seller Takeaway โ€” Average Sale Price

Single-family sellers in 2026 are operating at price levels that would have been unimaginable in 2016. With averages near $630,000โ€“$660,000, the market is far off its 2021โ€“2022 rate-fueled urgency, but prices have held at levels that still represent extraordinary equity growth for anyone who purchased before 2020. Precise pricing matters now more than ever. For current context, see the Halifax-Dartmouth market stats for March 2026.

Total Units Sold Per Year: Condo vs. Single-Family Home (2016โ€“2025)

Price tells one story. Volume tells another. The chart below tracks how many single-family homes and condo apartments actually changed hands each year โ€” a measure of market depth, buyer demand, and available inventory across Halifax-Dartmouth.

Total Annual Units Sold โ€” Halifax-Dartmouth Area Source: NSAR / InfoSparks ยฉ 2026 ShowingTime Plus, LLC.
Single-Family Home
Condo Apartment

Single-family sales volume peaked dramatically in 2020 and remained elevated through 2021. In those two years, Halifax-Dartmouth recorded its highest single-family transaction counts in this dataset โ€” a reflection of pent-up pandemic demand, historically low interest rates, and an unprecedented wave of out-of-province buyers choosing Nova Scotia.

Condo volume tells a different story. Annual condo sales climbed from roughly 560 in 2016 to their own peak near 1,075 units in 2021 โ€” nearly doubling over five years. While still a fraction of single-family transaction totals, the condo segment grew meaningfully as a share of overall market activity, driven by affordability pressures and an increasingly urban Halifax core attracting younger buyers and downsizers alike.

By 2022 and 2023, rising interest rates cut single-family volumes significantly relative to peak. The Nova Scotia Real Estate Market Statistics 2025 year-end report captures how the province navigated that volume contraction while prices held far more firmly than transaction counts did. Condo volumes contracted too, but held up proportionally โ€” a sign the segment continues to attract buyers motivated by lifestyle and accessibility rather than pure market timing.

For early 2026, monthly data through March shows spring momentum building for both property types, consistent with the seasonal patterns documented in the Nova Scotia March 2026 market stats and the Halifax condo report for February 2026.

๐Ÿ“Š Buyer Takeaway โ€” Sales Volume

Lower transaction volumes mean less competition compared to the 2020โ€“2021 frenzy. If you've been waiting on the sidelines expecting a return to bidding-war conditions, the volume data says the market has normalized โ€” not crashed. Spring typically brings a meaningful lift in Halifax activity, and 2026 is showing that seasonal ramp beginning now. Getting pre-approved and prepared before the peak spring competition window is the highest-leverage move a buyer can make.

๐Ÿก Seller Takeaway โ€” Sales Volume

The volume data confirms the pool of active buyers is smaller than it was in 2020โ€“2021 โ€” but buyers are still transacting. Spring and summer remain the clear seasonal peaks. Sellers who time their listing for March through June, price with precision, and invest in professional presentation continue to close successfully. The buyers are out there. Reaching them requires strategy, not just signage.

Average Price Per Square Foot: Condo vs. Single-Family Home (Annual Average, 2016โ€“2025)

Price per square foot strips out the size variable and gives the cleanest apples-to-apples comparison between property types. A condo is typically much smaller than a house โ€” so comparing total sale prices alone doesn't tell you which type actually costs more per unit of space. The results here are illuminating, and frankly counterintuitive to many buyers.

Average Annual Price Per Square Foot (MLA) โ€” Halifax-Dartmouth Area Source: NSAR / InfoSparks ยฉ 2026 ShowingTime Plus, LLC.
Single-Family Home
Condo Apartment

In 2016, single-family homes averaged around $198 per square foot across Halifax-Dartmouth. Condos averaged approximately $236 per square foot โ€” a premium of nearly $38 per foot for the smaller, more urban product. You paid more per square foot for a condo than for a house, not less.

That per-square-foot premium held throughout 2017, 2018, and 2019. During the pandemic boom, single-family prices surged on a per-square-foot basis โ€” reaching annual averages near $386/sqft for houses by 2022. Condos kept pace throughout, averaging closer to $427/sqft in 2022 on an annual basis. The condo premium, measured in dollars per square foot, was remarkably persistent across the entire cycle.

Through 2023 and 2024, single-family per-square-foot values settled in the $398โ€“$415 range. Condos have shown more month-to-month volatility โ€” a function of smaller sample sizes and variability of individual unit sizes and locations โ€” but averaged in the $463โ€“$477 range. The per-square-foot condo premium, present since at least 2016, remains intact into 2026.

This aligns with what the Ten Years of Nova Scotia Real Estate analysis shows for the broader province: the structural dynamics of location, walkability, amenity access, and reduced maintenance responsibility have consistently commanded a premium on a per-square-foot basis for Halifax condo product. The Halifax-Dartmouth market stats for March 2026 peg the combined market average at $419/sqft โ€” with condos typically running above that mark and single-family homes largely below it.

~$434 House avg. $/sqft
March 2026
~$447 Condo avg. $/sqft
March 2026
10+ Yrs Condo $/sqft premium
has held consistently
๐Ÿ“Š Buyer Takeaway โ€” Price Per Square Foot

If you're buying a condo because you think it's cheaper per square foot than a house, that assumption may cost you. Halifax condos have commanded a premium on a per-square-foot basis for the entire decade tracked here. What you're paying for is location, lifestyle, and lower maintenance โ€” not a discount on space. That can be excellent value, but go in with clear eyes about what you're actually buying.

๐Ÿก Seller Takeaway โ€” Price Per Square Foot

Condo sellers have structural pricing leverage on a per-square-foot basis that single-family sellers don't enjoy to the same degree. The persistent premium is tied to location and product type, not just market heat. Well-maintained, well-located Halifax condos continue to command strong per-square-foot values. Pricing within the $430โ€“$480 range with strong presentation still produces results โ€” pricing above it encounters meaningful buyer resistance in today's market.


What the 10-Year Data Tells Us

Three things stand out when you look at this decade of Halifax-Dartmouth real estate data side by side.

Single-family homes have delivered greater absolute dollar appreciation. A buyer who purchased an average Halifax-Dartmouth single-family home in 2016 around the $303,000 mark and sold in early 2026 near $650,000 has seen their investment more than double in ten years. The absolute dollar gain of over $330,000 is difficult for the condo segment to match, where appreciation has been meaningful but more moderate.

Condos have always commanded a per-square-foot premium โ€” and still do. This is the finding that surprises most buyers. Over the entire decade, condos have cost more per square foot than single-family homes, not less. The premium reflects location concentration on the Halifax peninsula and Dartmouth waterfront, lower ongoing maintenance obligations, and lifestyle factors that urban buyers consistently pay for. That premium has been stable across boom, correction, and normalization.

The absolute price gap between the two types has widened substantially. In 2016, the average Halifax-Dartmouth condo sold for roughly 87 cents on the dollar compared to a single-family home. By 2024โ€“2025, that ratio compressed toward 79โ€“82 cents. The two property types have diverged in absolute dollar terms even as per-square-foot values have stayed relatively close.

For a deeper dive into what drove these dynamics across Nova Scotia as a whole, the Nova Scotia Housing Market 2025: A Comprehensive Analysis and the Five Years of Nova Scotia Real Estate Market Analysis both provide essential context for understanding where Halifax fits within the broader provincial story.

What This Means for Buyers in 2026

If you're a first-time buyer in Halifax-Dartmouth right now, the data makes a compelling case for taking the condo market seriously. With average single-family prices regularly exceeding $620,000 in 2026, and average condo prices in the $465,000โ€“$530,000 range, the entry point difference is now over $130,000. Under Canada's minimum down payment rules, that's a meaningful difference in both the down payment required and the monthly mortgage carrying cost.

The per-square-foot premium on condos is real, but what it buys you is location, walkability, reduced maintenance, and in many cases a newer or significantly renovated build. For buyers who value those things โ€” and for many Halifax buyers they do โ€” the tradeoff is well understood.

For buyers set on single-family and stretching to reach the current price range, the Halifax-Dartmouth January 2026 market stats offered a clear reminder that the market is more patient than it was in 2021. Days on market have extended and sold-to-ask ratios give buyers more room to negotiate than at any point in the past three years. The buyers who move decisively in spring โ€” with pre-approval in hand and the right property โ€” still close successfully.

What This Means for Sellers in 2026

If you're selling a single-family home in Halifax-Dartmouth in 2026, you're operating in a market that has delivered extraordinary equity to anyone who owned through the past decade. The key discipline now is pricing accurately and presenting professionally. The volume data confirms that buyers exist and are transacting โ€” but they are more measured, more patient, and less willing to overpay than they were in 2021 or 2022.

If you're selling a condo, the per-square-foot data gives you a structural argument for your value โ€” but it doesn't override the need for realistic pricing within the current range. The Halifax Condo Market Report for March 2026 shows a market that snapped back strongly in spring, with 55 units sold and the highest total dollar volume in the tracked period. Spring 2026 is not a distressed condo market. It is a market that rewards preparation and penalizes overpricing.

The broader Nova Scotia market context from the February 2026 Nova Scotia market stats and the January 2026 market stats both point toward the same conclusion: values have held, but the market is not forgiving of listings that open too high. Working with an agent who understands current pricing dynamics โ€” and brings 25 years of Halifax-Dartmouth experience to the table โ€” is how sellers in this environment protect their equity.
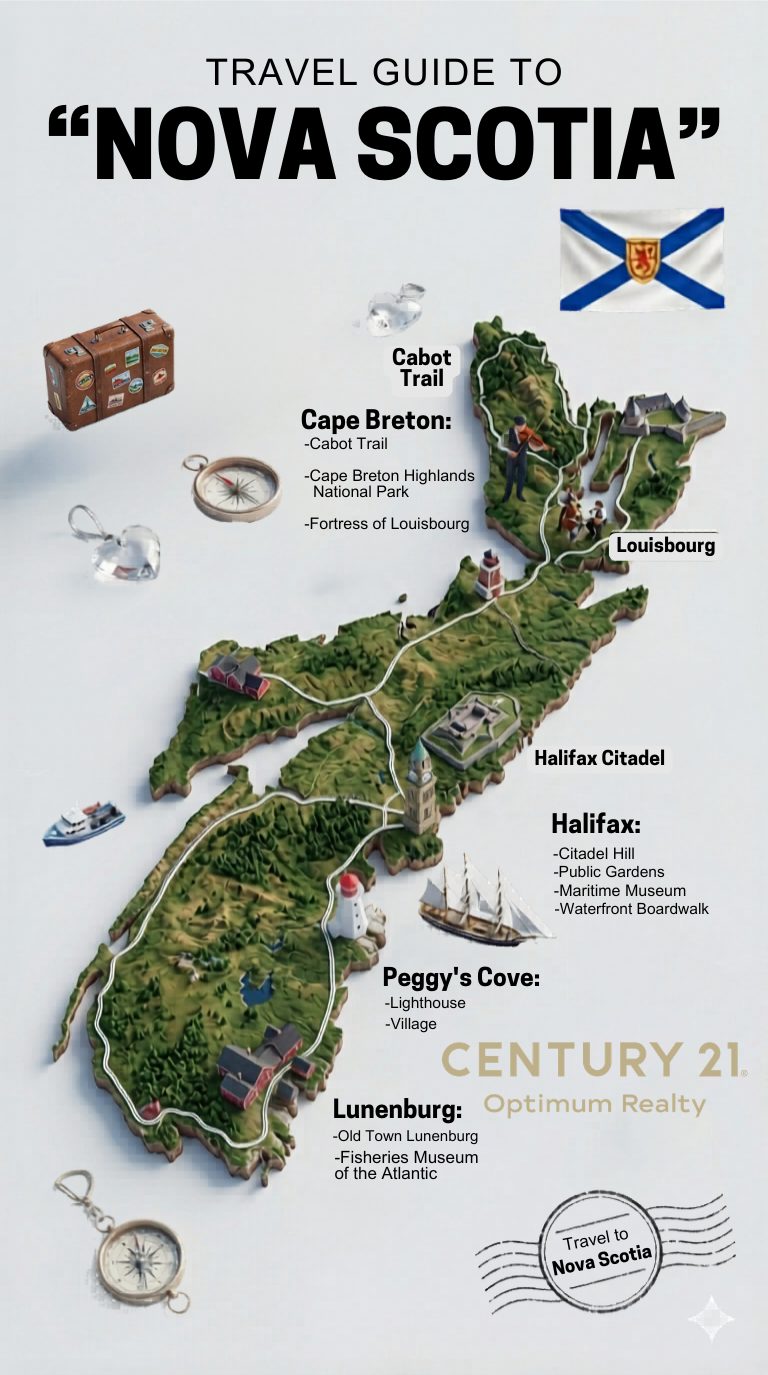
Rob Lough  |  Broker/Owner, Century 21 Optimum Realty  |  Halifax-Dartmouth, Nova Scotia  |  Data: Nova Scotia Association of REALTORSยฎ / InfoSparks ยฉ 2026 ShowingTime Plus, LLC.  |  The trademarks MLSยฎ, REALTORยฎ, and REALTORSยฎ are owned by CREA.
Uncategorized โ€ข 16 April 2026

Travel Guide to Nova Scotia: Canada’s Ocean Playground | C21 Optimum Realty

Travel Guide to Nova Scotia: Canada’s Ocean Playground

By Rob Lough, Broker/Owner | Century 21 Optimum Realty | Halifax-Dartmouth, Nova Scotia


Nova Scotia punches well above its weight. Tucked onto a peninsula on Canada’s Atlantic coast, this province delivers rugged coastlines, UNESCO-designated towns, world-class seafood, and a pace of life that’s hard to find anywhere else in the country. Whether you’re planning a road trip or quietly wondering what it would be like to actually live here, this guide covers the places that make Nova Scotia worth the trip and worth the move.


Halifax: The Heart of the Province

Start in Halifax. The city is compact, walkable, and genuinely fun. Citadel Hill offers a sweeping view of the harbour and a crash course in the city’s military history. The Waterfront Boardwalk stretches along the harbour and connects you to the Maritime Museum of the Atlantic, dozens of restaurants, and the ferry to Dartmouth. The Public Gardens in the South End are among the finest Victorian gardens in North America, free to enter and worth an hour of your time.

Halifax has also become one of Canada’s most talked-about real estate markets. If you’re curious about where prices and activity stand right now, our Spring 2026 Nova Scotia Real Estate Market article breaks it down in plain language.


Cape Breton Island: The Cabot Trail and Beyond

Cape Breton is where Nova Scotia earns its reputation. The Cabot Trail loops around the northern tip of the island through Cape Breton Highlands National Park, cliffs, ocean views, and some of the best fall foliage in the country. Baddeck is a good base. The Fortress of Louisbourg on the eastern shore is one of the most impressive historic reconstructions in North America.

The island also has Celtic roots that run deep. Live music in the pubs, fiddle festivals in the summer, and a warmth from locals that visitors consistently comment on.


Peggy’s Cove and the South Shore

Peggy’s Cove is iconic for a reason, the lighthouse perched on glacial granite with the Atlantic crashing below is as dramatic in person as it looks in photographs. Go early in the morning to avoid the crowds.

From there, the South Shore rewards slow travel. Mahone Bay, Chester, and the Annapolis Valley are all within reach, and the scenery shifts from rocky coastline to pastoral farmland as you move inland.


Lunenburg: A UNESCO World Heritage Town

Old Town Lunenburg is one of only two urban sites in North America to hold UNESCO World Heritage status. The streets are lined with colourful, well-preserved colonial architecture, and the Fisheries Museum of the Atlantic tells the story of the province’s relationship with the sea. This is also the home port of the Bluenose, Canada’s most famous schooner.


Truro and the District 104 Corridor

Truro sits at the geographic centre of Nova Scotia, sometimes called “the hub”, and it’s an underrated destination. Victoria Park has waterfalls, hiking trails, and a public pool, all within walking distance of downtown. The tidal bore on the Salmon River is a natural phenomenon worth timing your visit around.

The Truro and Bible Hill area has also attracted attention from buyers looking for more space and better value than HRM. We cover that market regularly in our Nova Scotia real estate market stats.


When to Visit

June through September is peak season, warm temperatures, festivals, and long days. The Cabot Trail in October during foliage season is spectacular and far less crowded than summer. Winters are mild by Canadian standards, especially compared to central Canada, though you’ll want to pack for Atlantic weather regardless of the season.


Thinking About More Than Just a Visit?

A lot of people come to Nova Scotia to travel and leave thinking seriously about a move. The province has seen sustained population growth over the past several years, driven largely by people arriving from Ontario, BC, and abroad who are trading cost-of-living pressure for quality of life.

If that sounds familiar, it’s worth understanding what the market actually looks like right now. Our Five Years of Nova Scotia Real Estate Market Analysis gives you the full picture, where prices have been, what drove them, and where things stand heading into 2026.

For a longer view, Ten Years of Nova Scotia Real Estate in Five Key Charts puts today’s market in historical context.

And if you’re a first-time buyer or new to the province, our breakdown of how Nova Scotia buyers can stack federal and provincial programs explains the support that’s currently available for new construction purchases.


Ready to take the next step? Whether you’re relocating from across the country or making Nova Scotia your full-time home, the Century 21 Optimum Realty team covers most areas of Nova Scotia. Search current Nova Scotia listings or reach out to find out what your budget gets you here.

Uncategorized โ€ข 24 February 2026

2026โ€“27 Nova Scotia Budget What Every Halifax Homebuyer Renter and Investor Needs to Know

2026โ€“27 Nova Scotia Budget: What Every Halifax Homebuyer, Renter, and Investor Needs to Know

By Rob Lough| Broker/Owner, Century 21 Optimum Realty | February 2026


The Nova Scotia government’s 2026โ€“27 provincial budget dropped a significant investment in housing and whether you’re a first-time buyer, a rental property investor, or a homeowner thinking about adding a secondary suite, there’s something in this budget that directly affects your next move. Here’s a plain-language breakdown of what matters most for buyers and sellers across the Halifax Regional Municipality, East Hants, and beyond.


A Budget Built Around Housing Supply

After years of record demand and tight inventory across Nova Scotia, the province is responding with a supply-side strategy, meaning the focus is on building more units, supporting more renters, and reducing barriers for developers. The overall investment in housing and affordability measures is substantial, and the ripple effects will be felt across the Halifax real estate market for years to come.


$88 Million for Public Housing: What It Means for the Market

The budget commits $88 million toward building, renovating, and maintaining public housing, including the first new public housing builds in over two decades. That includes:

$36.8 million (third year of funding) for 222 new public housing units, plus $10.6 million for an additional 242 units currently in the pipeline. Communities including Lower Sackville, Glace Bay, Kentville, Windsor, and Shannon Park in Dartmouth are among the targeted locations.

For private market participants, this matters because non-market supply absorbs demand from the lowest end of the rental spectrum, which can gradually ease pressure throughout the broader rental market. It won’t happen overnight, but it’s the most direct housing investment Nova Scotia has made in a generation.


The HST Rebate on Purpose-Built Rentals: A Game-Changer for Investors

This is arguably the single most impactful measure in the budget for real estate investors. The provincial HST rebate continues for new purpose-built rental projects that started construction on or after September 14, 2023 and complete by December 31, 2035. The estimated fiscal impact is $54.1 million in 2026โ€“27 alone.

Combined with the federal GST/HST rental rebate announced in 2023, this significantly improves the financial viability of new multi-unit rental development. If you’re an investor or developer evaluating a purpose-built rental project in HRM or elsewhere in Nova Scotia, this is the pro forma improvement that could make a project pencil out. Reach out to our team to discuss how this might apply to properties or land you’re considering.


Backyard and Secondary Suites: $20 Million Over Three Years

The Backyard Suites Incentive Program receives another $6.9 million in this budget, bringing its three-year total to $20 million. This program supports homeowners and small-scale investors who want to add a secondary or garden suite to an existing property.

For homeowners, this can generate rental income that offsets mortgage costs. For investors, it’s an opportunity to increase cash flow on existing single-family holdings, where zoning and municipal permitting allow. If you’re thinking about whether a property you own or are considering buying could support a secondary unit, our team can help you evaluate the opportunity.


Rent Supplements Expanding to 10,500 Active Recipients

The budget ramps up rent supplement funding significantly, moving toward 10,500 active rent supplements, up from the roughly 8,900 currently in place. An additional $10.9 million is earmarked for 1,000 supplements specifically targeting individuals facing gender-based violence.

For landlords, rent supplements mean a portion of your tenant’s rent is backed by government funding, reducing default risk. As this program expands, more tenants across Nova Scotia will be supplement-eligible, which has implications for landlord risk assessment and vacancy rates in affordable rental segments.


First-Time Homebuyers Pilot: 2% Down Through Credit Unions

One of the more eye-catching announcements is the First Time Homebuyers Pilot Program, which allows eligible buyers to purchase a home with as little as a 2% down payment through participating provincial credit unions. Details are still emerging, but for buyers who’ve been sidelined by down payment requirements, this could open a door. New NSAR research shows Nova Scotians are clear on what they want, 39% say smaller, more attainable homes are the top priority, ahead of any government program.

It’s worth noting that a smaller down payment means a larger mortgage, so the qualification math and stress test still matter. If you’re a first-time buyer trying to figure out whether this program works for you, start with a conversation with our team. We’ve been helping Nova Scotians navigate first-time purchases for over 24 years and can help you connect with the right lenders and understand your full range of options.


Student Housing Investment: Easing Campus Rental Pressure

The budget allocates $30.8 million for new student housing at NSCC Cumberland and NSCC Kingstec campuses. For investors who own rental properties near those campuses, this will eventually bring new purpose-built beds online, which could affect vacancy rates in those micro-markets. Monitoring how quickly construction progresses and when units come online will be important for anyone with rental holdings in those areas.


$130 Million for Homelessness and Supportive Housing

The budget’s largest single housing-related investment is $130.5 million for homelessness and housing stability, including $77.9 million for supportive housing, $33.6 million for shelter capacity, and $25.2 million to create 378 new supportive housing units. The Tiny Homes Community in Lower Sackville receives $1.8 million to support up to 70 residents.

This level of investment in the supportive housing continuum gradually moves vulnerable individuals out of informal or private-market housing arrangements and into purpose-built supportive units, which has downstream implications for low-end rental demand.


$34 Million for Skilled Trades: Addressing the Labour Bottleneck

No housing supply discussion is complete without addressing the labour gap. The budget commits $34.3 million to accelerate skilled trades growth, including $5 million for the new Institute of Skilled Trades. This is a long-game investment โ€” training today’s apprentices means more capacity to build tomorrow’s homes. For developers and builders, this signals the province is aware that labour is as much a constraint as land and financing.


The Bottom Line for Nova Scotia Buyers, Sellers, and Investors

This budget sends a clear message: Nova Scotia is committed to growing housing supply across all segments, market, non-market, supportive, and student. For buyers, sellers, and investors active in the Halifax real estate market right now, the key programs to watch are:

The purpose-built rental HST rebate for investors and developers building new multi-unit rental projects. The Backyard Suites Incentive for homeowners and small investors adding secondary units. The First Time Homebuyers Pilot for clients who’ve been saving for a down payment. The rent supplement expansion for landlords with tenants in the affordable segment.

Government investment alone won’t solve Nova Scotia’s housing affordability challenge, but the combination of direct public building, HST relief, and buyer programs represents the most comprehensive package the province has assembled in years.


Thinking About Your Next Move?

Whether you’re a first-time buyer exploring new programs, an investor evaluating a rental development opportunity, or a homeowner wondering whether a backyard suite makes sense for your property, our team at Century 21 Optimum Realty is here to help. With 24 years of experience in Nova Scotia real estate, we know this market โ€” and we know how to help you make the most of it.

๐Ÿ“ž Contact us today to talk through what this budget means for your real estate goals.