
 Facebook
 X
X
 Pinterest
 Copy Link
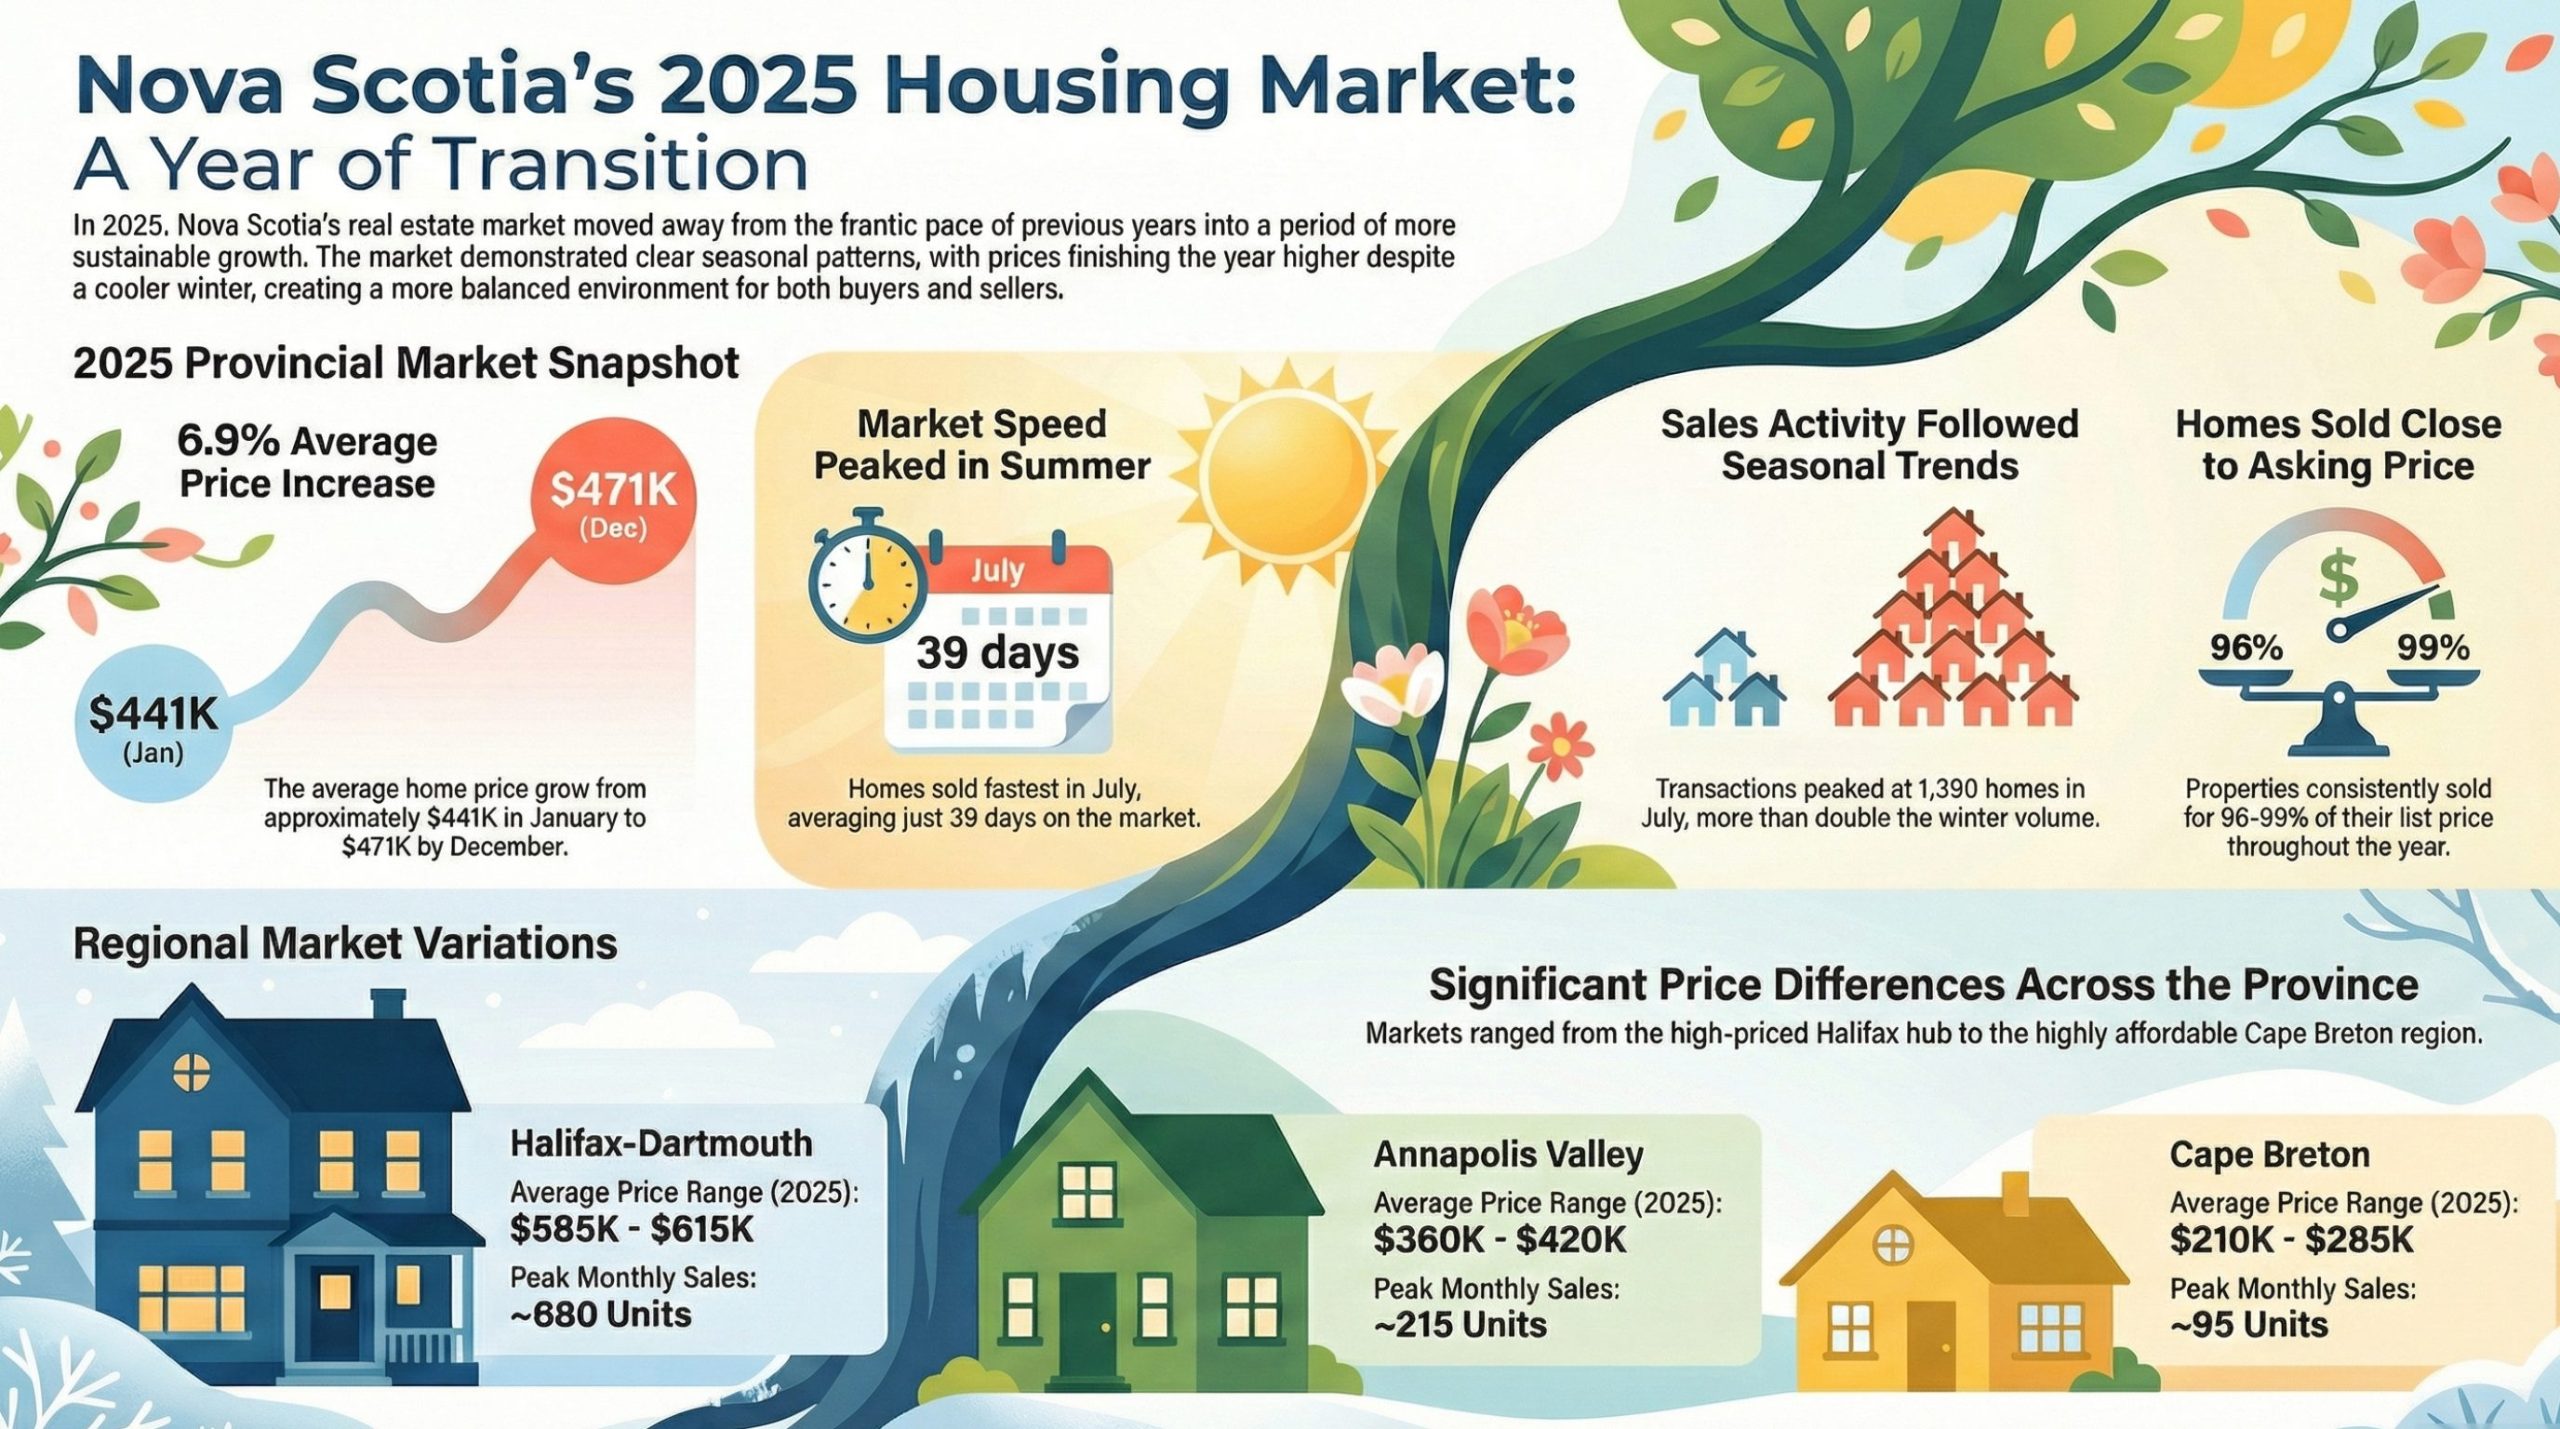
Nova Scotia Real Estate Market Statistics 2025: A Year of Transition
Nova Scotia’s 2025 resale market told a story of evolution. Rising prices met strong summer activity before cooling into winter, with average values still finishing the year above January levels. Homes continued to sell close to asking price throughout the year, though buyers gained modest negotiating room as days on market lengthened heading into the final quarter.
The provincial market demonstrated resilience despite seasonal shifts, maintaining relatively strong fundamentals even as the frenetic pace of previous years gave way to more measured conditions.
Understanding Nova Scotia’s 2025 Price Journey
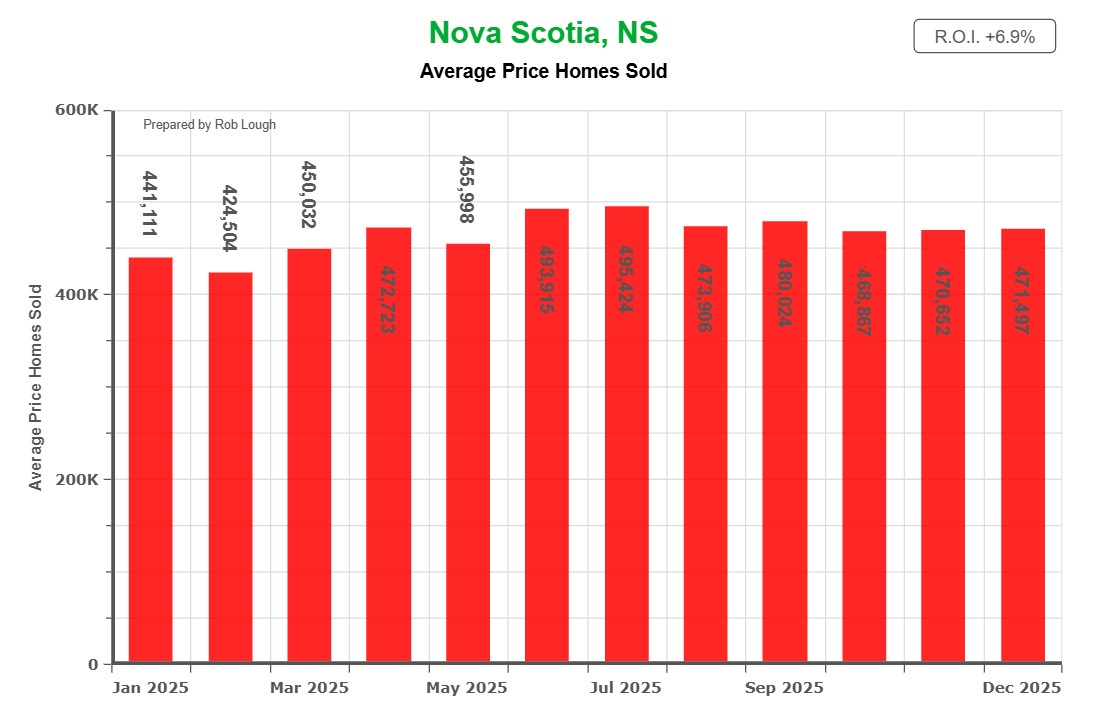
Nova Scotia average home sale price 2025 chart showing 6.9% annual increase from $441K in January to $471K in December with summer peak at $493K
Average sale prices in Nova Scotia started the year near the mid-$440s in January. Prices climbed steadily through spring and summer, reaching their peak in the high-$480s by midsummer. The market then experienced a gentle correction through fall, with prices settling into the low- to mid-$470s by December.
Understanding Nova Scotia home values requires looking beyond simple averages to seasonal patterns and broader economic forces.
This trajectory delivered sellers a modest year-over-year gain of approximately 6.9%, even with the softening conditions that characterized the final months. The price curve reflected typical seasonal patterns amplified by broader economic factors, including interest rate adjustments and shifting buyer sentiment.
For context, homes that sold for $441,111 in January commanded around $471,107 by December—a meaningful appreciation that still favored sellers while remaining more sustainable than the double-digit gains seen in earlier boom years.
Sales Activity: Summer Peak to Winter Valley
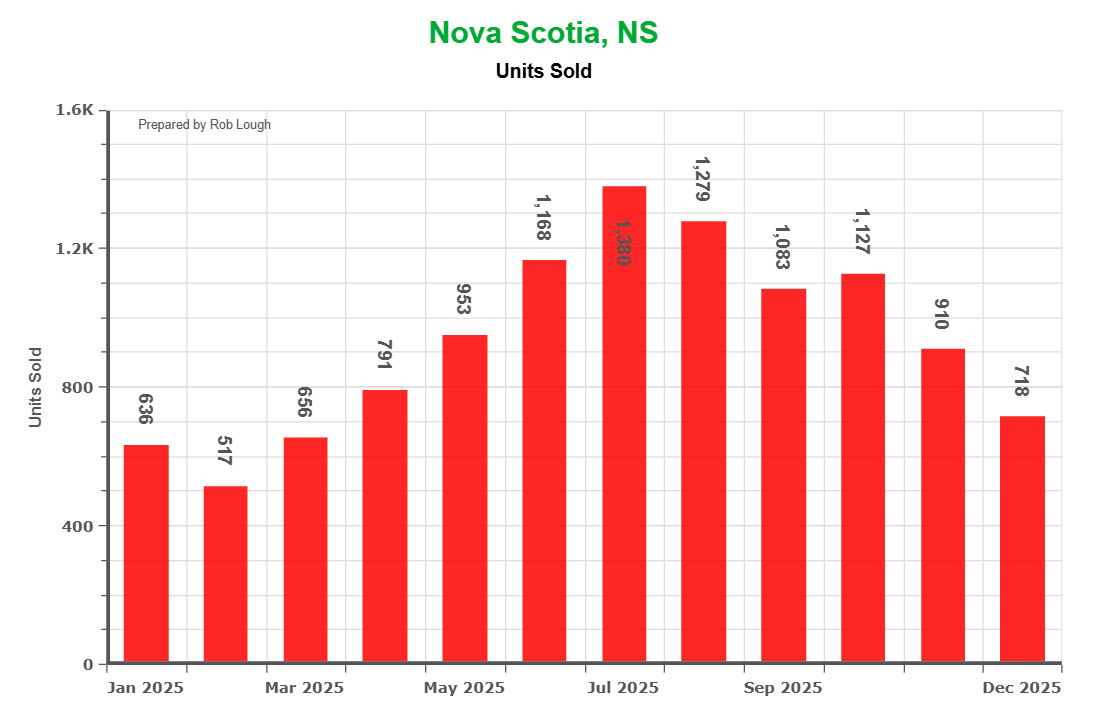
Nova Scotia homes sold by month 2025 ranging from 517 units in February to peak of 1,390 units in July before declining to 718 in December
Transaction volumes painted a clear seasonal picture. Unit sales began around 636 homes in January, climbed steadily through spring, and reached their zenith near 1,390 properties in July. From that midsummer peak, activity declined through each subsequent month, finishing the year at 718 sales in December.
This pattern mirrors traditional Nova Scotia real estate seasonality, where spring and summer months dominate activity as families time moves around school schedules and favorable weather conditions. However, the steeper decline in fall 2025 suggested broader market factors at play beyond typical seasonal trends.
The July peak represented more than double the January volume, underscoring how concentrated buying activity becomes during prime selling season. Sellers who listed during shoulder months faced notably fewer competing buyers, though they also encountered less competition from other listings.
Total Dollar Volume: The Market’s Pulse
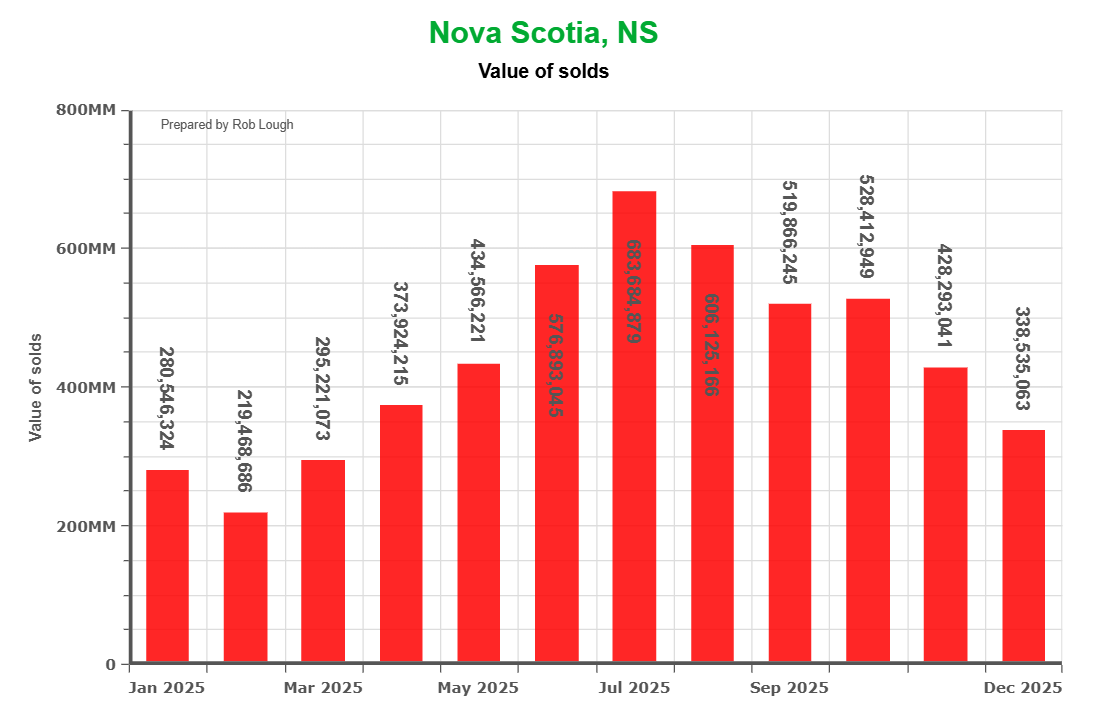
Nova Scotia real estate total sales value by month 2025 showing peak of $683 million in July and seasonal decline to $338 million by December
The total value of sales transactions closely tracked unit volumes, starting near $280 million in January and surging to approximately $683 million at the July peak. By December, total sales value had retreated to roughly $338 million.
This metric serves as perhaps the clearest barometer of overall market health. The summer surge demonstrated robust demand and pricing power, while the winter pullback reflected both fewer transactions and modest price softening. Still, December’s total exceeded January’s, indicating that even as activity slowed, the market maintained reasonable momentum.
For local economies across Nova Scotia, these transaction values represent significant economic activity. The summer months generated roughly $3.5 billion in total sales value, supporting real estate professionals, legal services, home inspectors, tradespeople, and retail sectors serving new homeowners.
Days on Market: Measuring Buyer Urgency
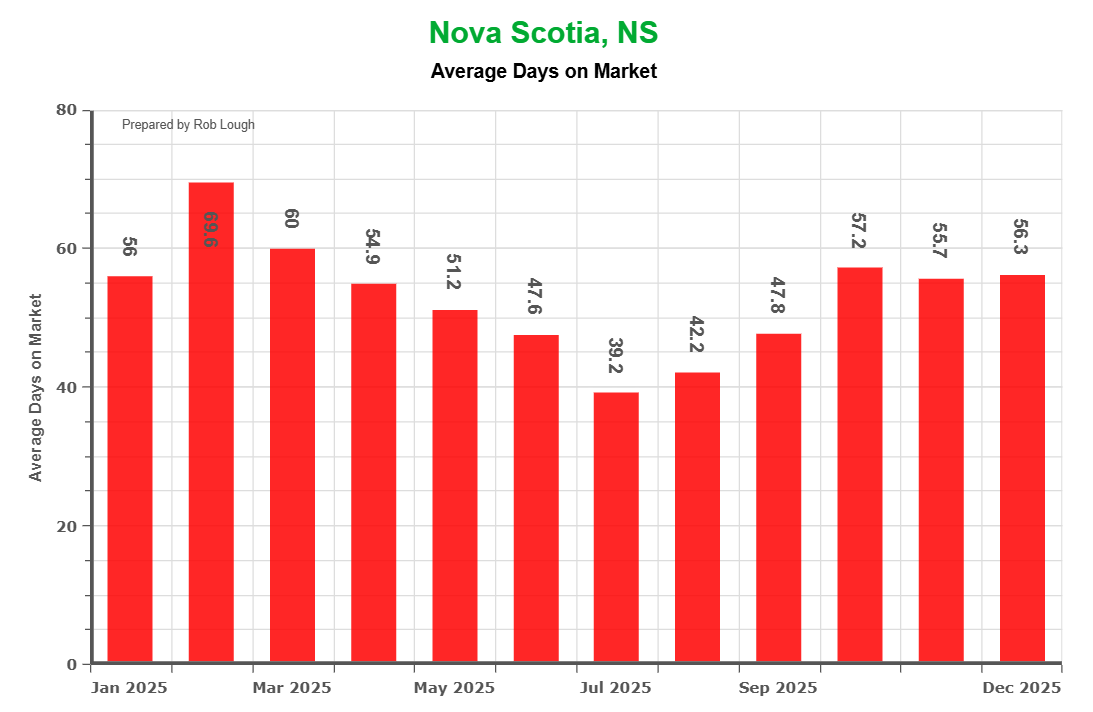
Nova Scotia 2025 average days on market chart ranging from 39 days in July peak season to 56 days in winter months
Properties spent an average of 56 days on market in January, with this timeline tightening to just 39 days by July before extending back to 56 days in December. This metric offers valuable insight into competitive pressure and buyer urgency.
The summer compression to under 40 days reflected peak season intensity, where well-priced properties often attracted multiple showing requests within days of listing. The return to mid-50s by year-end suggested buyers had regained some negotiating position and could take more time evaluating options without fear of immediate competition.
For sellers, these figures emphasize the importance of strategic timing and realistic pricing. Properties that linger beyond the average days on market often require price adjustments or may face increasing buyer skepticism about potential issues. For buyers, understanding these timelines helps set expectations around decision-making speed and offer competitiveness.
Sale-to-List Ratio: Pricing Precision and Negotiation Room
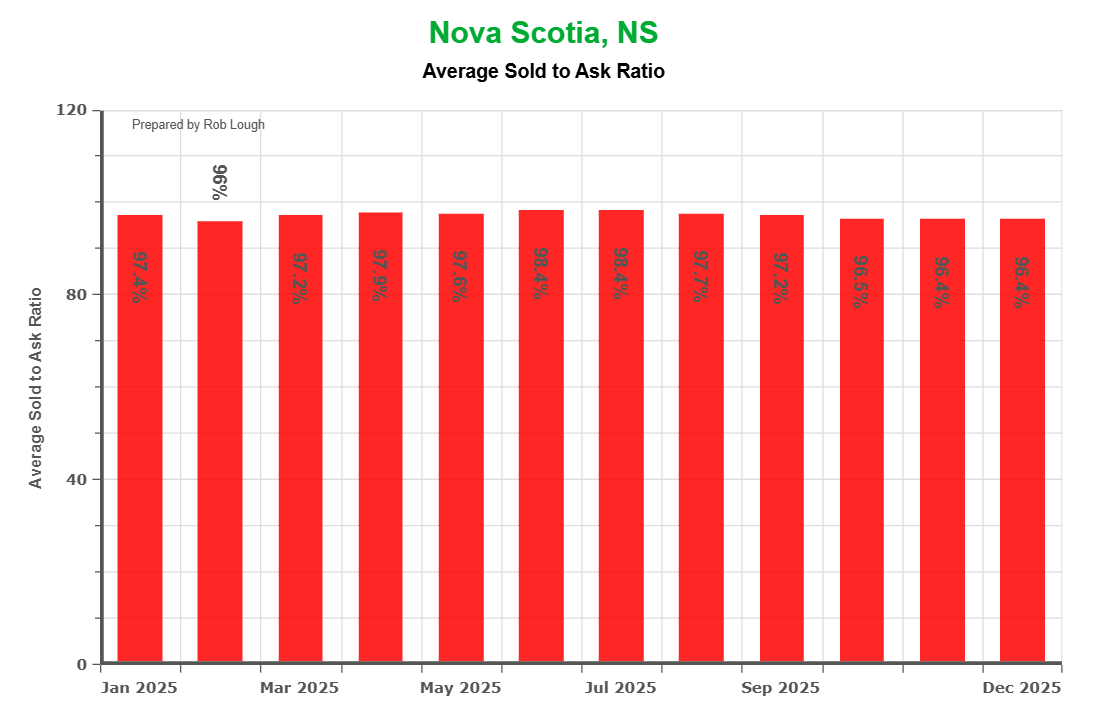
Nova Scotia 2025 sale-to-list price ratio chart showing homes consistently sold for 96-99% of asking price throughout the year
Throughout 2025, homes consistently sold for 96-99% of their asking prices, with ratios ranging from approximately 96.3% to 99%. This metric remained remarkably stable across all twelve months, indicating that sellers generally priced properties appropriately and buyers continued paying close to asking prices.
The slight downward drift from around 97.4% in summer to 96.3% by year-end suggests marginal increases in buyer negotiating power. While the difference seems modest, even a one to two percentage point shift on a $475,000 home represents $4,750 to $9,500 in potential savings.
These high sale-to-list ratios also indicate relatively few bidding wars compared to earlier pandemic-era conditions. When multiple offers drive prices above asking, ratios exceed 100%. The absence of such conditions in 2025 points to a more balanced market where strategic pricing matters more than artificial underpricing to generate competition.
Price and Units: The Relationship Between Volume and Value
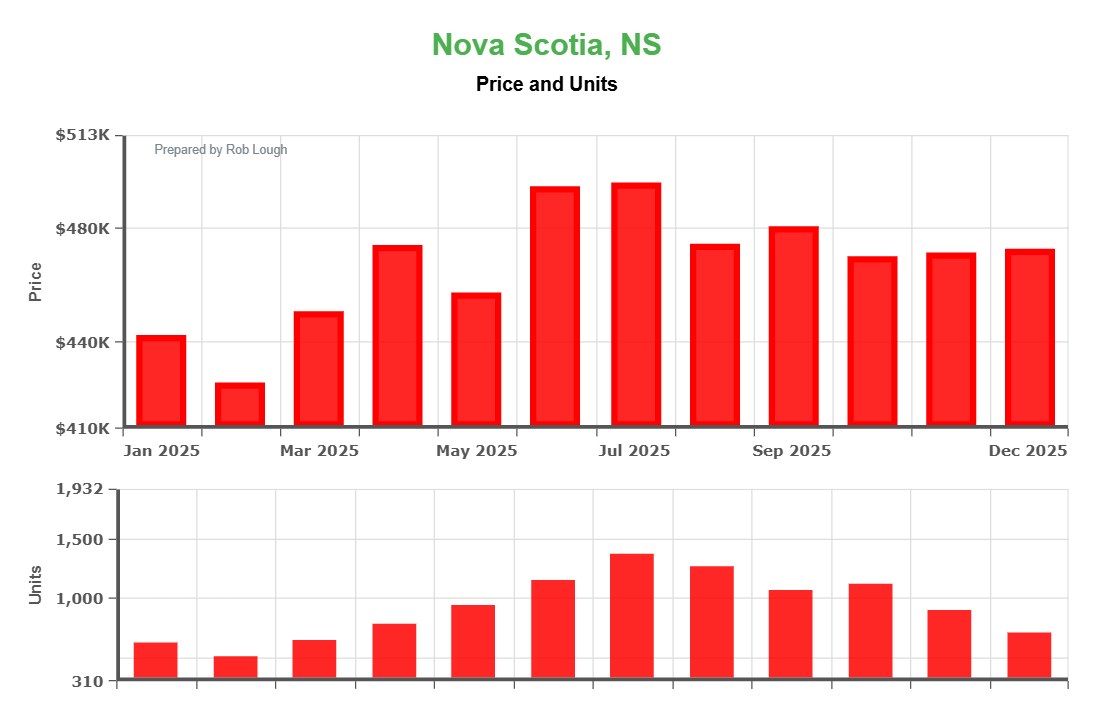
Nova Scotia 2025 home prices and sales units chart showing average prices from $425K to $495K with peak sales of 1,390 units in July
This dual-axis chart illustrates how pricing trends and transaction volumes intersected throughout 2025. The top portion shows average prices climbing from the low-$440s to nearly $500,000 at peak before settling back to the low-$470s. The bottom section displays unit volumes following their characteristic seasonal arc.
Notably, prices continued rising even as volumes began declining after July, demonstrating that motivated sellers maintained pricing discipline rather than chasing buyers with discounts. This pattern suggests underlying strength in the market despite cooling activity.
By December, the combination of moderate prices and reduced volume created opportunities for patient buyers willing to navigate winter conditions. Sellers still achieved reasonable prices, but faced smaller buyer pools and slightly longer marketing times.
What Buyers Should Know
The 2025 market offered more breathing room than recent years. With days on market extending and sale-to-list ratios showing modest softening, buyers regained some negotiating position. Properties no longer required split-second decisions, and conditional offers became more viable.
Spring and summer remained intensely competitive, with July representing peak activity and minimal inventory. Buyers who could tolerate shoulder seasons—particularly late fall and winter—faced less competition and gained stronger negotiating positions.
The high sale-to-list ratios throughout the year emphasized the importance of offering reasonably close to asking prices on well-priced properties. Lowball offers rarely succeeded, even in slower months, as sellers generally understood their properties’ market value.
What Sellers Should Know
Strategic timing and realistic pricing drove 2025 success. Properties listed during spring and early summer attracted maximum buyer attention, typically selling within 40-50 days at or near asking price. Fall and winter listings required more patience but still achieved reasonable prices.
The 6.9% average appreciation rewarded homeowners who had purchased in previous years while remaining sustainable enough to attract qualified buyers. Sellers who overpriced—expecting earlier boom-era returns—often found themselves reducing prices after extended market time.
Understanding days on market trends proved crucial. Properties that sold within the 40-60 day window typically achieved strong prices. Those exceeding this timeframe often signaled pricing issues or property-specific concerns requiring attention.
Regional Market Variations Across Nova Scotia
While provincial trends provide a useful overview, Nova Scotia’s real estate market demonstrates significant regional variation. Understanding these local differences helps buyers and sellers make more informed decisions based on their specific geographic area.
Halifax-Dartmouth: The Urban Hub
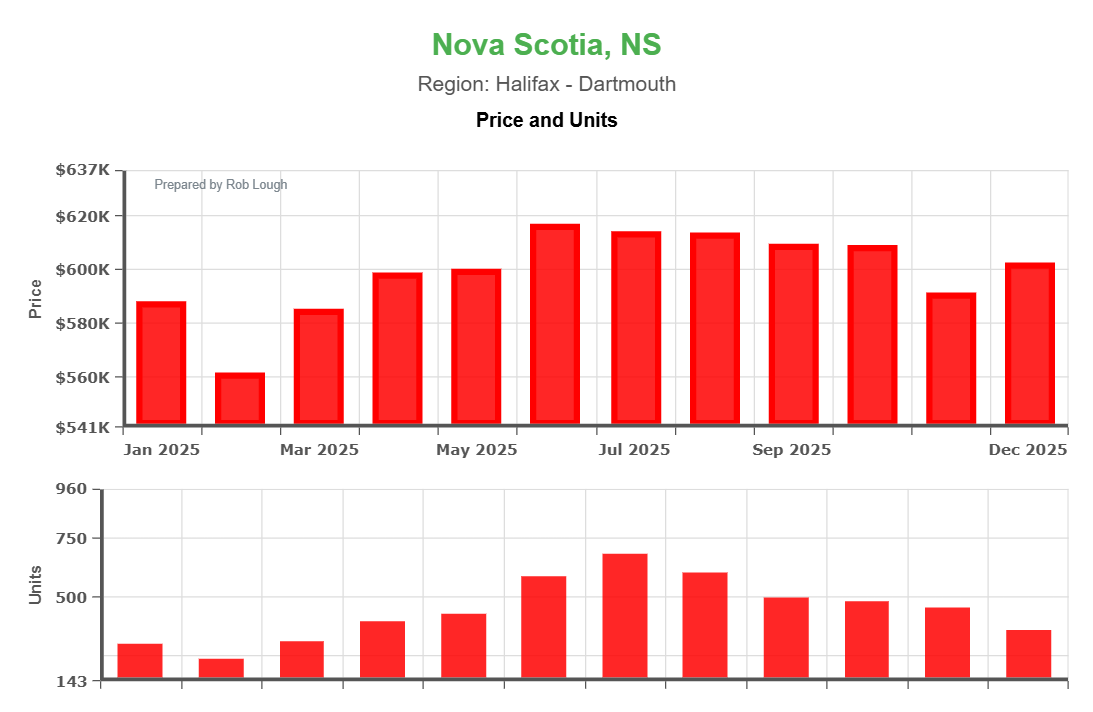
Halifax-Dartmouth Nova Scotia 2025 real estate chart showing average prices $585K-$615K with peak sales of 680 units in July
Halifax-Dartmouth maintained its position as Nova Scotia’s highest-priced market, with average sale prices ranging from the mid-$580s to low-$610s throughout 2025. Transaction volumes peaked around 680 units in July before declining to approximately 330 units by December. The region’s relatively stable pricing reflects strong employment fundamentals and sustained demand from both local upgraders and newcomers to the province.
Annapolis Valley: Affordable Appeal
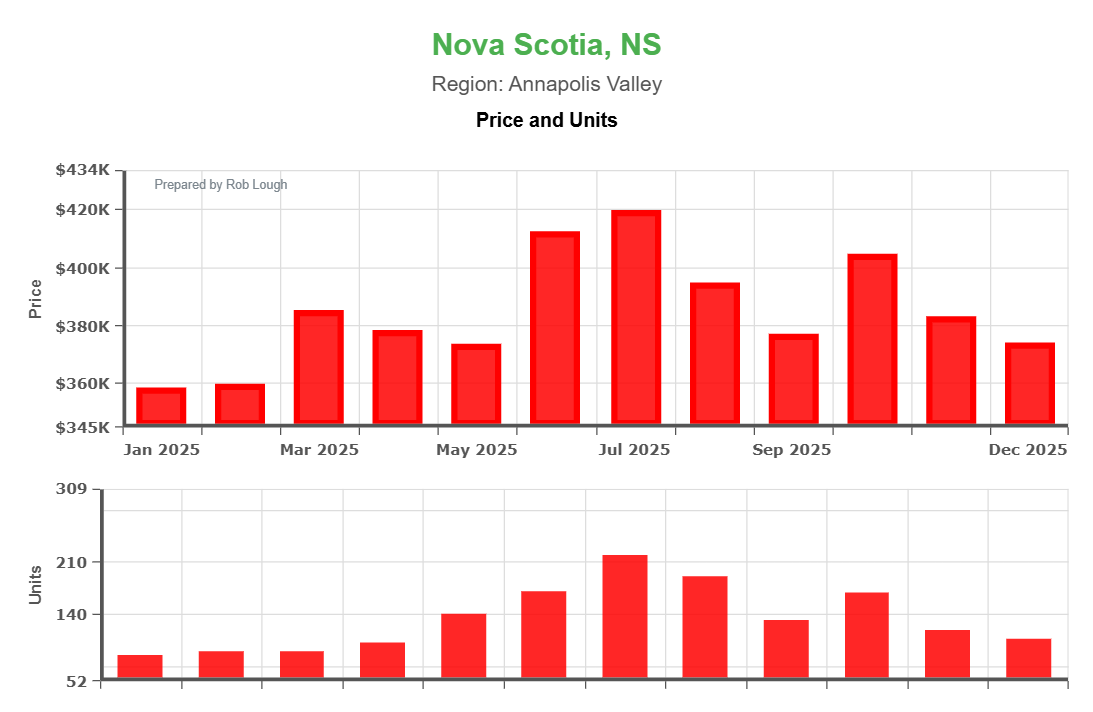
Annapolis Valley Nova Scotia 2025 real estate chart showing affordable average prices $360K-$420K with peak sales of 215 units in July
The Annapolis Valley offered compelling value, with average prices hovering between the mid-$350s and low-$420s. Summer months saw peak activity around 215 units sold, demonstrating the region’s growing appeal to buyers seeking rural lifestyles within reasonable commuting distance to larger centers. The valley’s agricultural heritage combined with its scenic beauty continues attracting retirees and remote workers.
South Shore: Coastal Premium
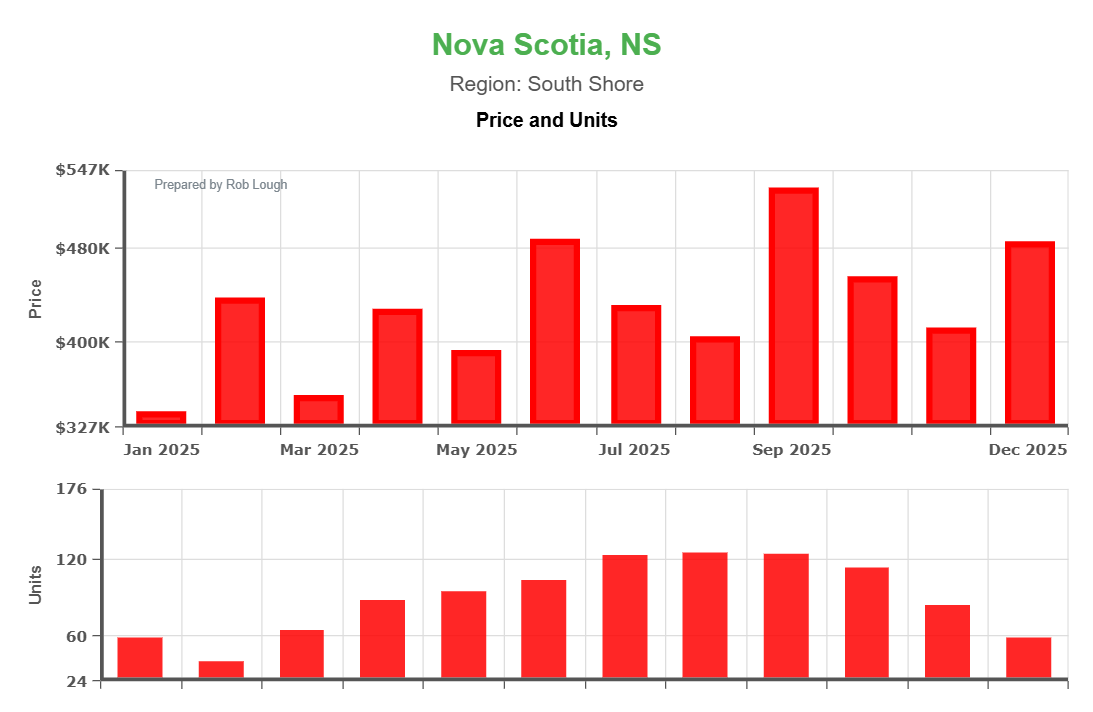
South Shore Nova Scotia 2025 coastal real estate chart showing prices $350K-$540K with peak sales of 125 units during summer months
South Shore properties commanded prices between approximately $350,000 and $540,000, reflecting the premium associated with coastal locations. Peak summer activity reached around 125 units, with the region showing more pronounced seasonal patterns than urban areas. The South Shore’s combination of ocean access, tourism infrastructure, and quality of life makes it particularly attractive to seasonal residents and retirees.
Cape Breton: Value Island
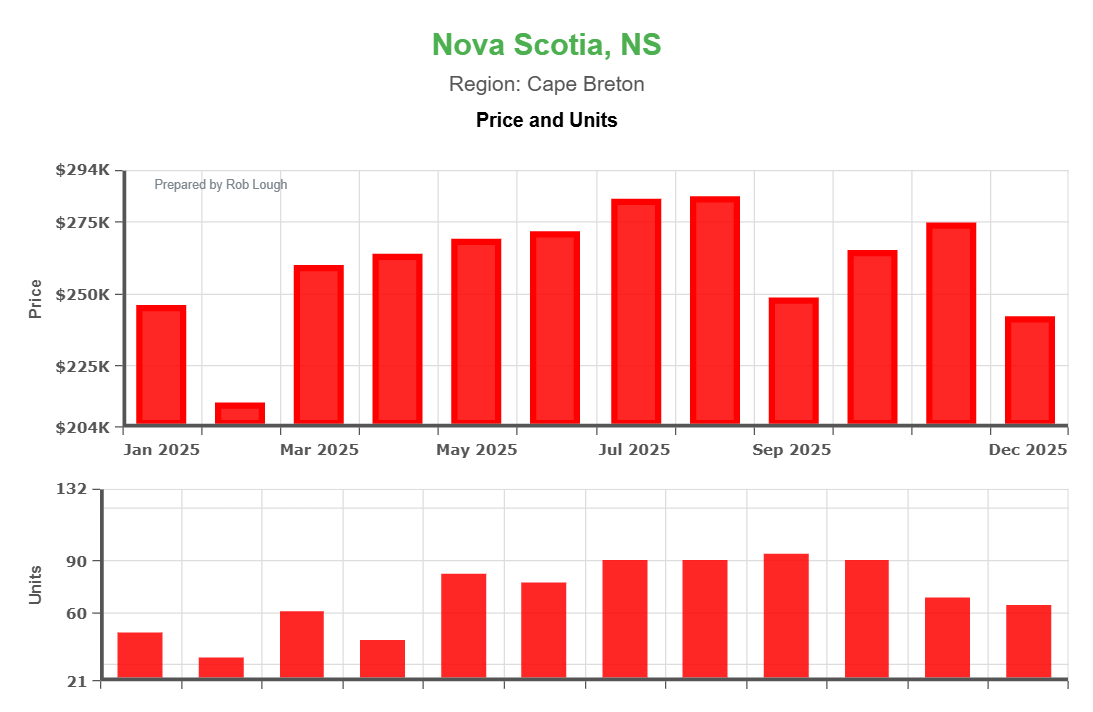
Cape Breton Nova Scotia 2025 most affordable real estate market chart showing prices $210K-$285K with peak sales of 95 units in summer
Cape Breton remained Nova Scotia’s most affordable region, with average prices ranging from roughly $210,000 to $285,000. Despite lower price points, the region demonstrated healthy transaction volumes peaking near 95 units during summer months. Cape Breton’s dramatic landscapes, Celtic culture, and exceptional affordability continue drawing value-conscious buyers and investors.
Northern Region: Steady Demand
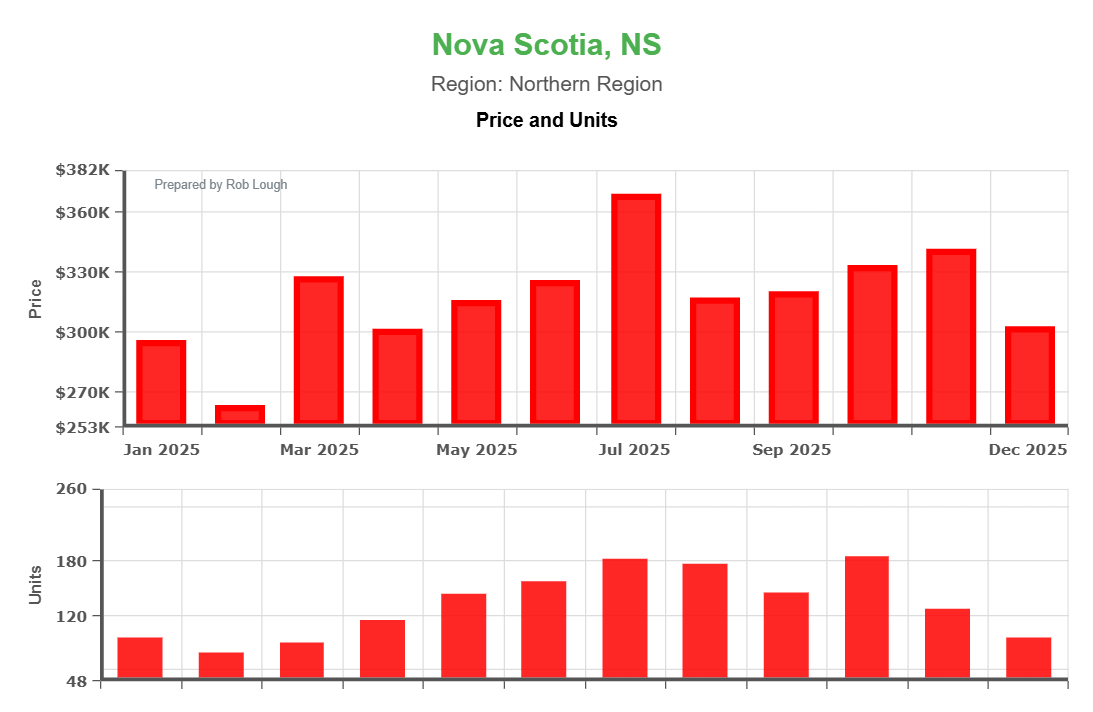
Northern Region Nova Scotia 2025 real estate chart including Truro area showing prices $265K-$370K with peak sales of 180 units in July
The Northern Region, encompassing areas like Truro and surrounding communities, saw prices between approximately $265,000 and $370,000. Summer peak activity reached around 180 units, reflecting the region’s role as a service hub for central Nova Scotia. The area’s strategic location at the crossroads of major highways supports consistent demand.
Highland Region: Rural Retreat
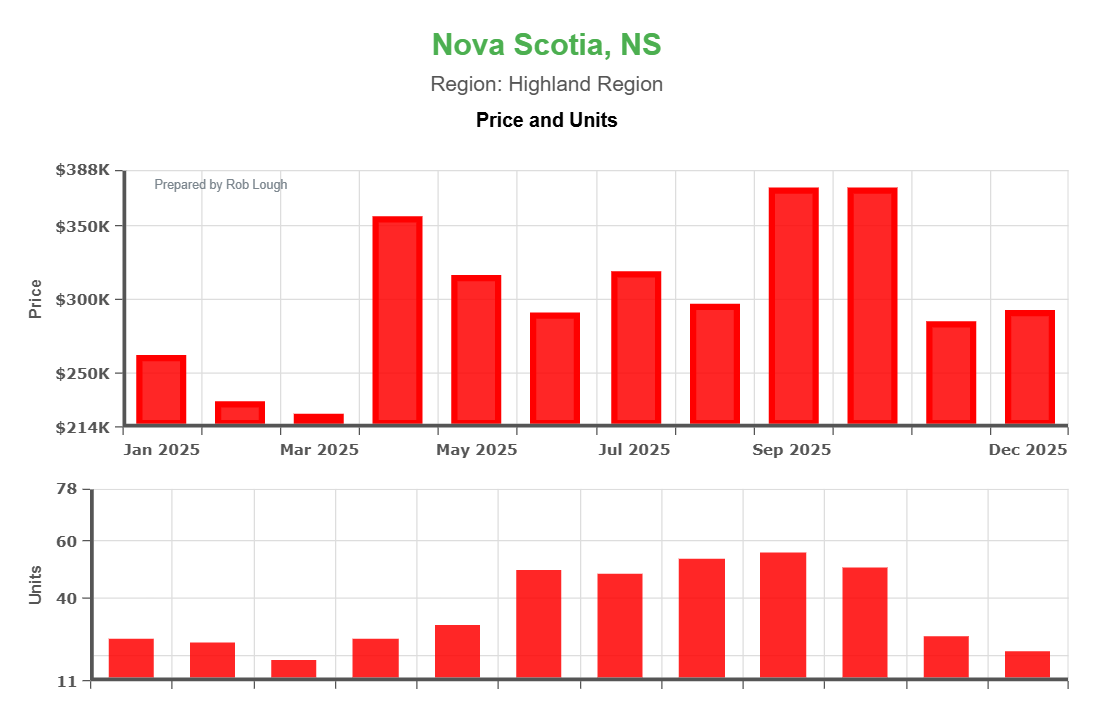
Highland Region Nova Scotia 2025 rural real estate chart showing prices $220K-$375K with peak sales of 55 units in summer months
The Highland Region posted prices ranging from roughly $220,000 to $375,000, with summer transaction volumes reaching around 55 units. This smaller market serves buyers seeking rural properties, hunting camps, and recreational land. The region’s lower volumes mean individual transactions can have more pronounced impacts on monthly statistics.
Looking Ahead to 2026
Nova Scotia’s 2025 market demonstrated maturation from the explosive growth of earlier years toward more sustainable patterns. Prices maintained upward trajectory while competition levels normalized, creating a more balanced environment that serves both buyers and sellers reasonably well.
The seasonal patterns that defined 2025 will likely persist into 2026, with spring and summer commanding premium activity levels. However, the continued moderation of sale-to-list ratios and stabilizing days on market suggests that extreme seller’s market conditions have given way to more neutral territory.
For buyers, this evolution means opportunity—particularly for those who can be flexible on timing and remain patient during negotiations. For sellers, it underscores the importance of working with experienced real estate professionals who understand local market nuances and can price properties competitively from the outset.
Whether you’re planning to buy or sell in 2026, understanding these 2025 trends provides valuable context for making informed decisions in Nova Scotia’s evolving real estate landscape.
Thinking about buying or selling in Nova Scotia? Contact Century 21 Optimum Realty for expert guidance on navigating Nova Scotia’s real estate market. We have Agents from the South Shore to Cape Breton!

